Amphenol (APH) Has Rallied in 8 of 8 Midterm Windows Starting Jul 1, Averaging 23.44% Gains
Amphenol is heading toward a historically powerful 278-day seasonal window just as shares trade below their 52-week high and investors focus on AI and communications demand.

What is the seasonal pattern for Amphenol (APH)?
Amphenol has risen in 8 of 8 midterm-election-year windows starting Jul 1 and lasting 278 days, with an average gain of 23.44% in winning years.
- 8 for 8 in this window, averaging 23.44% gains in winning years across the last eight midterm election cycles.
- Percent Profitable is 100%, with 8 winners and 0 losers in this 278-day Amphenol trading window.
- The pattern is long-biased, with cumulative returns of 423% and an annualized return of 22.99% across the sample.
- TradeWave Ratio of 1.95 suggests Amphenol typically travels meaningfully in the trade direction within the window before it closes.
- A Sharpe ratio of 1.79 points to strong risk-adjusted performance for this APH seasonal trend in midterm election years.
- Individual years have still seen sizable intraperiod drawdowns, so even a historically strong window has required sitting through volatility.
According to historical data from TradeWave.ai, Amphenol’s behavior around midterm election years has followed a distinct seasonal script that most investors never see in standard research.
How has Amphenol (APH) traded in this midterm-year seasonal window?
Amphenol has posted gains in every one of the last eight midterm-election-year windows that start on Jul 1 and run for 278 trading days, averaging 23.44% per cycle. Today the stock closed at 147.50, leaving it about 11.3% below its 52-week high of 166.38 and up roughly 8.0% over the past month, a setup that puts it in striking distance of prior highs as the next window approaches.
The presidential election cycle matters here because this pattern only looks at the last eight midterm election years, a phase that often brings policy noise, spending debates and sector rotation in industrial and communications names. Grouping Amphenol’s history this way strips out other years and focuses on how the stock has behaved when Washington is in the middle of the four-year cycle and investors are already looking ahead to the pre-election year.
The long-bias is clear in the stats. Percent Profitable sits at 100%, with 8 winners and 0 losers, and the average gain of 23.44% lines up with a median profit of 21.16%, which means the typical outcome has been a double-digit advance rather than a one-off outlier. The cumulative return across these eight cycles is 423%, and the annualized return of 22.99% reflects how powerful this specific Amphenol trading window has been when it lines up with the midterm election year.
Risk-adjusted performance has also been strong. A Sharpe ratio of 1.79 indicates that the historical returns in this APH seasonal trend have come with volatility, but the payoff has more than compensated for that noise on average. The TradeWave Ratio of 1.95 suggests that within the window, Amphenol typically travels meaningfully in the long direction before the trade is closed, which is consistent with the sizable maximum favorable moves seen in several years.
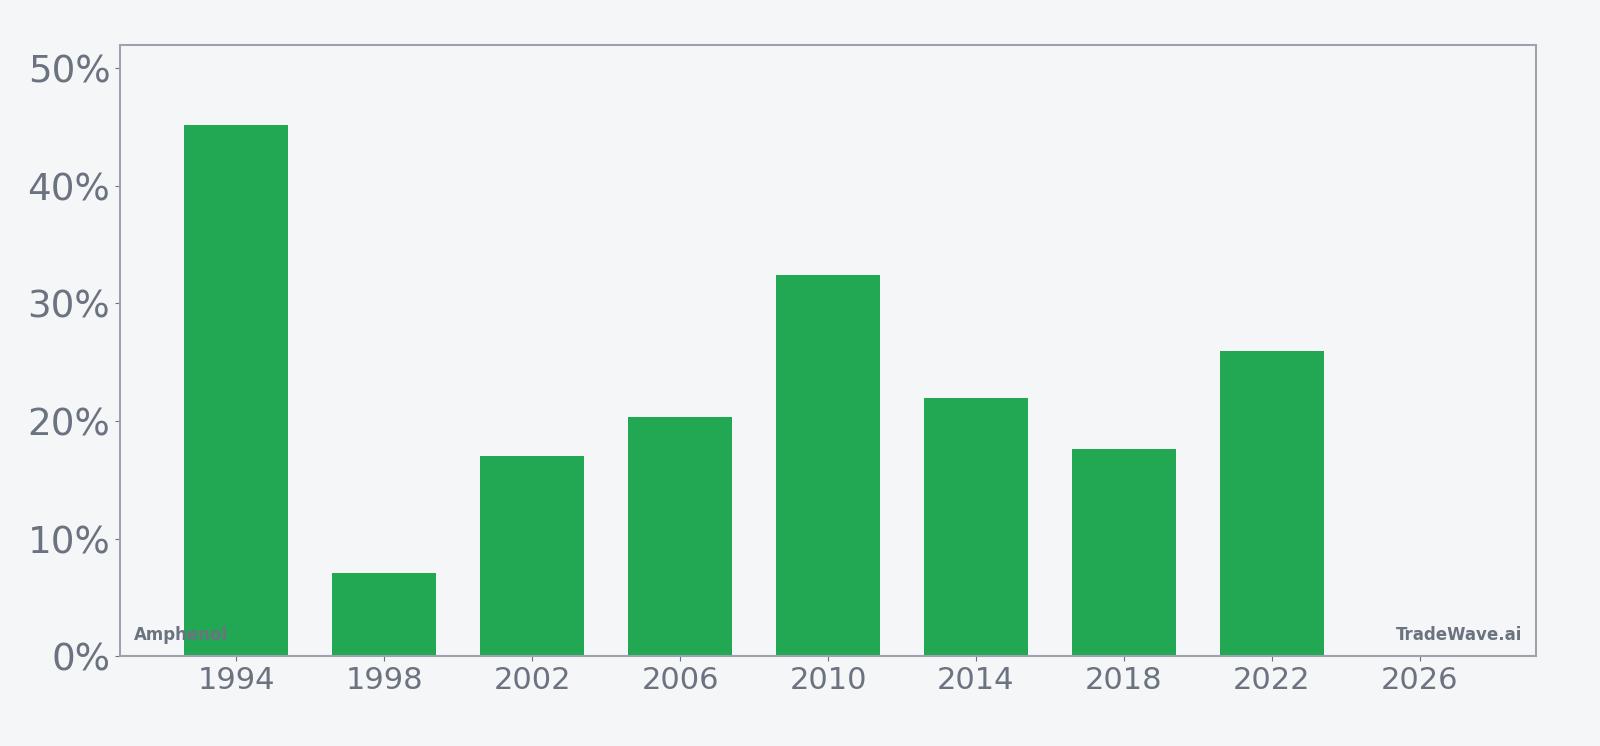
Looking at individual cycles, 1994 stands out with a 45.19% net return and a peak run-up of 62.98% from entry, while 2010 delivered a 32.40% gain with a 49.62% best intraperiod move. Even the “softest” year in the sample, 1998, still finished up 7.05%, though it experienced a maximum adverse move of -25.65% at one point, showing that the path to a positive finish can be rough. Other years such as 2002, 2006, 2014, 2018 and 2022 all posted mid-teens to mid-20s gains, reinforcing the consistency of the APH seasonal pattern.
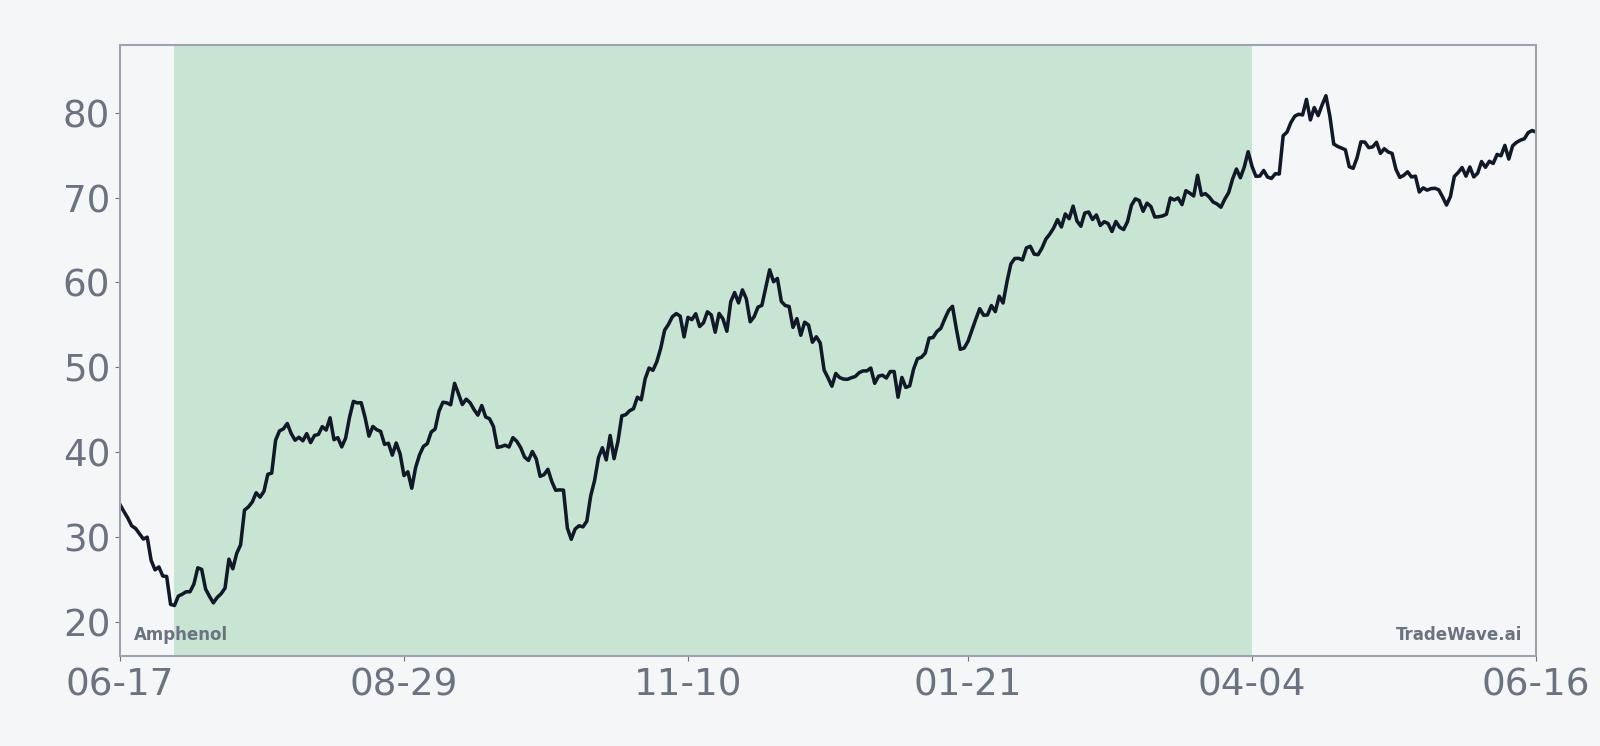
The historical seasonal average trend chart shows a tendency for gains to build over the life of the 278-day window rather than spike in a single burst. The curve climbs in stages, with periods of consolidation and pullback, which matches the per-year record where several cycles saw modest early drawdowns before the longer uptrend reasserted itself. For a long-only seasonal strategy, that profile has rewarded patience more than precision timing.
Year-by-year bars that combine net results with peak rallies and worst drawdowns put that trade-off between upside and volatility into sharper focus.
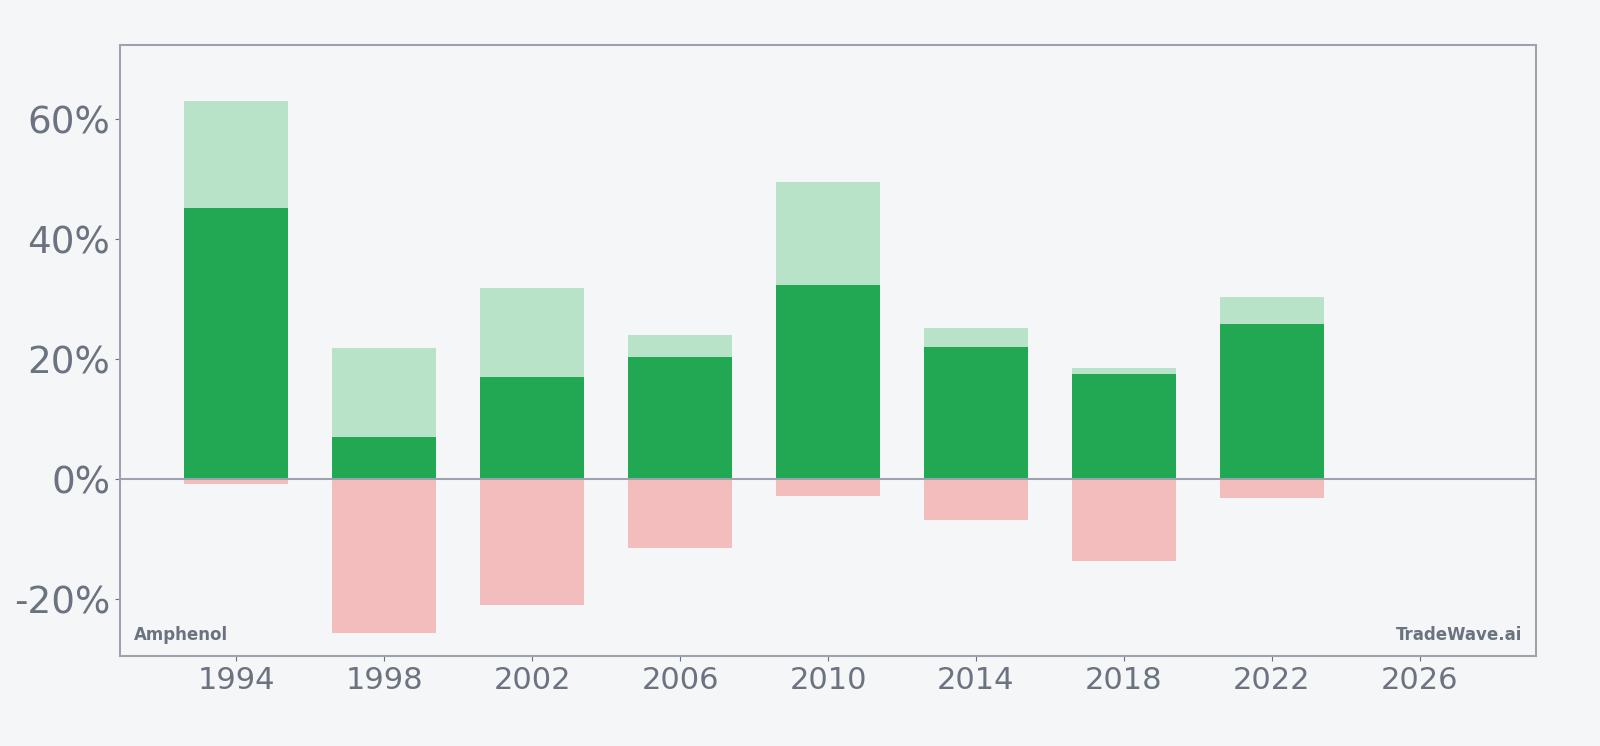
The combined net/MFE/MAE bars show that in strong years like 1994 and 2010, Amphenol not only finished higher but also spent time far above the entry level, with peak rallies of more than 40% before settling back. At the same time, years such as 1998 and 2002 carried double-digit worst drawdowns from entry, even though they ultimately closed in the green. Add it up: eight straight winning windows, but several required sitting through 10% to 25% downside at some point along the way.
History does not guarantee future results; adverse excursions can be large even in winning windows, and traders using this pattern still face the risk of sizable drawdowns.
Why does Amphenol (APH) follow this seasonal pattern?
One likely driver is the way Amphenol’s earnings and capital spending cycles line up with the midterm election year, when communications and defense budgets often get clearer and large customers lock in orders. Analysts have also pointed to institutional portfolio repositioning around the shift from the midterm year into the typically stronger pre-election year, which can favor high-quality industrial and connectivity names. This APH seasonal trend may reflect that combination of budget visibility, sector rotation and long-cycle infrastructure projects tied to data centers and defense programs.
What is driving Amphenol (APH) today?
Amphenol slipped 0.61% to 147.50 on Thursday, trading in a 146.01 to 151.92 intraday range and sitting about 11.3% below its 52-week high of 166.38, after an 8.0% gain over the past month and with 20-day average volume around 12.5 million shares. The stock’s longer-term backdrop has been shaped by AI-driven data center demand, where new architectures are increasing content per rack and supporting expectations for strong AI-related revenue growth for Amphenol’s interconnect and cable assemblies.[1]
In August 2025, Amphenol agreed to acquire Trexon, a defense interconnect and cable-assembly provider, for about $1 billion in cash, a deal that was expected to add roughly $290 million of 2025 sales and deepen the company’s exposure to defense markets.[3] Earlier that same month, a report said Amphenol was set to acquire a CommScope unit for $10.5 billion, a move that would materially expand its communications footprint and scale if completed.[2] These transactions, while dated, underline how management has been using M&A to bulk up in communications and defense niches that sit at the center of today’s connectivity and security themes.
On the macro side, the key storyline for Amphenol remains the buildout of AI data centers and high-speed networks, where content per system is rising and new designs from major chipmakers are driving demand for high-performance connectors and cable assemblies.[1] That sector backdrop helps explain why investors are watching the upcoming midterm-year seasonal window closely: it overlays a historically strong APH seasonal trend on top of a structural growth narrative in communications and defense interconnects.[3]
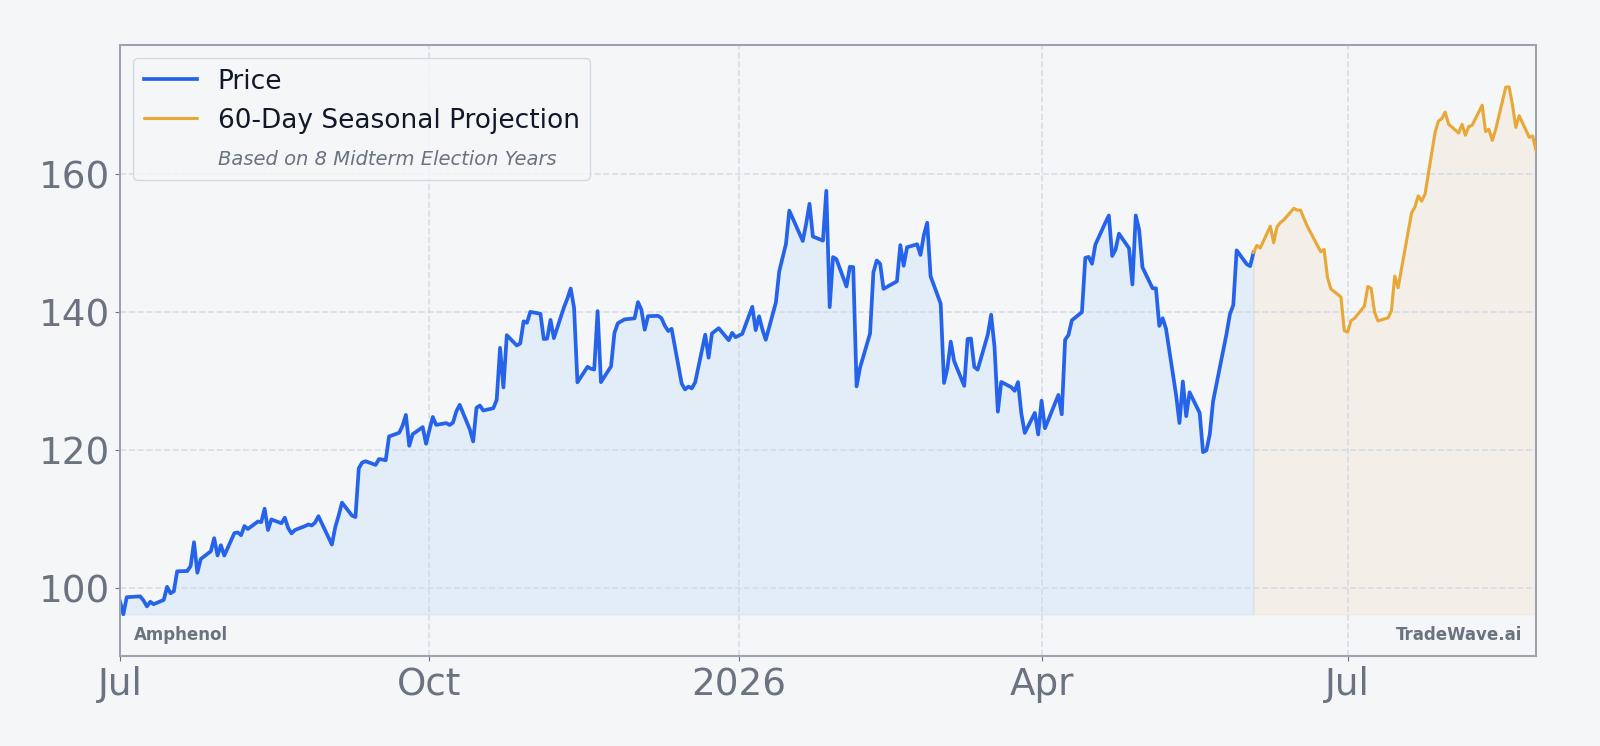
The chart below situates the latest move against Amphenol’s past year of trading and a short-term seasonal projection.
What should traders watch as this Amphenol (APH) window approaches?
First, the calendar: the next iteration of this 278-day APH seasonal window begins on Jul 1, squarely in the midterm election year and running deep into the year before the presidential election. Historically, that transition from midterm to pre-election has been a supportive backdrop for Amphenol in this specific slice of the calendar. Traders will be watching whether the stock can hold above its 50-day moving average around 136.94 and whether any pullbacks ahead of July resemble the 10% to 25% intraperiod drawdowns seen in past winning years.
Second, the policy and spending tape will matter. Any updates on communications infrastructure budgets, defense appropriations or AI data center capex could either reinforce or challenge the historical APH seasonal trend tied to this election-cycle phase. Finally, behavior inside the window will be the real test: if Amphenol again shows a pattern of building gains over the 278 days with rallies that outpace drawdowns, it would echo the last eight midterm-year cycles. A choppier or outright negative stretch would mark a clear break from the historical seasonality and signal that fundamentals or positioning have shifted.
Sources
About this seasonal analysis
Seasonal pattern data is sourced from TradeWave.ai, which analyzes historical price behavior across annual calendar windows going back up to 30 years. Read the full data methodology or the book The 100-Year Pattern by Afshin Moshrefi (2026 edition). Past performance of seasonal patterns does not guarantee future results. This article is for informational purposes only and does not constitute investment advice.