10-for-10 Midterm Win Streak: Merck & Co. (MRK) Enters a 218-Day Window Averaging 20% Gains
Merck & Co. is heading into a 218-day midterm-election-year seasonal window with a perfect win record, just as the stock trades near its 52-week high and investors weigh oncology pipeline bets.

What is the seasonal pattern for Merck & Co. (MRK)?
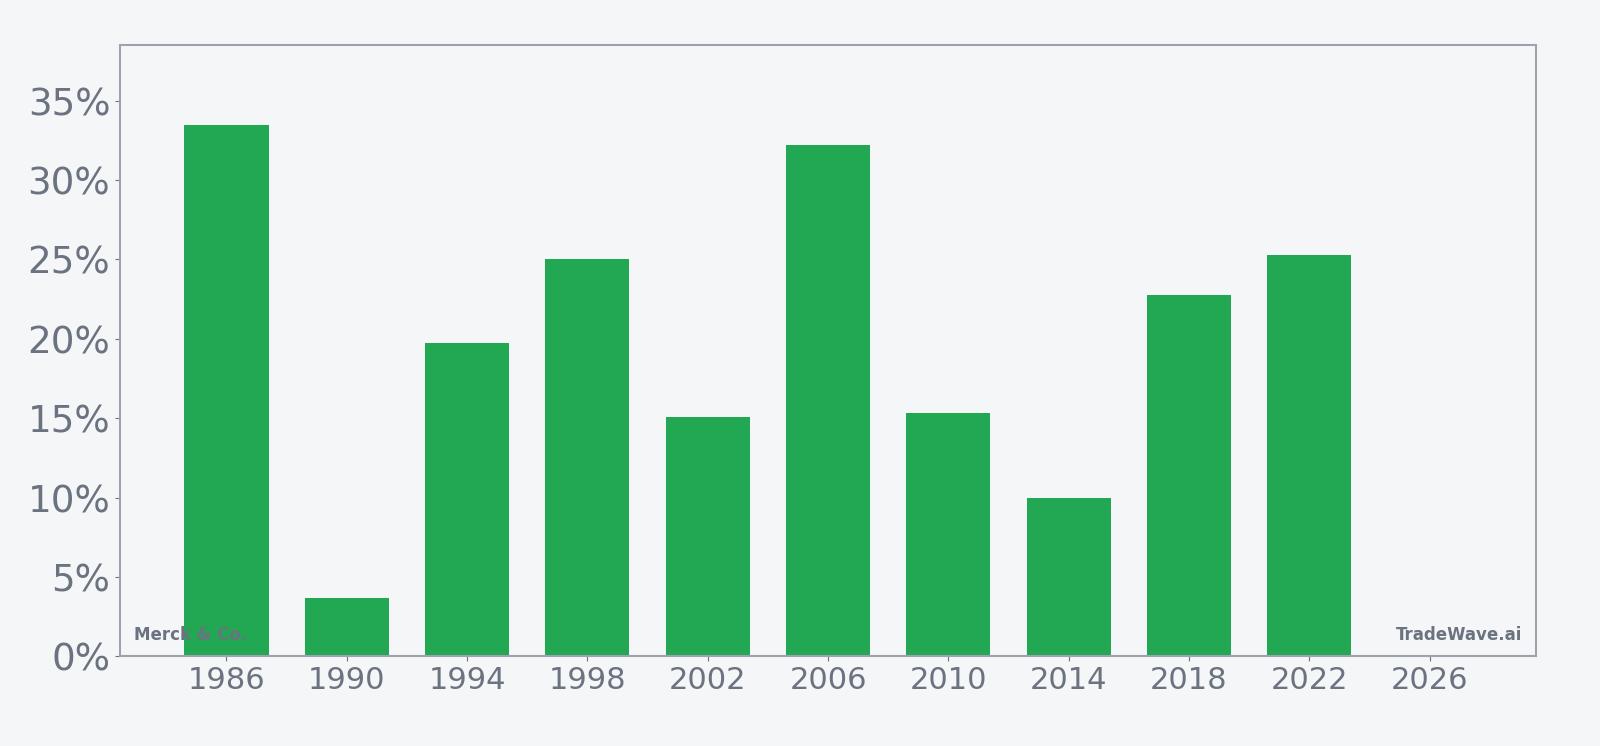
Merck & Co. has risen in 10 of 10 midterm-election-year windows starting around Jun 7, with an average gain of 20.26% in winning years.
- 10 for 10 in this window, with average gains of 20.26% across all winning years.
- The upcoming 218-day window begins Jun 7 and has historically favored long positions in Merck & Co. during midterm election years.
- Percent Profitable is 100%, with 10 winners and 0 losers across the last 10 comparable cycles.
- Median profit in the window is 21.26%, pointing to a consistently strong MRK seasonal trend rather than a single outlier year.
- Intraperiod swings have been meaningful, with some years showing double-digit drawdowns even as the stock finished higher.
- The pattern aligns with the midterm-to-pre-election phase, when healthcare policy and spending expectations often reset.
According to historical data from TradeWave.ai, this is one of Merck & Co.’s most distinctive election-cycle windows, and the next iteration is only days away.
How strong is Merck & Co. (MRK) in this midterm-year seasonal window?
Merck & Co. has posted gains in every one of the last 10 midterm-election-year windows that start around Jun 7 and run for 218 trading days, averaging a 20.26% profit for long positions. Today the stock closed at $118.72, down 1.0% on the session, leaving it about 4.3% below its 52-week high of $124 and up 5.6% year to date. That combination of a strong historical seasonal pattern and a stock hovering near the top of its one-year range gives this upcoming Merck & Co. trading window unusual weight for investors watching the healthcare sector’s seasonal outlook.
The pattern is built on the last 10 midterm election years, a phase when Washington often shifts from early-term policy experimentation to positioning for the next presidential race. For a large drugmaker like Merck & Co., that mid-cycle stretch tends to coincide with clearer visibility on reimbursement, pricing rules and research funding, which can support a steadier bid for healthcare stocks even as other sectors chop around.
Across those 10 cycles, the long trade direction has been unambiguous. Percent Profitable is 100%, with 10 winners and no losing years, and the median profit of 21.26% sits close to the average, which suggests the MRK seasonal trend has been broadly consistent rather than driven by a single blockbuster outlier. Add it up: the cumulative return across these windows is 514%, with an annualized return of 19.92% for this specific slice of the calendar.
Looking at individual years, 2006 stands out with a 32.23% net gain and a maximum favorable move of 37.81% from the entry price, while 1990 is the softest outcome with a 3.68% net return and a relatively modest 11.81% best run-up. Even in that weaker year, the stock still finished higher by the end of the window. The strongest recent example is 2022, when Merck & Co. gained 25.29% in this window, with a peak intraperiod rally of 30.58% from the starting level.
Intraperiod risk has been real, even in this clean win streak. The worst drawdown within a single window came in 2002, when the stock was down as much as 26.92% from the entry before recovering to finish the period with a 15.1% gain. Other years, such as 1994 and 2018, saw maximum adverse moves of -6.45% and -2.79% respectively, showing that some cycles offered a smoother ride while others demanded more tolerance for volatility.
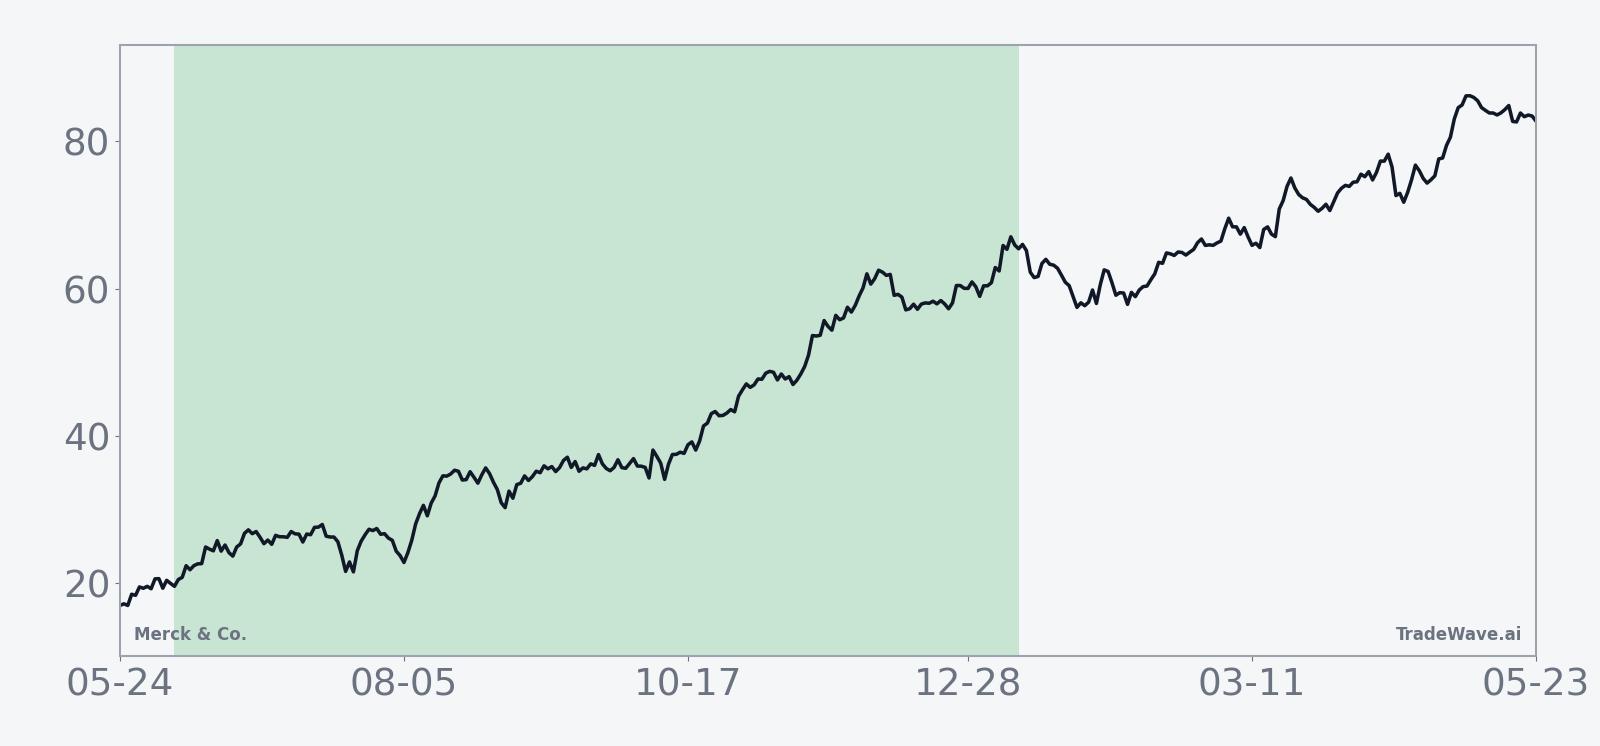
The historical seasonal average trend for this window slopes higher for most of the period, with gains tending to build rather than spike and fade. In several years, including 1998, 2006 and 2022, the stock advanced steadily after the June start, suggesting that the typical pattern shows strength that persists well into the following pre-election year rather than a short-lived pop.
A closer look at yearly net returns alongside peak rallies and worst drawdowns shows how upside and downside have coexisted inside this bullish window.
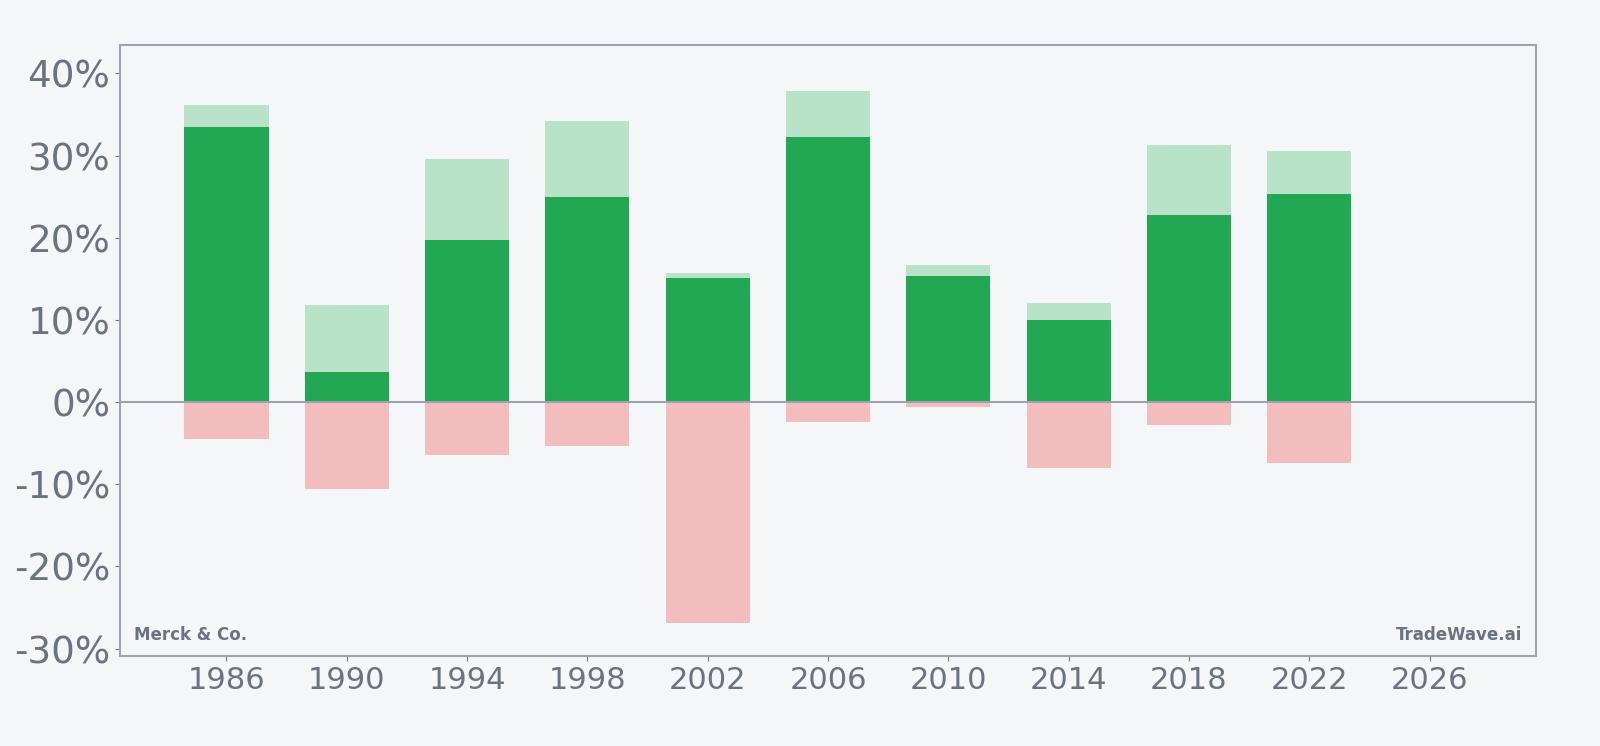
The combined net, maximum favorable move and maximum adverse move profile shows a window that has historically offered sizable upside with contained but sometimes sharp pullbacks. In most years, the maximum favorable excursion sits well above the final net gain, which means rallies often overshoot before consolidating, while the adverse excursions cluster in the single digits except for a few stress periods like 2002. The Sharpe ratio of 1.89 and a TradeWave Ratio of 2.25 underline that, on a risk-adjusted basis, this has been one of Merck & Co.’s more efficient long windows in the election cycle.
History does not guarantee future results; adverse excursions can still be large inside a winning seasonal window, and past patterns may not repeat.
Why does Merck & Co. (MRK) follow this seasonal pattern?
This midterm-to-pre-election stretch likely reflects a mix of policy clarity and institutional positioning. One likely driver is that healthcare legislation and reimbursement rules tend to be clearer by the middle of a presidential term, which can reduce headline risk for large drugmakers and support steady portfolio allocations. At the same time, many asset managers rebalance into defensive growth sectors like pharmaceuticals as they navigate mid-cycle economic uncertainty, and Merck & Co.’s oncology and vaccine franchises often sit at the center of that rotation.
What is driving Merck & Co. (MRK) today?
Merck & Co. finished Monday at $118.72, down 1.17 points on the day, after trading between $118.19 and $120.67 on volume of about 16.6 million shares, versus a 20-day average of roughly 8.9 million. The stock is up 8.74% over the past month and 5.6% year to date, sits above its 50-day moving average of $116.04, and is about 4.3% below its 52-week high of $124, leaving it in the upper band of its recent range.
In March 2026, Reuters reported that Merck was nearing a roughly $6 billion all-cash acquisition of Terns Pharma to bolster its cancer portfolio as it prepares for Keytruda’s eventual patent expiry, underscoring how deal-making is reshaping the company’s oncology strategy.[5] Earlier, in January 2026, Merck told investors it expects $70 billion in revenue from new growth drivers by the mid-2030s, lifting prior segment forecasts for areas such as cardiometabolic and respiratory disease and signaling a push to diversify beyond its flagship immunotherapy franchise.[3]
Those long-horizon ambitions build on a run of late-2025 milestones. In October 2025, Reuters reported that Merck’s Q3 2025 revenue rose to $17.28 billion, topping consensus estimates as Keytruda sales climbed 10% to $8.1 billion even as Gardasil vaccine revenue slipped, and the company narrowed full-year guidance while keeping earnings expectations intact.[2] On Nov 26, 2025, Forbes highlighted that U.S. regulators approved Keytruda in combination with Padcev for muscle-invasive bladder cancer and cleared a subcutaneous Keytruda formulation in Europe, developments that expanded the drug’s addressable market and supported a stronger healthcare/biopharma growth narrative for Merck & Co..[1]
Analyst sentiment has tended to follow that pipeline and earnings story. In late November 2025, Forbes noted a Wells Fargo upgrade to Overweight tied to confidence in Merck’s oncology progress and new formulations, while in December 2025 another Forbes piece cited a BMO Capital upgrade to Outperform and a higher price target after encouraging Phase 3 KEYNOTE-B15 trial results, alongside a 5-day winning streak, a 6.9% five-day gain and a 41% six-month rally in the stock at that time.[1][4] Those moves framed Merck & Co. as a core way to play the healthcare sector’s growth drivers heading into the current midterm election year.
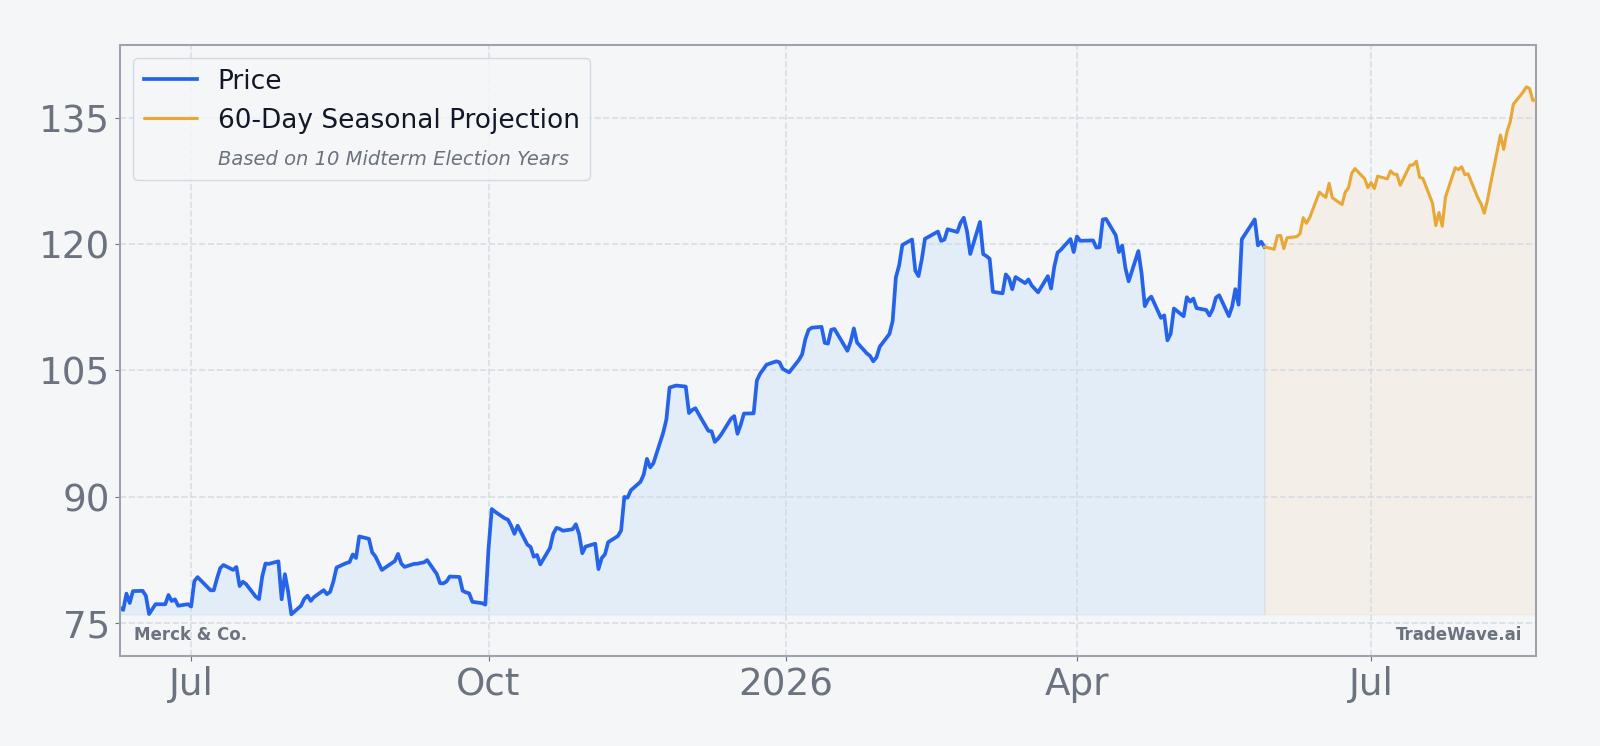
The chart below situates the latest move in its recent multi-month context and overlays a short-term seasonal projection.
What should traders watch as this Merck & Co. seasonal window opens?
First, the calendar. The 218-day window begins on Jun 7 and runs deep into the year before the presidential election, a phase that has historically been friendlier to risk assets and particularly supportive for Merck & Co. in this pattern. Traders watching MRK’s seasonal stock pattern analysis will be looking to see whether the stock can hold above its 50-day moving average and challenge the $124 area as the window opens.
Second, policy and pipeline headlines. Any updates on U.S. drug pricing rules, oncology trial data or the status of the reported Terns Pharma acquisition could either reinforce or disrupt the historical seasonality, especially if they alter expectations for Merck & Co.’s post-Keytruda revenue mix.[3][5] The healthcare sector’s seasonal outlook often hinges on how those policy and clinical catalysts line up with the election calendar.
Third, behavior inside the window. In prior cycles, strong years often featured early rallies that extended over months, while the rare deeper drawdowns, such as 2002, still resolved higher by the end of the period. If MRK were to break sharply below its recent lows and stay there for an extended stretch, that would mark a clear departure from the typical pattern. Conversely, a sustained grind higher with only shallow pullbacks would be more in line with the historical Merck & Co. trading window profile.
Finally, positioning and momentum. Past episodes of intense buying interest, like the 41% six-month rally and short-term winning streak highlighted by Forbes in late 2025, show how quickly sentiment can swing in this name when the narrative lines up with the tape.[4] As this midterm-year window opens, traders will be watching whether volume and trend strength build again or fade, and how that behavior meshes with a seasonal record that, so far, is 10 for 10.
Sources
- Forbes – “Why Is Merck Stock Surging?” (Nov 26, 2025)
- Reuters – “Merck posts higher third-quarter sales as Keytruda growth offsets drop from Gardasil” (Oct 30, 2025)
- Reuters – “Merck says new growth opportunities to drive revenue of $70 billion by mid-2030s” (Jan 12, 2026)
- Forbes – “Is Merck Stock’s Run Legitimate?” (Dec 24, 2025)
- Reuters – “Merck nears $6 billion acquisition of Terns Pharma to boost cancer portfolio, FT reports” (Mar 24, 2026)
About this seasonal analysis
Seasonal pattern data is sourced from TradeWave.ai, which analyzes historical price behavior across annual calendar windows going back up to 30 years. Read the full data methodology or the book The 100-Year Pattern by Afshin Moshrefi (2026 edition). Past performance of seasonal patterns does not guarantee future results. This article is for informational purposes only and does not constitute investment advice.