10 of 10 Midterm Summers Have Ended Lower for Stanley Black & Decker (SWK)
Stanley Black & Decker is heading into a historically weak 35-day midterm-year trading window even as the stock trades modestly below its 52-week high and remains slightly negative for 2026.
What is the seasonal pattern for Stanley Black & Decker (SWK)?
Stanley Black & Decker has fallen in all 10 midterm-year summer windows starting around Jun 10, with an average loss of 5.09% in those years.
- 10 for 10 in this window, with average losses of 5.09% across the last 10 midterm election years.
- Seasonal direction is bearish for shorts: Percent Profitable is 100% with 10 winners and 0 losers for the short side.
- The upcoming 35-day window begins Jun 10 and has historically been a soft stretch for Stanley Black & Decker in midterm years.
- Average winner loss of 5.09% for the stock reflects consistent downside follow-through during this specific SWK seasonal trend.
- The TradeWave Ratio of 2.46 suggests price typically travels meaningfully in the trade direction within the window, while the Sharpe ratio of 1.42 points to strong risk-adjusted results for the pattern.
- Intraperiod swings have been sizable, with several years showing adverse moves near or above 9% before the trade ultimately finished profitable for shorts.
According to historical data from TradeWave.ai, this midterm-year stretch has behaved very differently from an average summer for Stanley Black & Decker, and the next iteration begins this week.
How has Stanley Black & Decker (SWK) traded in this midterm-year summer window?
Stanley Black & Decker has fallen in 10 of 10 midterm election years during the 35 trading days starting around Jun 10, with average losses of 5.09% for the stock. Shares last closed at 78.66, up 0.2% on the day and about 12.0% below the 52-week high of 89.41, while sitting roughly 35.9% above the 52-week low of 57.86.
Grouping the data by the presidential election cycle matters here because midterm years often bring policy uncertainty, shifting infrastructure priorities and rate debates that hit industrials differently than in pre-election or election years. In this case, the pattern phase is the mid part of the midterm election year, which has historically been a choppy stretch for economically sensitive names like Stanley Black & Decker even when the broader cycle is constructive.
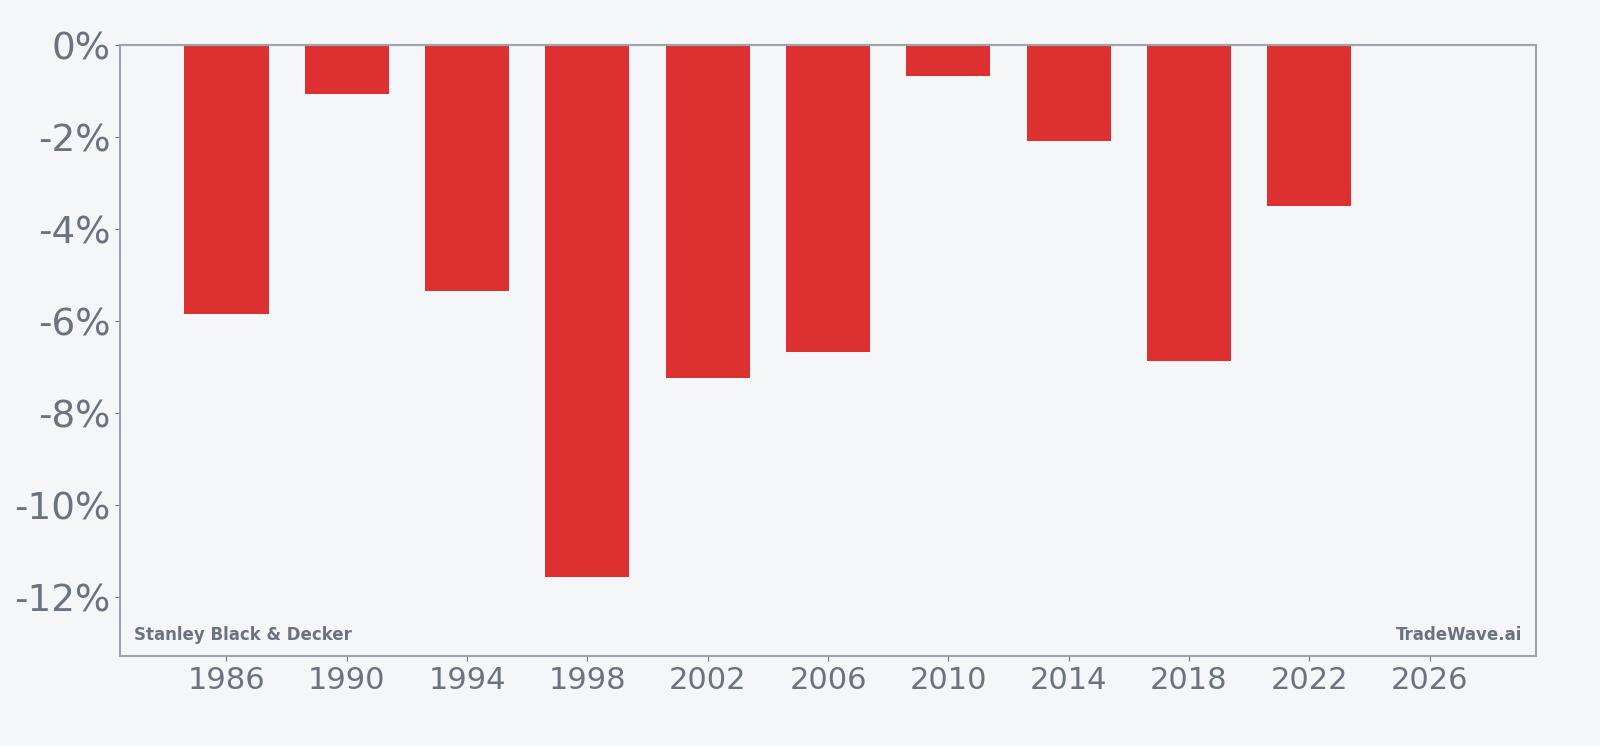
The trade direction for this pattern is short, which means negative returns for the stock have historically been favorable outcomes for the strategy. Across the last 10 midterm election years, every single iteration of this 35-day window produced a net decline for Stanley Black & Decker, with the stock dropping between 0.67% and 11.55% from entry to exit. Average losses of 5.09% across all years line up closely with the 5.6% median, suggesting the typical outcome has been a mid-single-digit slide rather than a pattern dominated by one or two outliers.
Looking at individual years, 1998 stands out as the weakest for the stock in this window, with a net return of -11.55% and a worst intraperiod drawdown of -13.45% from the entry price. On the milder side, 2010 saw only a -0.67% net move lower, but even that year included a worst drawdown of -9.84% before the window closed. The consistency is striking: every midterm sample in the dataset shows the stock finishing the window below its starting level, even when there were brief rallies along the way.
The historical seasonal average trend for this window slopes steadily lower, with much of the damage typically occurring in the middle third of the 35-day span. The early days often show a modest drift, followed by a more decisive leg down, then a tendency to stabilize rather than sharply rebound into the close of the window.
A combined view of yearly net returns and intraperiod swings shows how often downside has dominated even when short-term rallies appeared.
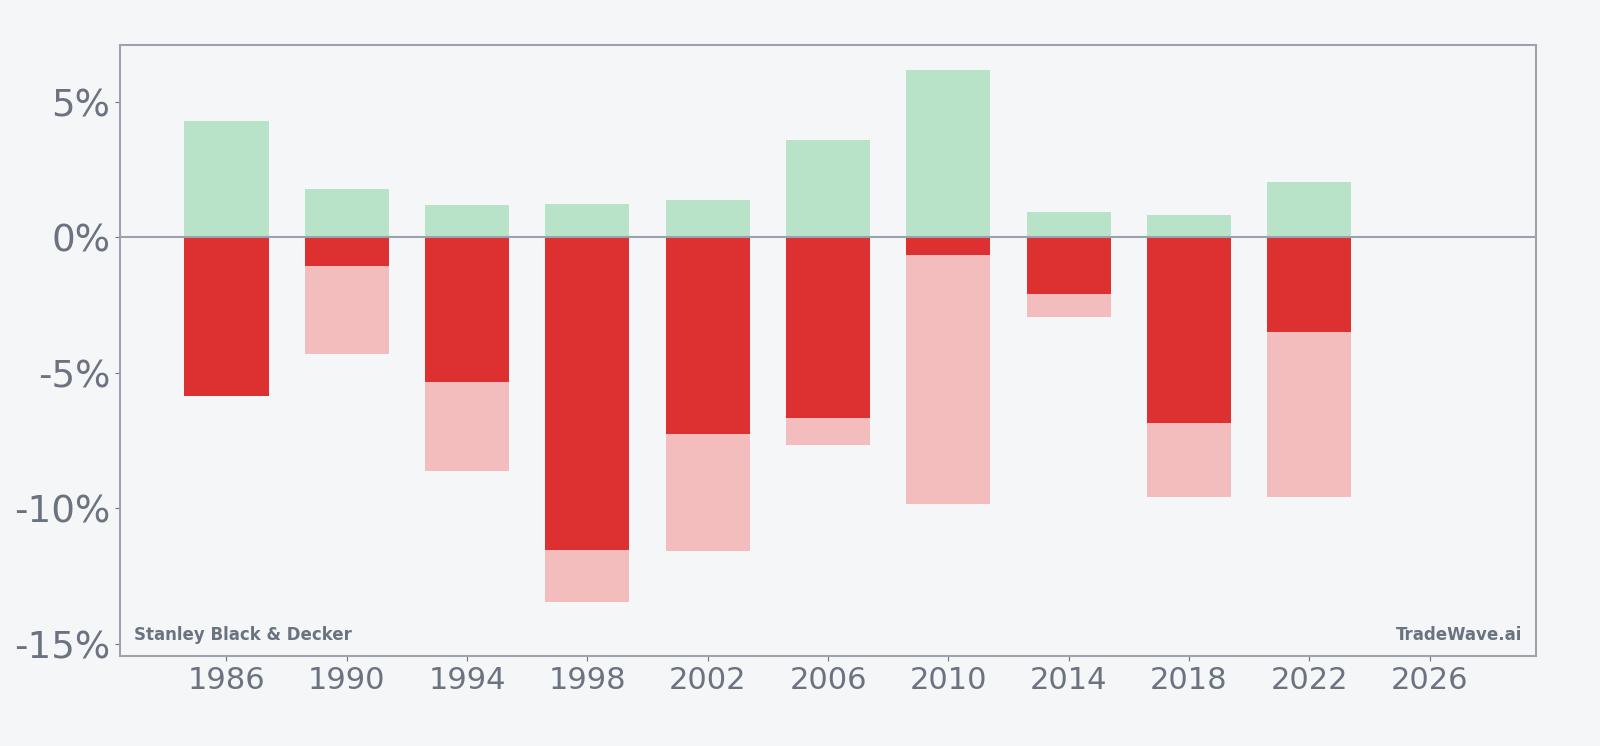
The combined net/MFE/MAE profile shows that even in years when the stock briefly moved higher, those rallies were smaller than the eventual downside, and the worst intraperiod drawdowns often approached or exceeded 9%. Maximum favorable moves for shorts, which correspond to the stock’s worst declines, were sizable, while maximum adverse moves against the short side were generally contained to low- to mid-single digits before the pattern reasserted itself.
History does not guarantee future results, and adverse excursions can still be large within this window even when the pattern ultimately resolves in the historical direction.
Why does Stanley Black & Decker (SWK) follow this seasonal pattern?
One likely driver is the way midterm election years cluster policy and spending uncertainty right as construction and industrial activity move through the summer. Analysts often point to shifting expectations around infrastructure bills, tariffs and interest rates in these years, which can weigh on cyclical industrials like Stanley Black & Decker. This pattern may also reflect institutional portfolio repositioning ahead of the stronger pre-election year, with investors trimming exposure to economically sensitive names during this midterm-year summer stretch.
What is driving Stanley Black & Decker (SWK) today?
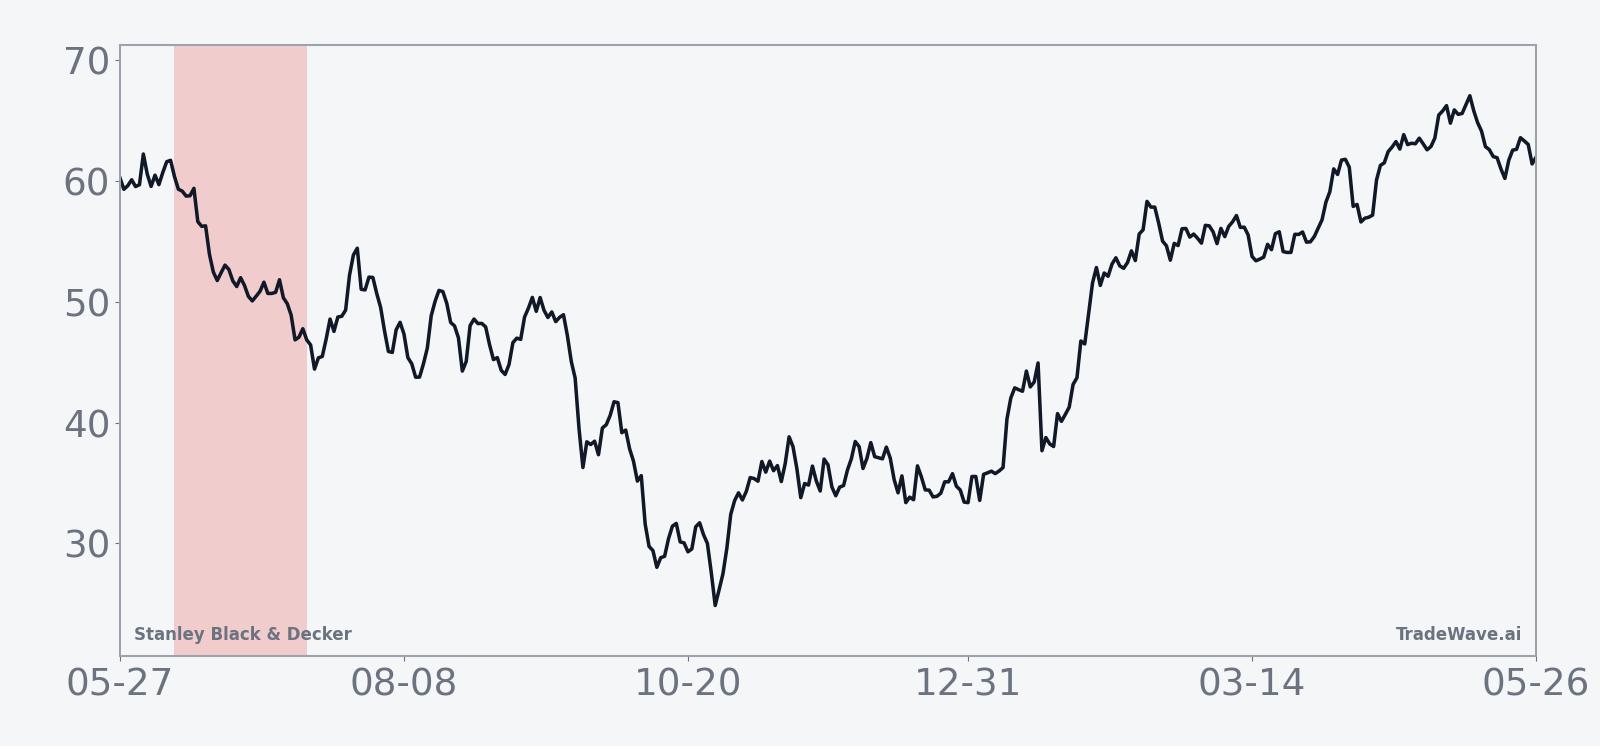
Stanley Black & Decker last changed hands at 78.66, up 0.2% on the session, leaving the stock down about 5% year to date and trading roughly 12.0% below its 52-week high while still well above its 52-week low. Average 20-day volume sits near 1.45 million shares, and the stock is hovering above its 50-day moving average around 73.85, suggesting a modest recovery phase after a difficult stretch earlier in the year.
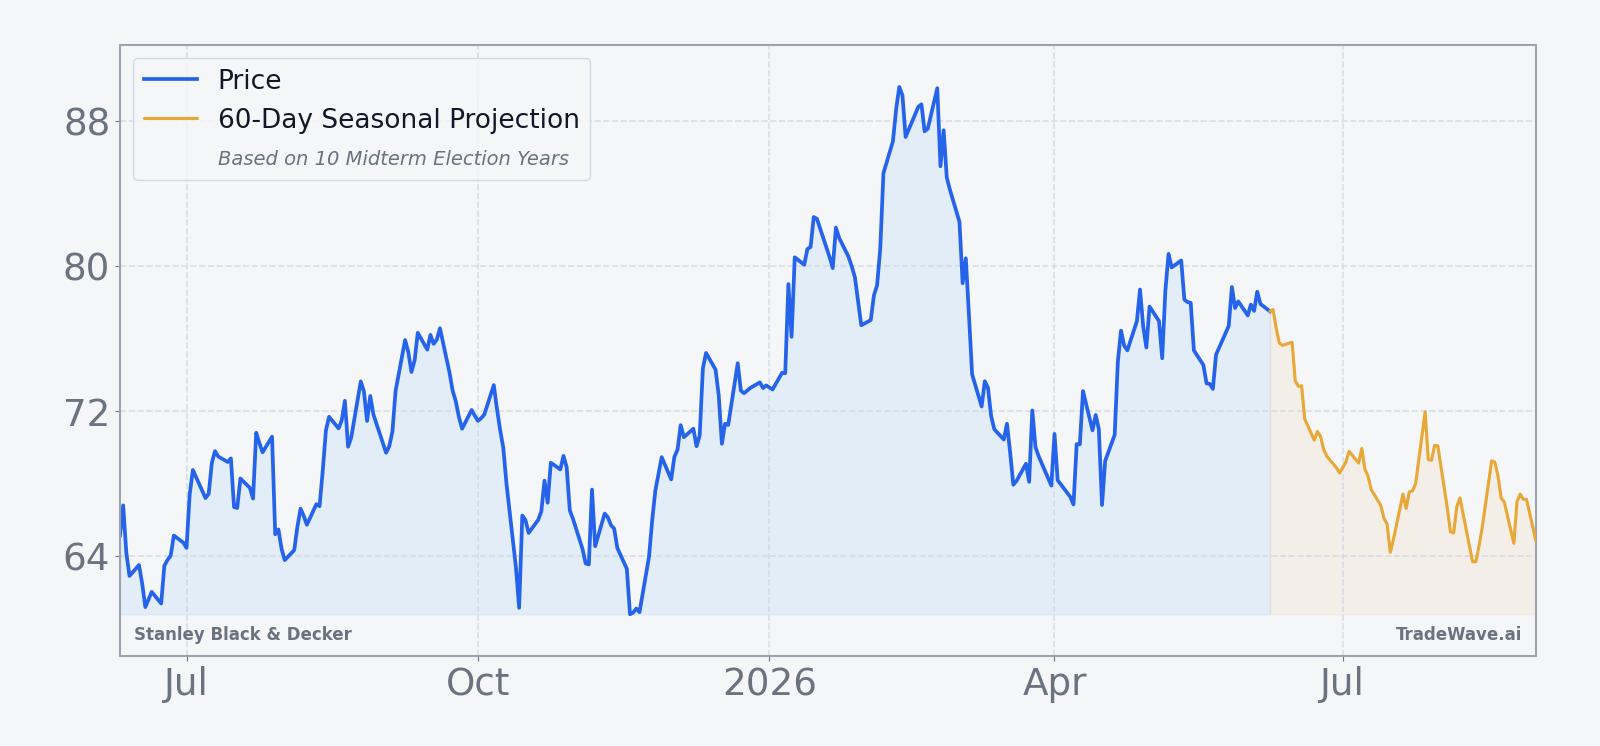
On Apr 20, 2026, CNBC highlighted Stanley Black & Decker among stocks making notable midday moves after the company said recent changes to Section 232 tariffs were not expected to have a material impact on its full-year forecast, helping the shares jump more than 4% in intraday trading.[1] That reassurance on trade policy removed one overhang for the industrial name, even as broader questions about demand, housing activity and capital spending linger into the middle of the year.
The chart below situates the latest move against the past year of trading and a 60-day seasonal projection.
What should traders watch as this seasonal window opens?
The immediate focus is the 35 trading days starting Jun 10, which mark the latest iteration of this historically weak midterm-year summer window for Stanley Black & Decker. Traders will be watching whether the stock can hold above the 50-day moving average near 73.85 or whether price action starts to mirror prior cycles, where weakness tended to build in the middle of the window rather than on day one.
Macro and policy catalysts will matter as well. Any fresh headlines on tariffs, industrial demand or infrastructure spending could either reinforce or blunt the historical pattern, especially given how sensitive the company has been to trade-policy commentary in the past.[1] A firm tape through this window would mark a clear break from the last 10 midterm-year outcomes, while renewed selling pressure that accelerates into late June and early July would fit the established seasonal script.
For investors tracking the broader industrial sector seasonal outlook, the way Stanley Black & Decker behaves in this window can also serve as a tell for risk appetite in cyclical names as the market transitions from the midterm election year toward the typically stronger pre-election year. Add it up: a stock that has dropped in every one of these midterm summer windows is about to test that record again, with policy noise and macro uncertainty still in the mix.
Sources
About this seasonal analysis
Seasonal pattern data is sourced from TradeWave.ai, which analyzes historical price behavior across annual calendar windows going back up to 30 years. Read the full data methodology or the book The 100-Year Pattern by Afshin Moshrefi (2026 edition). Past performance of seasonal patterns does not guarantee future results. This article is for informational purposes only and does not constitute investment advice.