Ford Motor Company (F) Nears 100% Bearish Midterm June Stretch Just as Ford Energy Hype Peaks
Ford Motor Company is heading into a midterm-year June stretch that has reliably produced short-side gains, just as the stock rallies on its Ford Energy pivot.

What is the seasonal pattern for Ford Motor Company (F)?
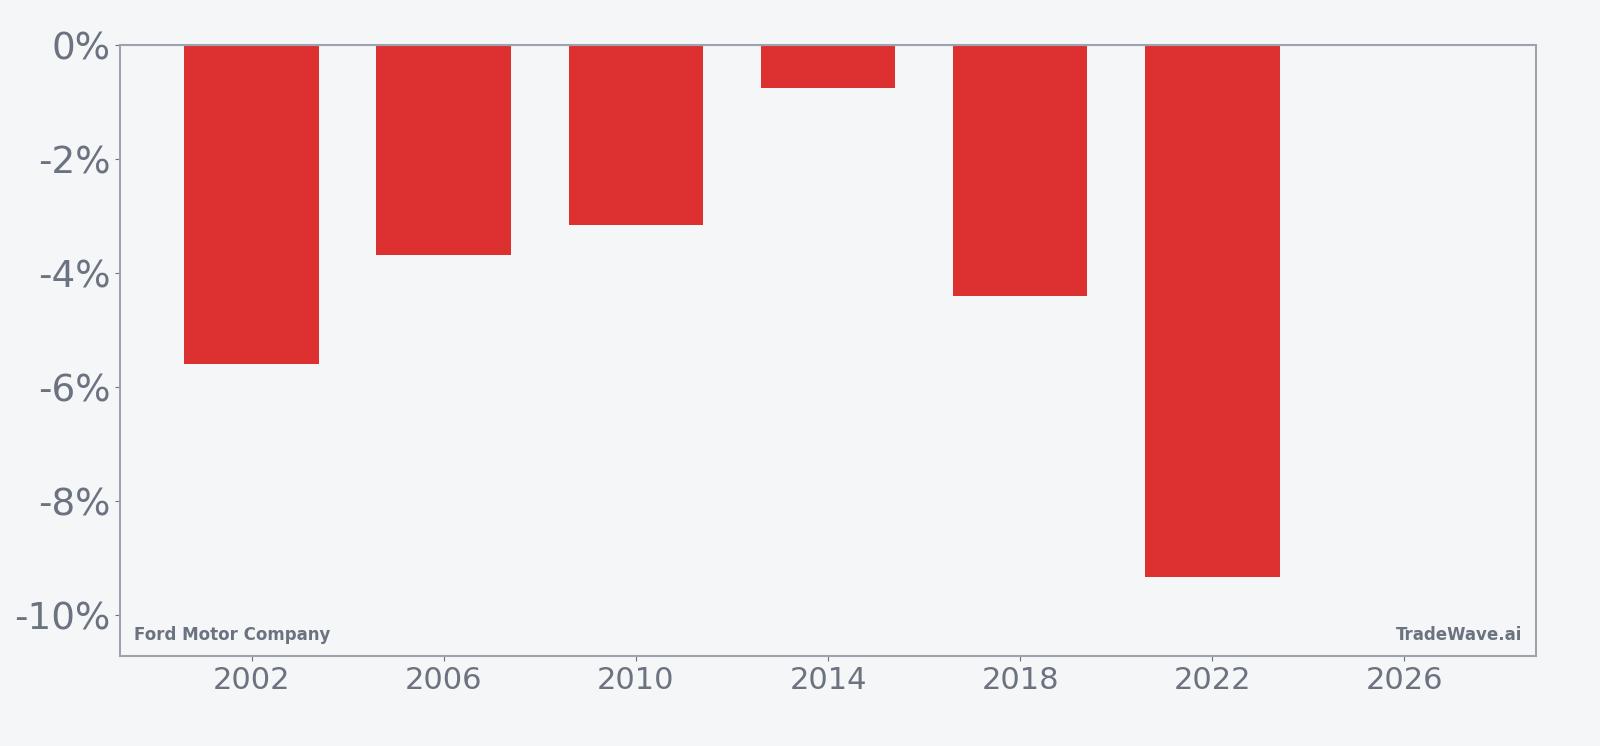
Ford Motor Company has fallen in 6 of 6 midterm-year June windows during this 14-day stretch, with an average gain of 4.49% in winning short trades.
- 6 for 6 in this window, with short trades averaging 4.49% gains across the last six midterm election years.
- The 14-day pattern starts Jun 10 and has been profitable for shorts 100% of the time, with 6 winners and 0 losers.
- Average winner profit of 4.49% compares with a cumulative 29% gain for the short side across all six cycles.
- Historical worst intraperiod drawdowns have reached double digits in some years, even when the short ultimately worked.
- The pattern is specific to midterm election years, highlighting how the presidential cycle can shape Ford’s June trading window.
According to historical data from TradeWave.ai, this upcoming midterm-year June stretch has behaved very differently from an average month for Ford, and the next iteration begins this week.
How has Ford Motor Company (F) traded in this midterm-year June window?
Ford Motor Company has declined in every single midterm-year June window across the last six cycles, with short trades averaging 4.49% gains over the 14-day stretch. Shares closed Monday at $15.08, up 1.2% on the day and about 15.2% below their 52-week high of $17.78, after a sharp run that has lifted the stock roughly 24.8% over the past month. The clash between that momentum and a clean 6-for-6 bearish seasonal record is what makes this year’s setup stand out.
Grouping the data by the presidential election cycle matters here because this is a midterm election year, a phase that often brings policy uncertainty, tariff headlines and choppy trading for industrials. The pattern window from Jun 10 spans 14 trading days in the mid part of that midterm year, and in prior cycles it has lined up with periods when investors reassessed growth, regulation and capital spending across the auto sector.
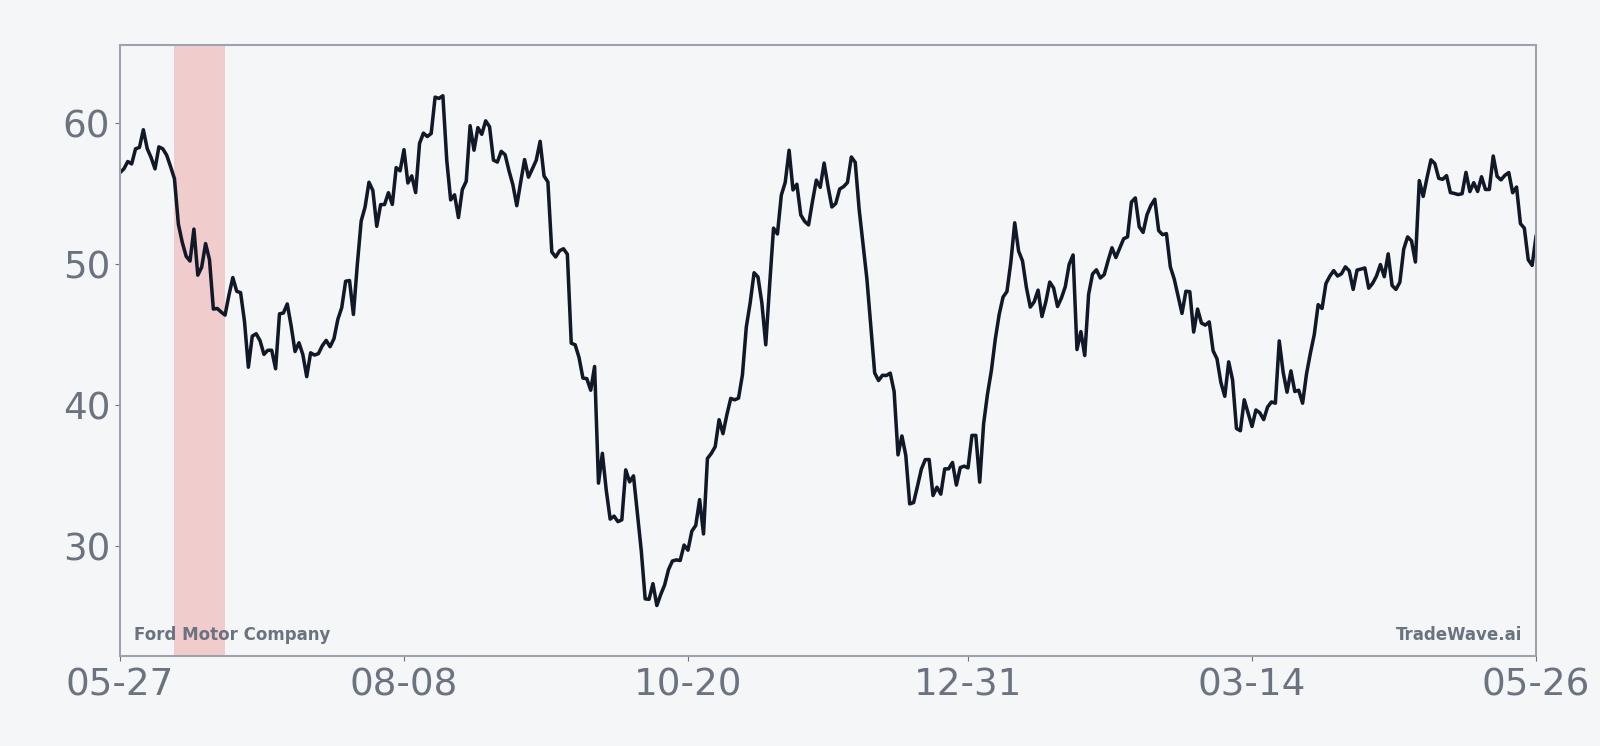
The historical seasonal average shows Ford tending to drift lower fairly steadily across the window rather than collapsing in a single day. For a short setup, that means gains have usually accrued over time, with the pattern’s 4.46% annualized return and 1.52 Sharpe ratio pointing to a consistent, if not explosive, edge for traders who were positioned for weakness.
Year-by-year bars with maximum favorable and adverse moves fill in the risk and reward profile behind that smooth average line.
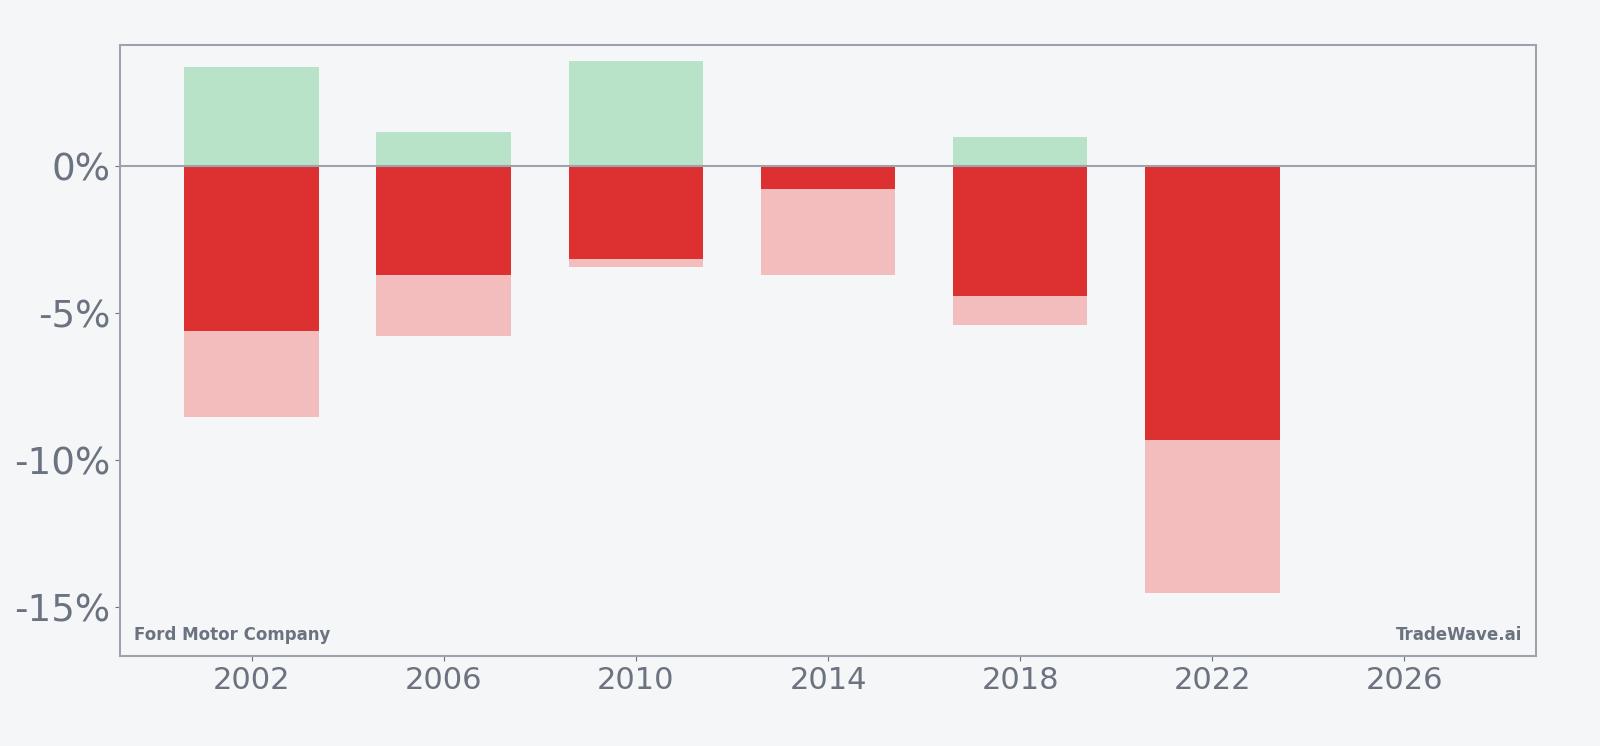
Across the six midterm years in this sample, the strongest short-side outcome came in 2022, when Ford fell 9.33% over the window, with the best intraperiod move for shorts reaching 14.51% and the worst drawdown from entry at 2.59%. At the other end of the spectrum, 2014 delivered only a 0.76% net gain for shorts, but even that “soft” year still saw an adverse move of 3.7% against the position before the trade finished in the green. Add it up and the cumulative return for the pattern is 29% for the short side, with a TradeWave Ratio of 1.62 that signals meaningful travel in the trade direction inside the window.
History does not guarantee future results; adverse excursions can be large even in winning windows, and traders using this pattern still faced multi-percent drawdowns before profits materialized.
Why does Ford Motor Company (F) follow this seasonal pattern?
One likely driver is the way midterm election years concentrate policy and tariff headlines that matter for global automakers, often landing in late spring and early summer. Analysts have also pointed to institutional portfolio rebalancing around midyear, when managers reassess cyclical exposure to industrials and autos in light of growth and rate expectations. For Ford specifically, this pattern may reflect how investors have historically reacted to shifting guidance on trucks, EVs and capital spending as the year’s second half comes into view.
What is driving Ford Motor Company (F) today?
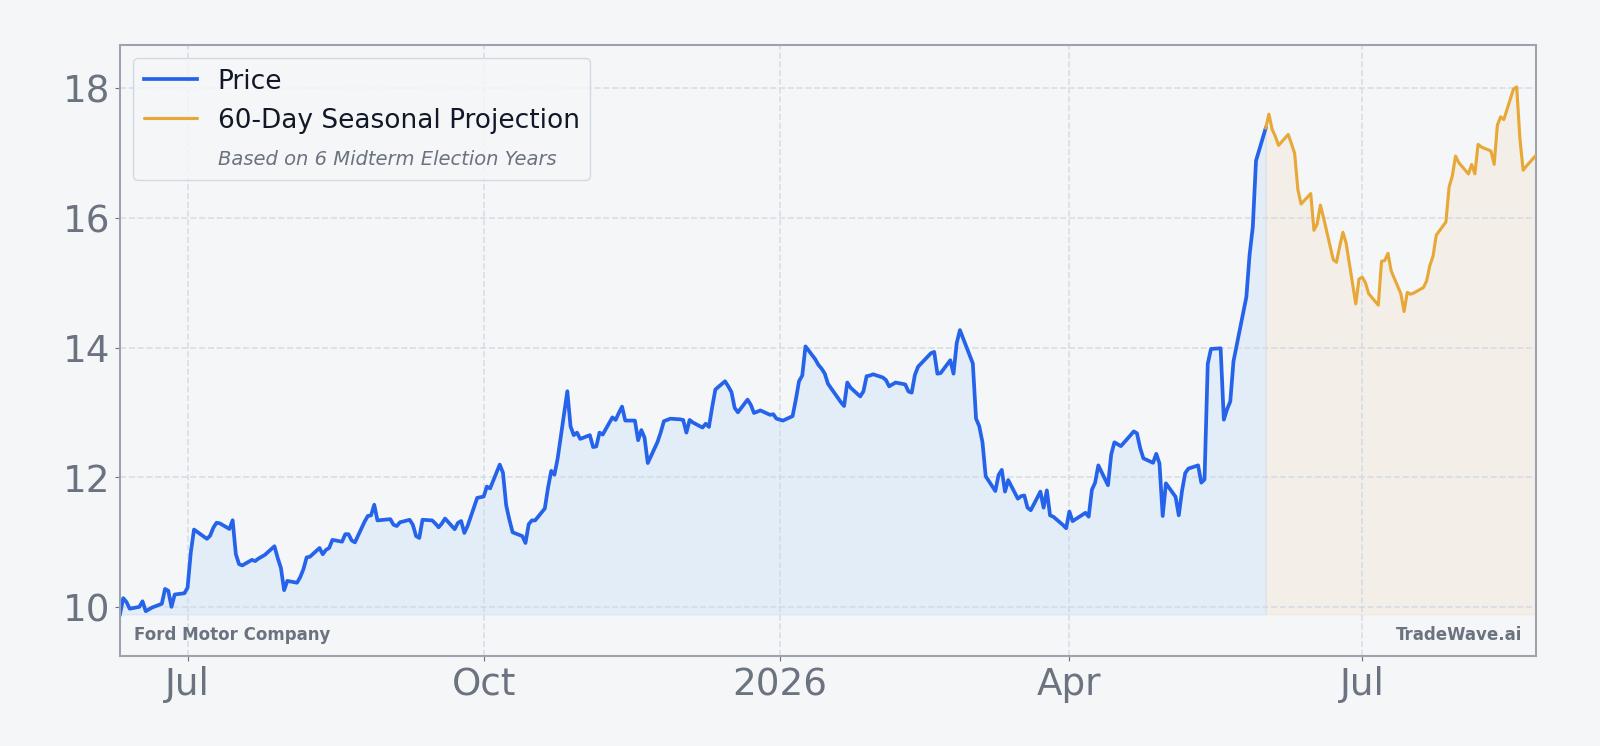
Ford shares finished Monday at $15.08, up 1.2% on the session, extending a roughly 24.8% one-month surge that has pushed the stock well above its 50-day moving average of about $12.94 on heavy trading volume. The latest leg of the rally has been fueled by excitement around Ford Energy, a new business aimed at supplying battery energy-storage systems to data centers, utilities and commercial customers, which some analysts see as an “AI-adjacent” growth lever that could materially lift profitability over time.[4][13]
On May 13, Ford detailed plans for Ford Energy to target at least 20 GWh of annual capacity with deliveries beginning in late 2027, and analysts highlighted a licensing and partnership structure with China’s CATL that could help the company scale quickly.[4][13] Morgan Stanley estimated that at 20 GWh, Ford Energy could generate $500 million to $600 million of run-rate EBIT, a figure that helped spark a single-day gain of more than 6% in the stock and set up a roughly 21% two-day surge as investors rushed to price in the new profit stream.[4][3]
That pivot has also reframed Ford’s sector story. Instead of being seen purely as a legacy automaker wrestling with tariffs, supply-chain issues and EV losses, the company is increasingly discussed in the context of the energy-storage and EV supply chain, with potential to serve hyperscale data centers and grid operators.[3][13] For traders, the key tension is that this bullish narrative and strong tape are about to collide with a midterm-year seasonal window that has historically favored short exposure.
The chart below situates the latest move and the upcoming window against Ford’s past year of trading and a 60-day seasonal projection.
What should traders watch in this Ford Motor Company (F) window?
First, watch how Ford trades as the 14-day window opens on Jun 10. In prior midterm years, weakness has tended to build across the full stretch rather than hit all at once, so a steady grind lower would be more in line with the historical pattern than a single sharp gap.
Second, monitor whether the recent volume and momentum tied to Ford Energy start to cool or stay hot. If the stock continues to attract outsized buying interest and big up days similar to the May surge, that would be a clear break from the typical midterm-year June behavior and could blunt the seasonal edge for shorts.[3][4][13]
Third, keep an eye on macro and policy headlines that intersect with Ford’s tariff and supply-chain exposure, since midterm years often bring fresh noise on trade and regulation. Any renewed concerns about costs, truck production or EV profitability could reinforce the historical pattern of June softness, while a clean macro tape and upbeat commentary from management would argue for treating this window as background rather than a primary driver.
Sources
- CNBC, "Ford Motor is set to report earnings after the bell. Here's what Wall Street expects," Oct 23, 2025.
- CNBC, "Ford Motor is set to report results after the bell. Here's what Wall Street expects," Feb 10, 2026.
- CNBC, "Ford lands its first customer for energy business. Buy this pivot by the auto giant?," May 18, 2026.
- Yahoo Finance, "Ford shares jump 6% as Morgan Stanley hails CATL-backed energy business," May 13, 2026.
- MarketWatch, "Ford’s stock is the S&P 500’s biggest gainer. The carmaker is putting a very Tesla spin on things.," May 13, 2026.
About this seasonal analysis
Seasonal pattern data is sourced from TradeWave.ai, which analyzes historical price behavior across annual calendar windows going back up to 30 years. Read the full data methodology or the book The 100-Year Pattern by Afshin Moshrefi (2026 edition). Past performance of seasonal patterns does not guarantee future results. This article is for informational purposes only and does not constitute investment advice.