6-for-6 Losing Midterm Junes: Ford Motor Company (F) Nears a Historically Weak 14-Day Window
Ford Motor Company is rallying toward its 52-week high just as a midterm-year June window that has produced six straight short-side wins comes into view.

What is the seasonal pattern for Ford Motor Company (F)?
Ford Motor Company has fallen in 6 of 6 midterm-year June windows during this 14-day stretch, with an average gain of 4.49% in winning years for traders positioned short.
- 6 for 6 in this window, with Ford dropping each time and delivering an average 4.49% move in favor of short positions.
- The pattern covers a 14-day trading window starting Jun 10 in the last six midterm election years.
- Percent Profitable is 100%, with 6 winners and 0 losers for the short-side setup in this slice of the calendar.
- Average profit of 4.49% reflects the mean decline across those six midterm-year windows when trading with the short direction.
- Intraperiod swings have been meaningful, with years like 2022 showing deep adverse moves before the window ultimately finished lower.
- The pattern sits in the midterm election year phase, where policy uncertainty and sector rotation often amplify volatility in cyclical names like autos.
According to historical data from TradeWave.ai, this mid-June stretch has behaved very differently from an average month for Ford, with a clear election-cycle flavor that most traders never see on a standard chart.
How has Ford Motor Company (F) traded in this midterm-year June window?
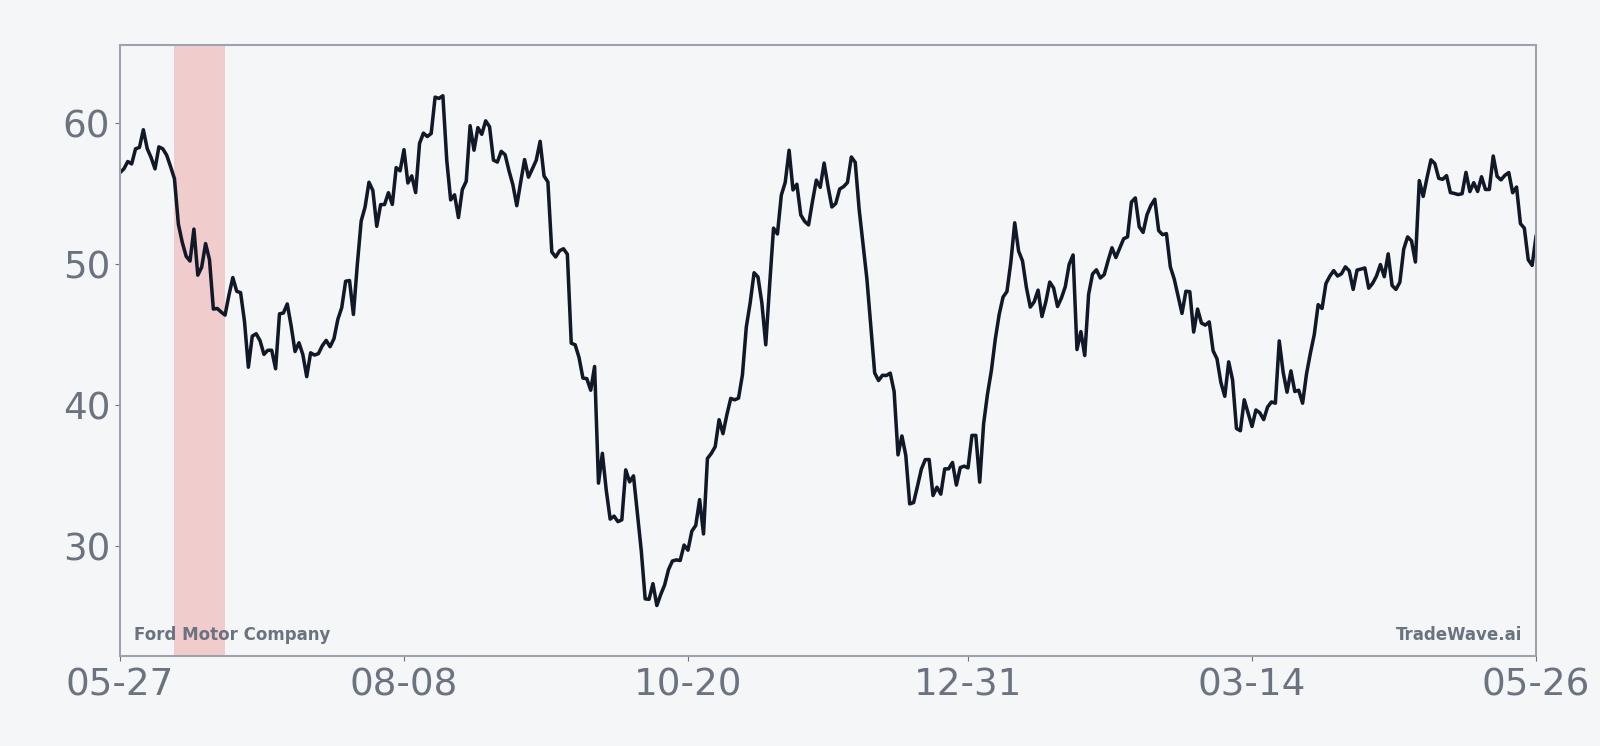
Ford Motor Company has declined in all six midterm election years during the 14 trading days starting Jun 10, a perfect record for traders who were short in this window. Shares finished Thursday at $16.65, up 4.8% on the day and sitting about 0.6% below their 52-week high of $16.75.[4] Some institutional investors have been buying massive amounts of long-dated Ford call options expiring in roughly two and a half years, a bullish positioning shift that could collide with this historically weak mid-June stretch.[9]
Grouping the data by the presidential election cycle matters here because midterm years often feature policy fights, tariff headlines and shifting expectations for regulation, which tend to hit cyclical, capital-intensive sectors like autos harder than the broad market. This Ford Motor Company trading window is drawn from the last six midterm election years, so it reflects how the stock has behaved in that specific macro and policy backdrop rather than in a generic June.
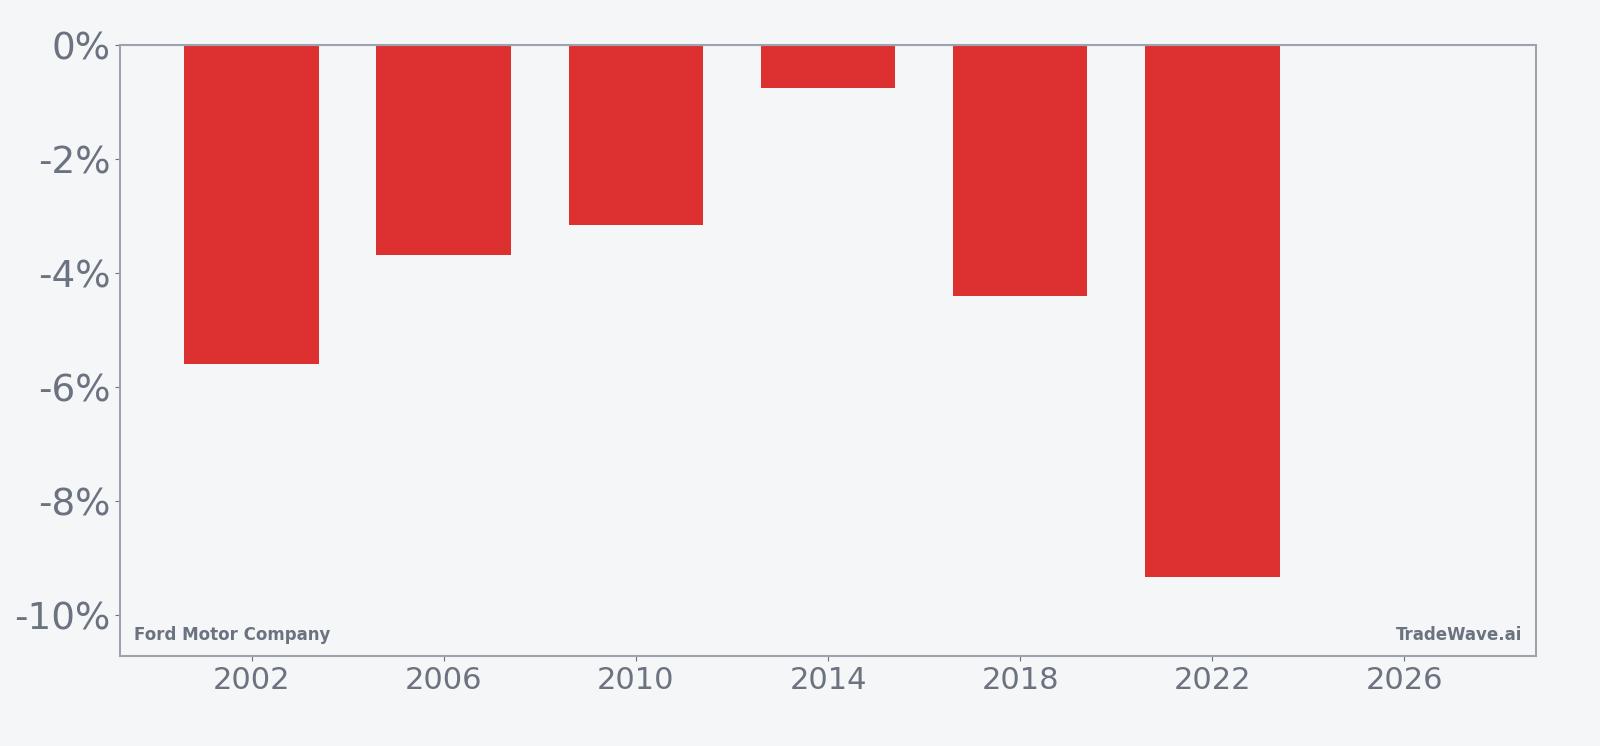
Across those six midterm-year samples, the short-side pattern has a 100% win rate, with Ford falling between 0.76% and 9.33% over the 14-day span in each case. The average profit of 4.49% represents the mean decline in Ford’s share price when trading with the short direction, while the median outcome of 4.05% shows that the typical move has been a mid-single-digit drop rather than a one-off outlier. Because there are no losing years in this sample, the all-years average lines up closely with the average winner, and the cumulative return across the six windows totals 29% in favor of shorts.
The per-year table shows how that has played out in practice. In 2002, Ford dropped 5.6% during the window, with the best intraperiod move against the short position a 3.39% rally and the worst drawdown in favor of the short a 8.52% slide from entry. In 2022, the stock fell 9.33% across the window, with the best move against shorts only 2.59% and the worst move in their favor a 14.51% decline, underscoring how violent the downside can be when the pattern is in gear.
The historical seasonal average trend line slopes steadily lower across the 14 days, with most of the damage typically occurring in the middle of the window rather than in a single gap. That suggests a grind-down pattern more than a one-day shock, which can be harder for momentum traders to spot in real time but friendlier to systematic short strategies that hold through noise.
A second view of yearly net returns and intraperiod swings shows how much room Ford has historically had to move inside this window.
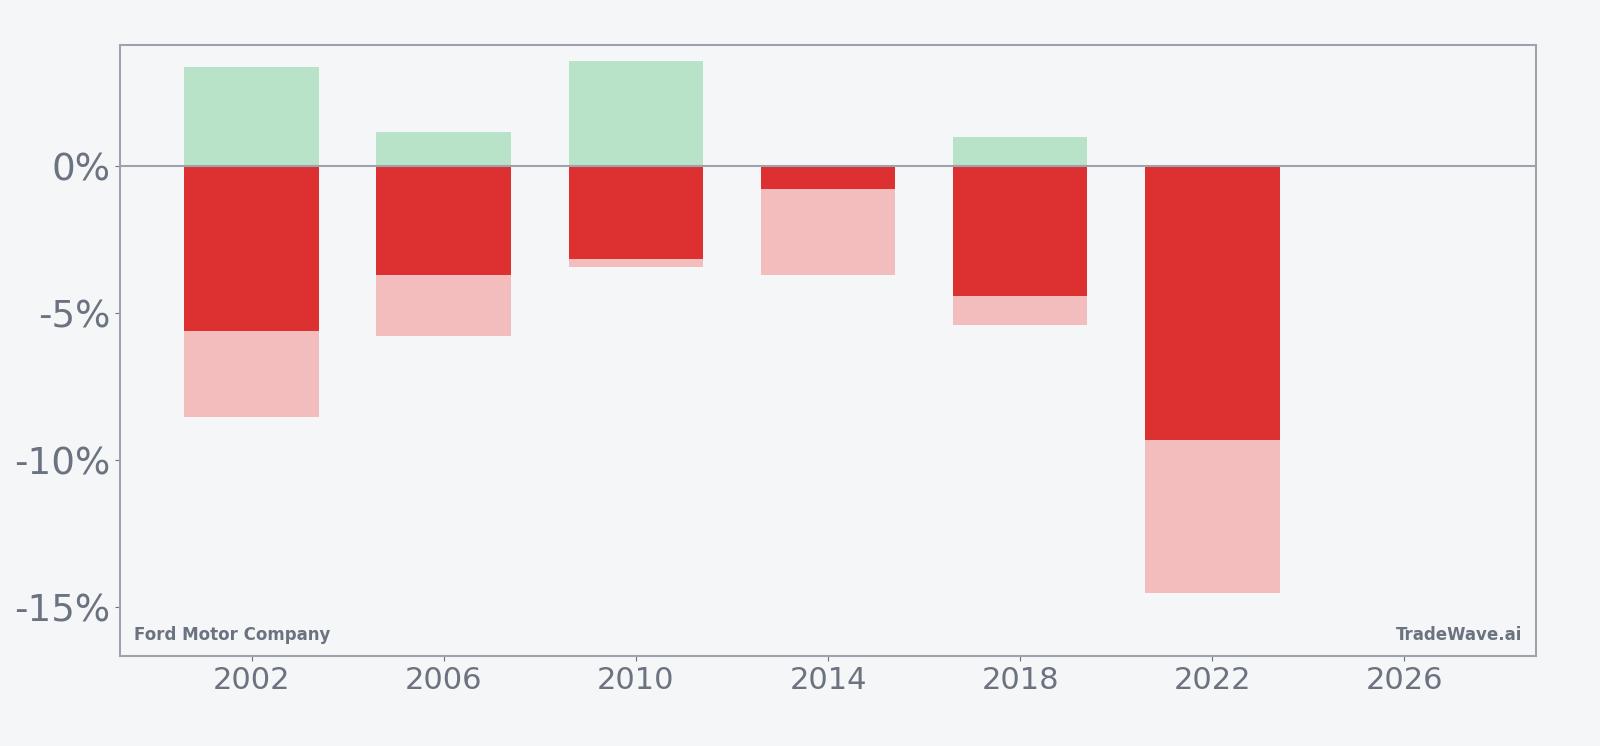
The stacked net, maximum favorable excursion and maximum adverse excursion bars show that even in winning years for the short setup, Ford has often swung several percentage points in both directions before the window closed. Large maximum favorable moves in the trade direction, such as the 14.51% downside extension in 2022, sit alongside meaningful adverse spikes where the stock briefly rallied against shorts before rolling over. That mix of strong TradeWave Ratio and solid Sharpe ratio tells you this has been a directional but volatile window, not a slow drift.
History does not guarantee future results; adverse excursions can be large even in winning windows, and traders can still be wrong in any single year.
Why does Ford Motor Company (F) follow this seasonal pattern?
This midterm-year June pattern may reflect a mix of policy and sector forces that tend to converge in the middle of the cycle. One likely driver is tariff and regulatory uncertainty, which has repeatedly hit automakers’ guidance and capital-spending plans in midterm years as lawmakers revisit trade and industrial policy.[2] Analysts have also pointed to sector rotation away from cyclical industrials when macro data softens or supply-chain headlines flare, leaving stocks like Ford vulnerable to profit-taking just as the summer lull begins.[2]
What is driving Ford Motor Company (F) today?
Ford shares jumped 4.8% on Thursday to $16.65, extending a roughly 39.5% gain over the past month and leaving the stock just under a fresh 52-week high.[4] The move caps a volatile stretch in May, when the stock surged about 21% over two days after Ford announced its first customer for the new Ford Energy business, then gave back part of that spike as traders digested what the pivot could mean for long-term earnings power.[4]
The energy-storage and grid-services push has become a central part of the Ford story. On May 13, Morgan Stanley highlighted Ford Energy and its licensing tie-up with China’s CATL as a potential profit engine, estimating the business could generate $500 million to $600 million of run-rate EBIT at 20 GWh of capacity and flagging the opportunity to supply compliant energy storage systems to utilities and data centers.[5] That note helped ignite the latest leg of the rally, as investors started to treat Ford less like a pure-play legacy automaker and more like a hybrid of autos and energy infrastructure.
Options markets have followed the cash equity enthusiasm. In late May, options data showed institutional investors buying huge volumes of long-term Ford call options expiring in roughly two and a half years, a classic sign that big money is willing to pay up for upside exposure rather than simply owning the stock.[9] Combined with the meme-like price action around the energy headlines, that call demand suggests positioning has tilted aggressively bullish into the summer.
All of this is happening against a backdrop of lingering macro and policy questions for Ford. In 2025, tariff policies and a fire at a Novelis aluminum plant were cited as material headwinds for Ford’s high-profit truck production, and those kinds of supply-chain and trade shocks tend to resurface around midterm political debates.[2] Earlier this year, Ford’s fourth-quarter 2025 earnings preview also highlighted one-time charges and restructuring items, reminding investors that the company is still working through legacy costs even as it leans into EVs and energy storage.[3]
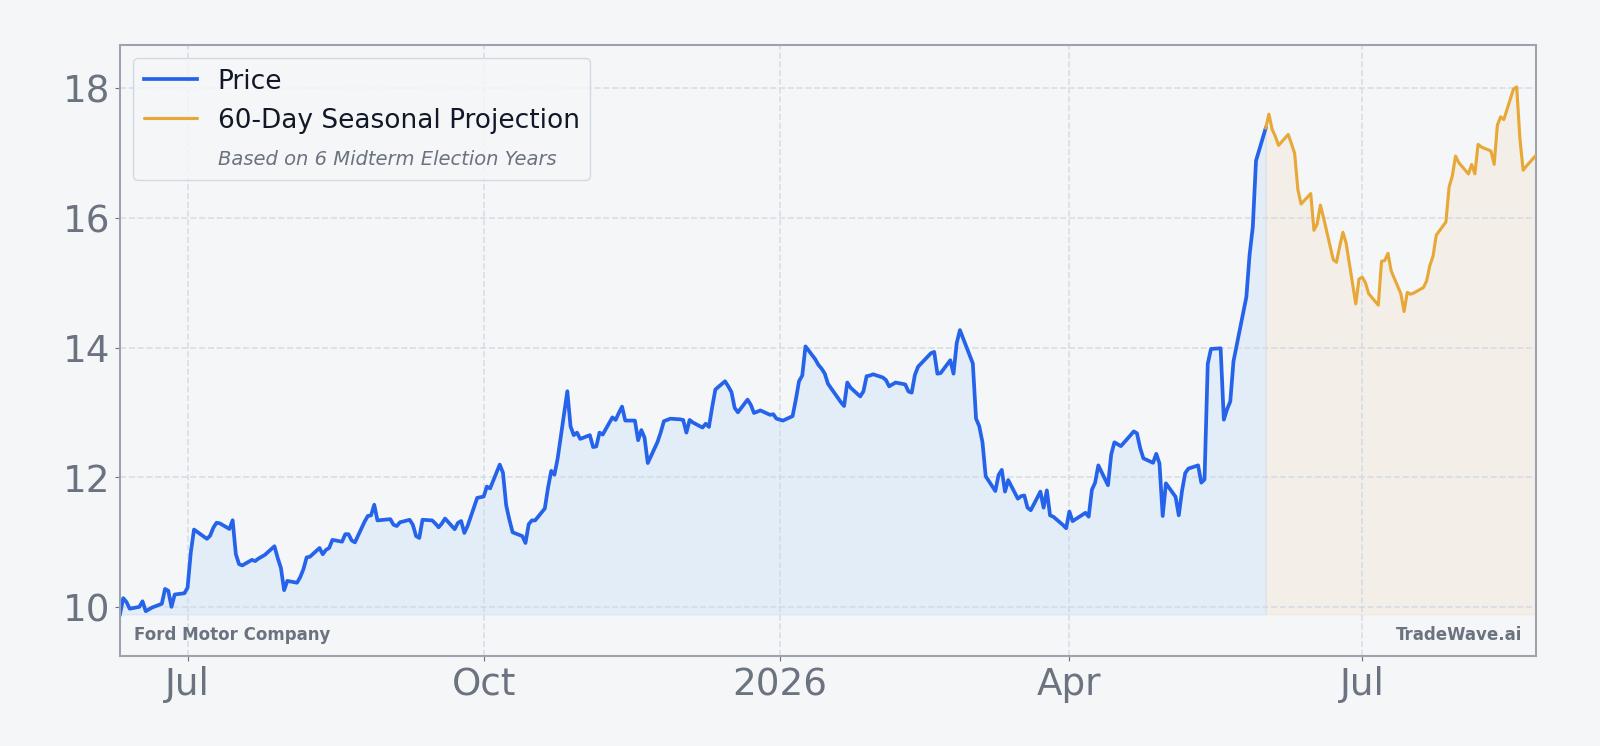
The chart below situates the latest move in its recent multi-month context, including a 60-day seasonal projection overlay.
What should traders watch as this Ford Motor Company (F) window approaches?
The key tension into mid-June is between Ford’s powerful short-term uptrend and a midterm-year seasonal window that has historically favored downside for the stock. If Ford continues to hover near or above the $16.75 area as Jun 10 approaches, traders will be watching whether the first few days of the window bring the kind of grind-lower pattern seen in prior cycles or whether the stock can shrug off the historical script.
On the fundamental side, any new details about Ford Energy contracts, CATL-related supply arrangements or grid-scale storage margins could either reinforce or challenge the bullish narrative that has driven the recent spike.[4][5] Policy headlines around tariffs, industrial subsidies and domestic manufacturing requirements will also matter, since those have been recurring midterm-year swing factors for Ford’s guidance and investor sentiment.[1][2]
Options flow is another important tell. If the wave of long-dated call buying continues or accelerates into and through the window, it would signal that institutional investors are willing to lean against the historical pattern and treat any pullbacks as opportunities to add upside exposure.[9] If, instead, call demand cools and short-dated hedging picks up, that would look more like traders respecting the seasonal track record and bracing for a choppier June.
Add it up: Ford is entering mid-June with a full tank of bullish sentiment, a stock price near its highs and a midterm-year seasonal record that has never rewarded longs in this specific 14-day stretch. Whether the stock respects or breaks that pattern will say a lot about how much of the energy pivot and options-driven enthusiasm is already in the price.
Sources
- GuruFocus: Ford (F) Faces Pressure for Domestic Manufacturing Shift (Jun 2, 2025)
- CNBC: Ford Motor is set to report earnings after the bell. Here's what Wall Street expects (Q3 2025) (Oct 23, 2025)
- CNBC: Ford Motor is set to report results after the bell. Here's what Wall Street expects (Q4 2025) (Feb 10, 2026)
- CNBC: Ford lands its first customer for energy business. Buy this pivot by the auto giant? (May 18, 2026)
- Yahoo Finance / Investing.com: Ford shares jump 6% as Morgan Stanley hails CATL-backed energy business (May 13, 2026)
- Barchart / Yahoo Finance: Institutional Investors Love Ford Stock - Buying Huge, Unusual Volume of Long-Term Call Options (May 27, 2026)
About this seasonal analysis
Seasonal pattern data is sourced from TradeWave.ai, which analyzes historical price behavior across annual calendar windows going back up to 30 years. Read the full data methodology or the book The 100-Year Pattern by Afshin Moshrefi (2026 edition). Past performance of seasonal patterns does not guarantee future results. This article is for informational purposes only and does not constitute investment advice.