Ford Motor Company (F) Faces Tariff Headwinds as a Weak Midterm June Stretch Approaches
Ford Motor Company is heading into a 14-day midterm-year June stretch that has been consistently weak in past cycles, just weeks after a sharp Ford Energy-fueled rally reset expectations for the stock.

What is the seasonal pattern for Ford Motor Company (F)?
Ford Motor Company has fallen in 6 of 6 midterm-year June windows during this 14-day stretch, with an average gain of 4.49% in winning years for traders positioned short.
- 6 for 6 in this window, with Ford shares declining every midterm-year June stretch in the sample while short trades averaged 4.49% gains.
- The upcoming 14-day window begins on Jun 10, 2026 and has historically been a bearish seasonal pattern for Ford Motor Company.
- Percent Profitable is 100%, with 6 winners and 0 losers for the short trade direction across the last six midterm election years.
- Average profit in winning years is 4.49%, reflecting a 29% cumulative return for the short setup over the full lookback period.
- The TradeWave Ratio of 1.62 indicates that price has typically moved meaningfully in the trade direction within the window, even beyond the final close.
- Intraperiod swings have been sizable, with historical best and worst excursions showing that short trades often faced notable drawdowns before finishing profitable.
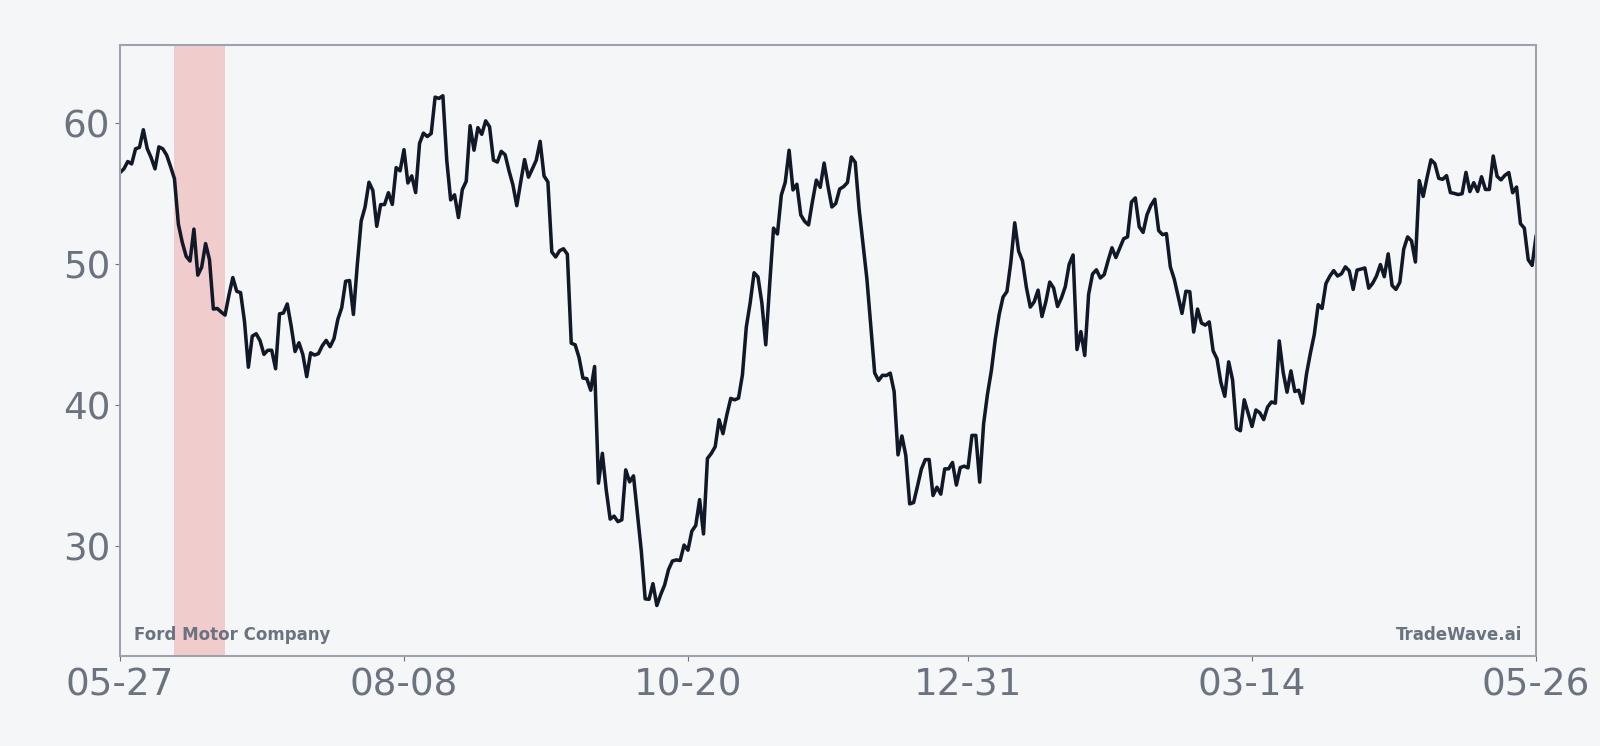
According to historical data from TradeWave.ai, this mid-June window for Ford Motor Company behaves very differently from an average month on the calendar. The next section walks through how that pattern has played out across the last six midterm election years.
How has Ford Motor Company (F) traded in this midterm-year June window?
Ford Motor Company has declined in every single midterm-year June window across the last six cycles, with short trades averaging 4.49% gains over the 14-day stretch. Shares finished Monday at $16.705, down 4.2% on the day and about 6.1% below their 52-week high of $17.78.[3] That combination of a strong historical seasonal bias and a stock that has just pulled back from fresh highs gives this year’s window more weight than usual.
Grouping the data by the presidential election cycle matters here because this pattern only shows up in midterm election years, when policy uncertainty and tariff debates tend to be front and center for industrial names. In those years, this specific June slice has repeatedly lined up with bouts of pressure on Ford’s share price, even when the broader auto sector was mixed.
Across the six midterm-year samples, the short trade direction has been unambiguously favored. Percent Profitable sits at 100%, with all six windows ending lower for Ford and no losing years for the short setup. Average profit for those winning shorts is 4.49%, with a 29% cumulative return across the full lookback, while the median outcome is a 4.05% gain, suggesting the pattern is not just driven by one outlier year.
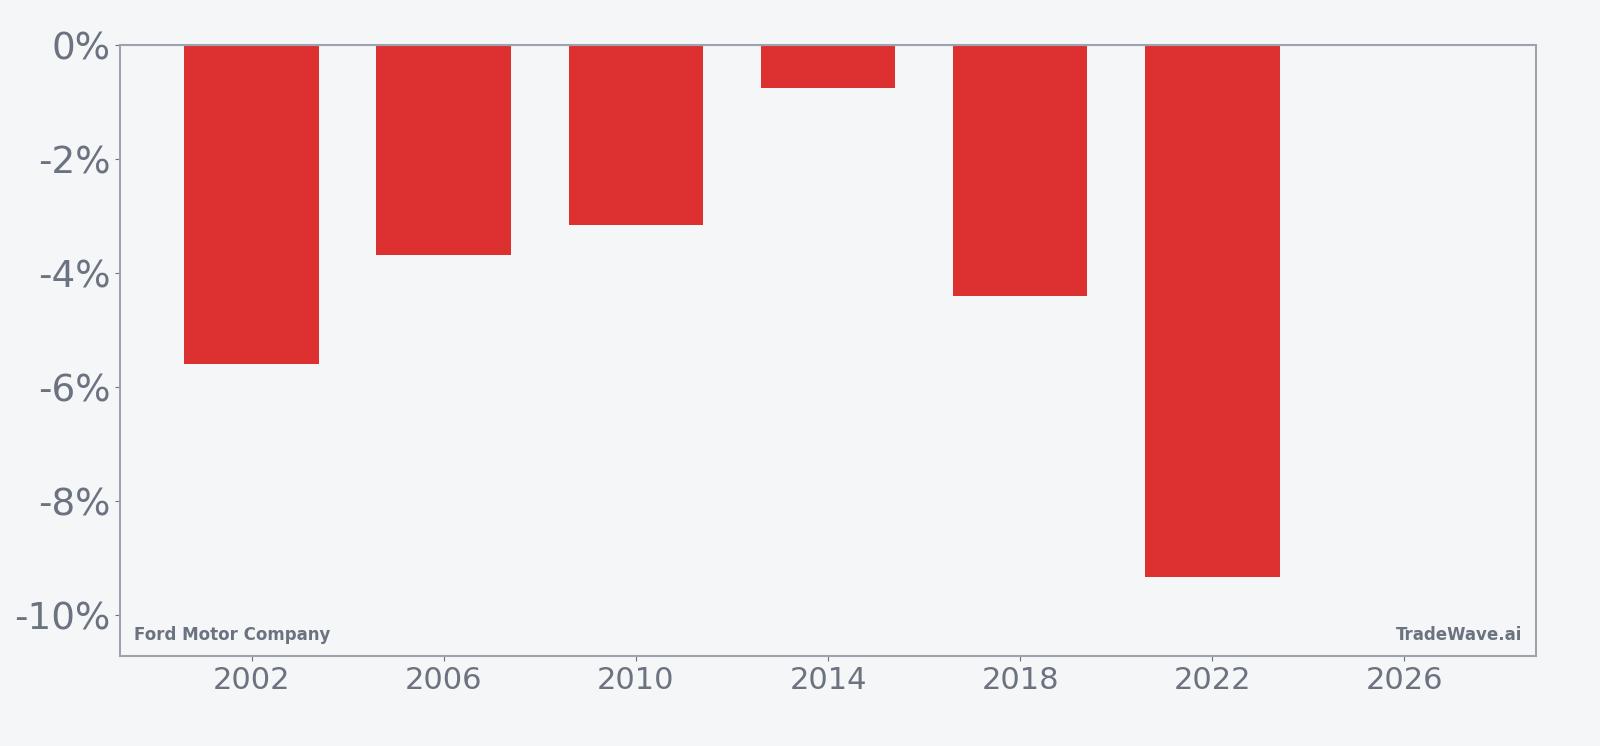
The per-year breakdown shows that the weakest year for Ford in this window was 2022, when a short trade would have captured a 9.33% decline over the 14 days, while the mildest drop came in 2014 at 0.76%. In 2002 and 2018, the stock fell 5.6% and 4.41% respectively, again rewarding traders who were positioned for downside. Even the smaller moves, such as the 3.16% slide in 2010 and 3.69% in 2006, kept the win streak intact for the short pattern.
The historical seasonal average trend line slopes lower through most of the 14-day span, with the bulk of the move typically accruing in the middle of the window rather than in a single gap. That profile suggests a grind lower rather than a one-day shock, which is consistent with the pattern’s relatively modest standard deviation of 2.86% compared with its average profit.
Year-by-year bars that include both peak run-ups and worst drawdowns show how much room Ford has historically given traders inside the window.
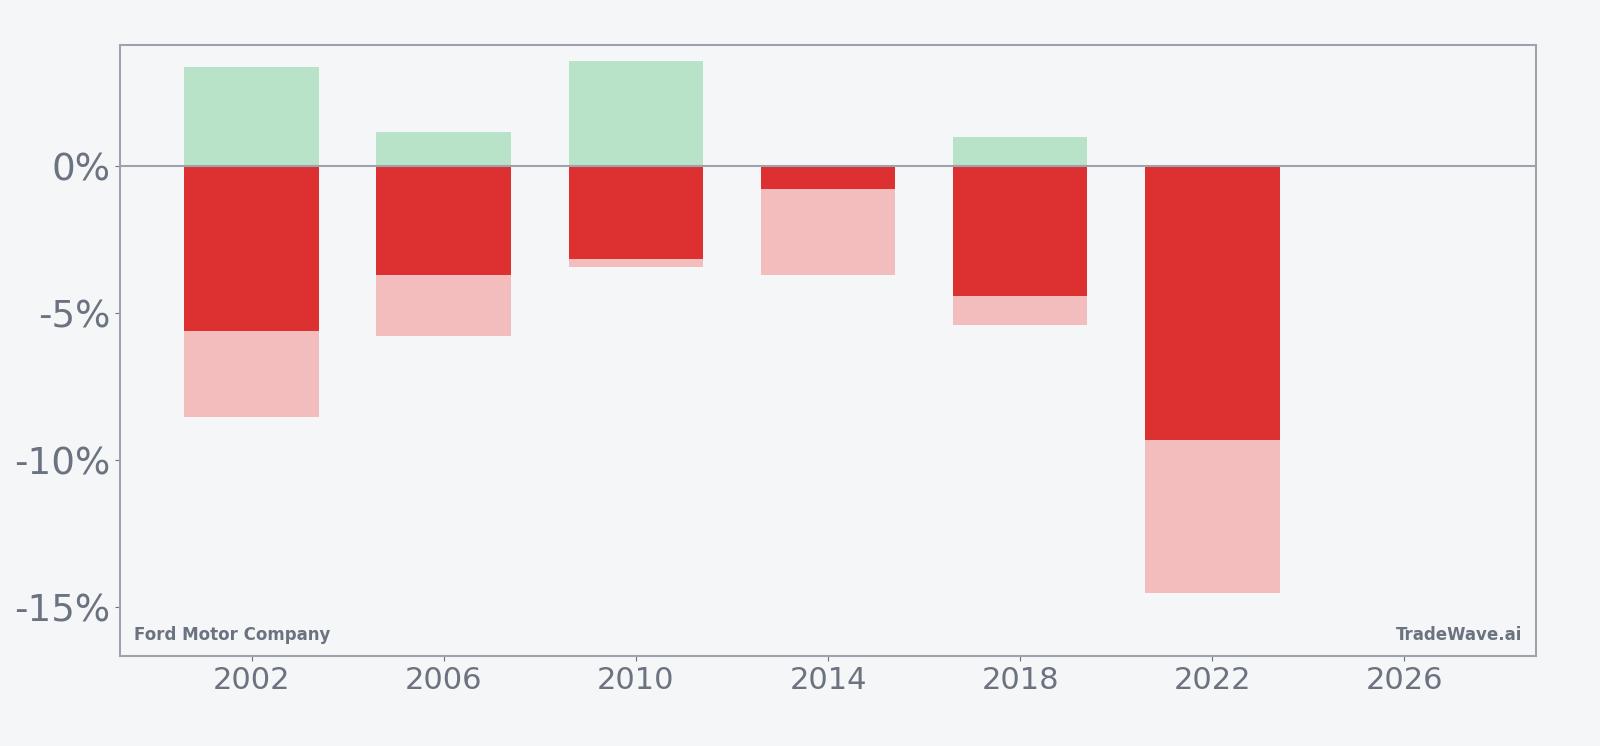
Intraperiod behavior has not been one-way traffic. In 2002, for example, Ford’s best point-to-peak move during the window was a 3.39% rally against the short before the stock ultimately finished 5.6% lower, while the worst drawdown in favor of the short reached 8.52%. In 2022, the maximum favorable move for shorts was 14.51% at one point, but there was also a 2.59% intraperiod bounce that would have tested conviction. That mix of sizable maximum favorable and adverse excursions fits with a TradeWave Ratio of 1.62, signaling that price tends to travel meaningfully during this window even when the final net move is smaller.
Put together, the record is striking: six for six winning short windows, a consistent downward seasonal trend, and enough intraperiod volatility to matter for risk management. History does not guarantee a repeat, but this is one of the cleaner midterm-year patterns on Ford’s seasonal calendar.
Why does Ford Motor Company (F) follow this seasonal pattern?
One likely driver is the way midterm election years concentrate policy and tariff headlines into the middle of the year, which can weigh on cyclical industrials like Ford. Analysts have also pointed to institutional portfolio repositioning around midyear, as funds rebalance exposure to autos and value stocks against growth and technology themes. This June window may reflect that combination of policy uncertainty and sector rotation, which has repeatedly translated into short-term pressure on Ford’s share price in past midterm cycles.
History does not guarantee future results, and even in a window with a perfect track record, adverse excursions within the period can be large enough to challenge any trade.
What is driving Ford Motor Company (F) today?
Ford shares closed at $16.705 on Monday, down 4.2% on the session after a volatile stretch that still leaves the stock up 43.53% over the past month and about 86.0% above its 52-week low of roughly $8.97.[3] The surge has been fueled by excitement around Ford Energy, a new battery energy-storage push aimed at data centers, utilities and commercial customers, which several outlets have described as giving Ford a more “AI-adjacent” profile and helping the stock become one of the S&P 500’s standout gainers in mid-May.[3][4][13][7]
On May 13, Ford formally launched Ford Energy, outlining plans to deploy at least 20 GWh of battery energy-storage systems a year starting in late 2027 and highlighting access to CATL’s LFP technology as a way to meet Foreign Entity of Concern compliance for lucrative U.S. energy tax credits.[13][4] Analysts have argued that this structure could allow customers to qualify for a 30% Investment Tax Credit on storage projects, a potential margin tailwind that has helped reframe Ford as more than a traditional automaker.[4][13] In mid-May, CNBC reported that the stock logged a roughly 21% two-day surge as investors digested the first Ford Energy customer win and speculated about how large the business could become over time.[3]
That enthusiasm is arriving against a more complicated macro backdrop. In Oct 2025, Ford flagged tariff policy as a headwind and increased its expected tariff impact, putting it in the same bucket as other global automakers wrestling with trade-related costs.[1] Earlier earnings coverage also highlighted expectations for restructuring charges and supply constraints, which could still shape how investors value the legacy auto operations even as the energy-storage story builds out.[1][2] For now, the market’s focus has shifted toward Ford’s ability to convert Ford Energy headlines into signed contracts and recurring cash flow, a pivot that has already moved the stock sharply in a short span.[3][4][13][7]
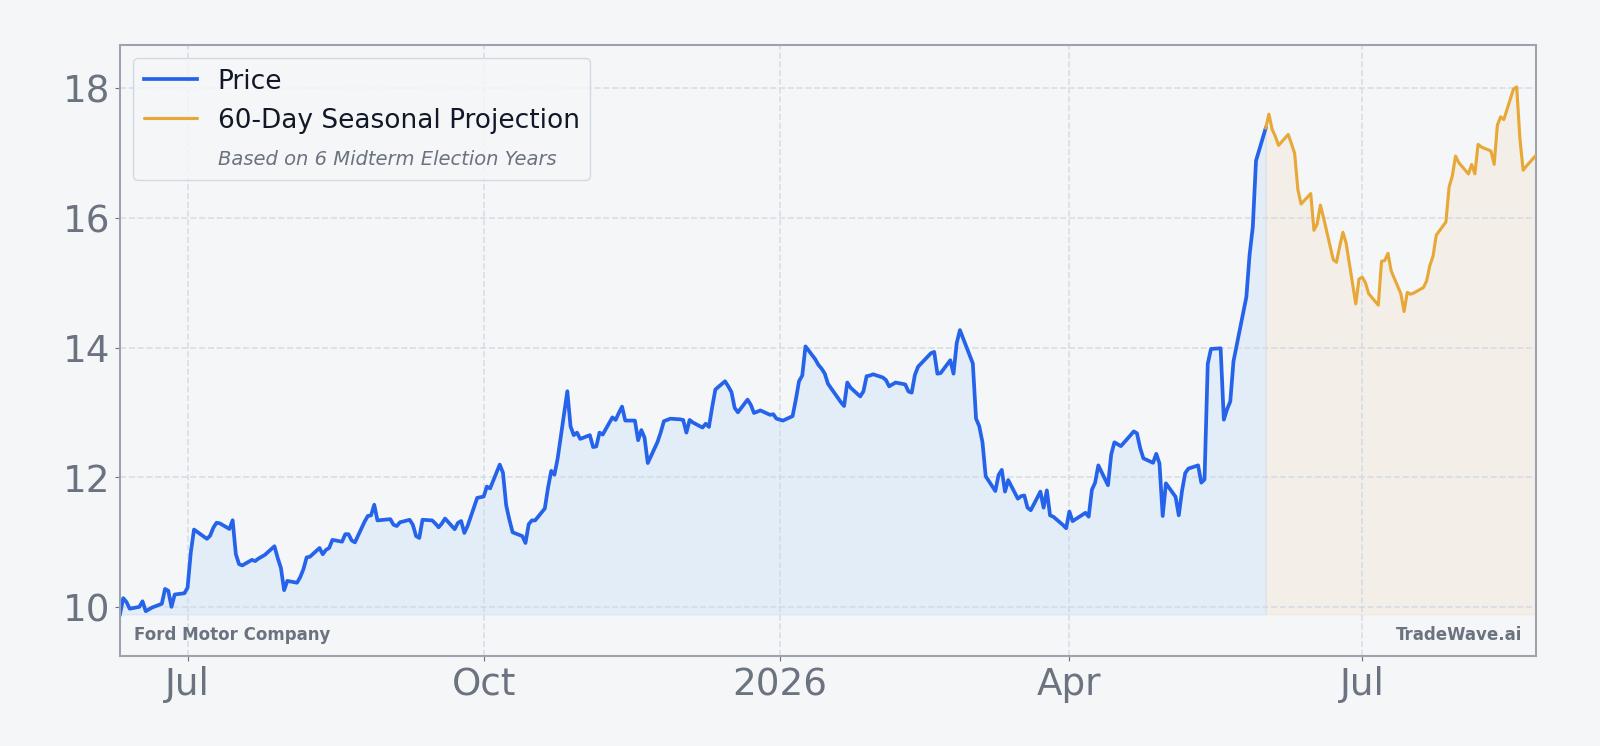
The chart below shows how that Ford Energy-driven breakout fits into Ford’s recent trading range, alongside a 60-day seasonal projection.
What should traders watch as this Ford seasonal window approaches?
The first marker is timing. The 14-day midterm-year June window begins on Jun 10 and runs through late June, overlapping a period when Ford will still be digesting the Ford Energy news flow rather than a major earnings report. How the stock behaves into and through that stretch will show whether the historical pattern of short-term weakness can reassert itself after a powerful one-month rally.
Second, levels matter. With the stock recently tagging a 52-week high at $17.78 and then backing off, traders will be watching whether Ford can reclaim and hold that zone into the window or whether rallies stall below it.[3] A failure to make new highs as the seasonal window opens would rhyme with prior midterm years, when the stock often rolled over from strength. A clean breakout and sustained move above the recent peak would be a clear departure from the historical script.
Third, macro and policy headlines around tariffs and industrial policy could again intersect with this window, as they did in earlier midterm cycles.[1] Any fresh signals on trade costs, EV incentives or energy-storage tax treatment could either reinforce or blunt the usual pattern, especially given how central those themes are to Ford’s strategy.
Finally, traders will be monitoring whether the intense Ford Energy interest that drove the May surge cools or accelerates.[3][4][13][7] If volume and news flow fade while the stock starts to drift lower inside the window, that would line up neatly with the historical seasonal trend. If, instead, new contracts or analyst upgrades keep the Ford Energy story front and center and the stock shrugs off the window’s typical weakness, it would signal that this midterm-year pattern is facing one of its toughest tests yet.
Sources
- [1] CNBC, "Ford Motor is set to report earnings after the bell. Here's what Wall Street expects" (Oct 23, 2025).
- [2] CNBC, "Ford Motor is set to report results after the bell. Here's what Wall Street expects" (Feb 10, 2026).
- [3] CNBC, "Ford lands its first customer for energy business. Buy this pivot by the auto giant?" (May 18, 2026).
- [4] Yahoo Finance, "Ford shares jump 6% as Morgan Stanley hails CATL-backed energy business" (May 13, 2026).
- [7] The Wall Street Journal, "Ford’s Stock Is Surging—and It’s Got Nothing to Do With Its Car Business" (May 27, 2026).
- [13] MarketWatch, "Ford’s stock is the S&P 500’s biggest gainer. The carmaker is putting a very Tesla spin on things." (May 13, 2026).
About this seasonal analysis
Seasonal pattern data is sourced from TradeWave.ai, which analyzes historical price behavior across annual calendar windows going back up to 30 years. Read the full data methodology or the book The 100-Year Pattern by Afshin Moshrefi (2026 edition). Past performance of seasonal patterns does not guarantee future results. This article is for informational purposes only and does not constitute investment advice.