Illinois Tool Works (ITW) Faces 90% Downside Hit Rate in TradeWave’s 44-Day Midterm Window
Illinois Tool Works is trading well below its 52-week high just as a historically weak 44-day midterm-year seasonal window opens, putting a spotlight on how industrials handle policy and earnings crosscurrents into late summer.
What is the seasonal pattern for Illinois Tool Works (ITW)?
Illinois Tool Works has fallen in 9 of 10 midterm-year summer windows starting around Jun 10, with an average loss of 6.58% in winning years for the short setup.
- 9 for 10 in this window, with the short side averaging 6.58% gains in winning years and a 6% average move across all years.
- The 44-day Illinois Tool Works trading window begins on Jun 10 in midterm election years and has historically favored downside for shorts.
- Percent Profitable is 90%, with 9 winners and 1 loser for the short pattern across the last 10 midterm election years.
- Avg Profit reflects winners only at 6.58%, while Avg Profit - All, which includes the lone losing year, comes in at 6%.
- Maximum favorable moves have reached into the mid-teens in some years, while maximum adverse excursions have also pushed into double digits, signaling a volatile stretch.
- The TradeWave Ratio of 2.36 and a Sharpe ratio of 1.09 point to a historically efficient short window, but intraperiod swings have been large in both directions.
According to historical data from TradeWave.ai, this midterm-year stretch has behaved very differently from an average summer for Illinois Tool Works, and the next 44 days sit inside one of its most consistent election-cycle patterns.
How has Illinois Tool Works (ITW) traded in this midterm-year summer window?
Illinois Tool Works has delivered profitable short trades in 9 of the last 10 midterm election years during the 44 trading days starting Jun 10, with an average 6.58% gain in winning years for the short side. The stock closed at 251.04 on Jun 10, down 2.1% on the day and about 16.1% below its 52-week high of 299.36, as this historically weak seasonal window gets underway.
Grouping the data by the presidential election cycle matters here because midterm years often bring policy uncertainty, shifting fiscal priorities and sector rotation that hit industrials differently than in election or pre-election years. This Illinois Tool Works seasonal trend is drawn only from the last 10 midterm election years, so it reflects how the stock has behaved in this specific policy phase rather than across a generic decade of summers.
Across the 10 midterm-year samples, the short pattern has a 90% hit rate, with only one losing year. The average loss for the stock in winning short years is 6.58%, while including the lone losing year trims the all-years average to 6%. That combination of a high Percent Profitable reading and only a modest gap between Avg Profit and Avg Profit - All suggests the losing year did not fully erase the gains from the stronger cycles.
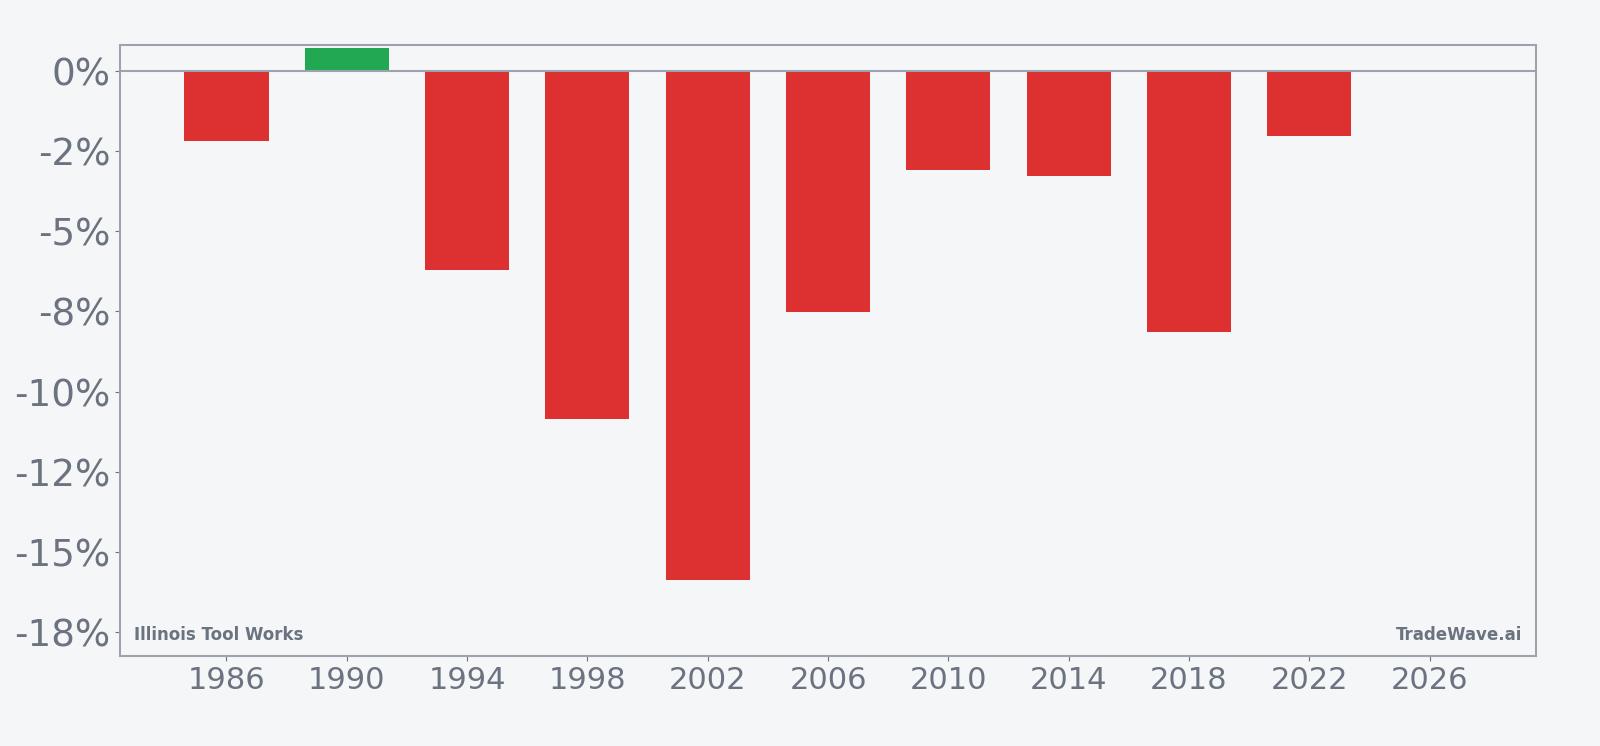
The per-year table shows how this plays out in individual cycles. The strongest year for the short setup was 2002, when Illinois Tool Works fell 15.88% over the window, with a best intraperiod drop of 16.86% from the entry level before bouncing slightly into the close. The weakest year for shorts was 1990, when the stock actually rose 0.71% over the window, even though the maximum favorable move for shorts still reached 8% at one point before reversing.
The historical seasonal average trend for this Illinois Tool Works window slopes lower rather than chopping sideways. Losses for the stock in favorable short years often build gradually, with pressure persisting into the back half of the 44-day stretch instead of a quick one-week air pocket that snaps back.
The combined net, best-case and worst-case moves by year show how much room the stock has historically had to run inside this window.
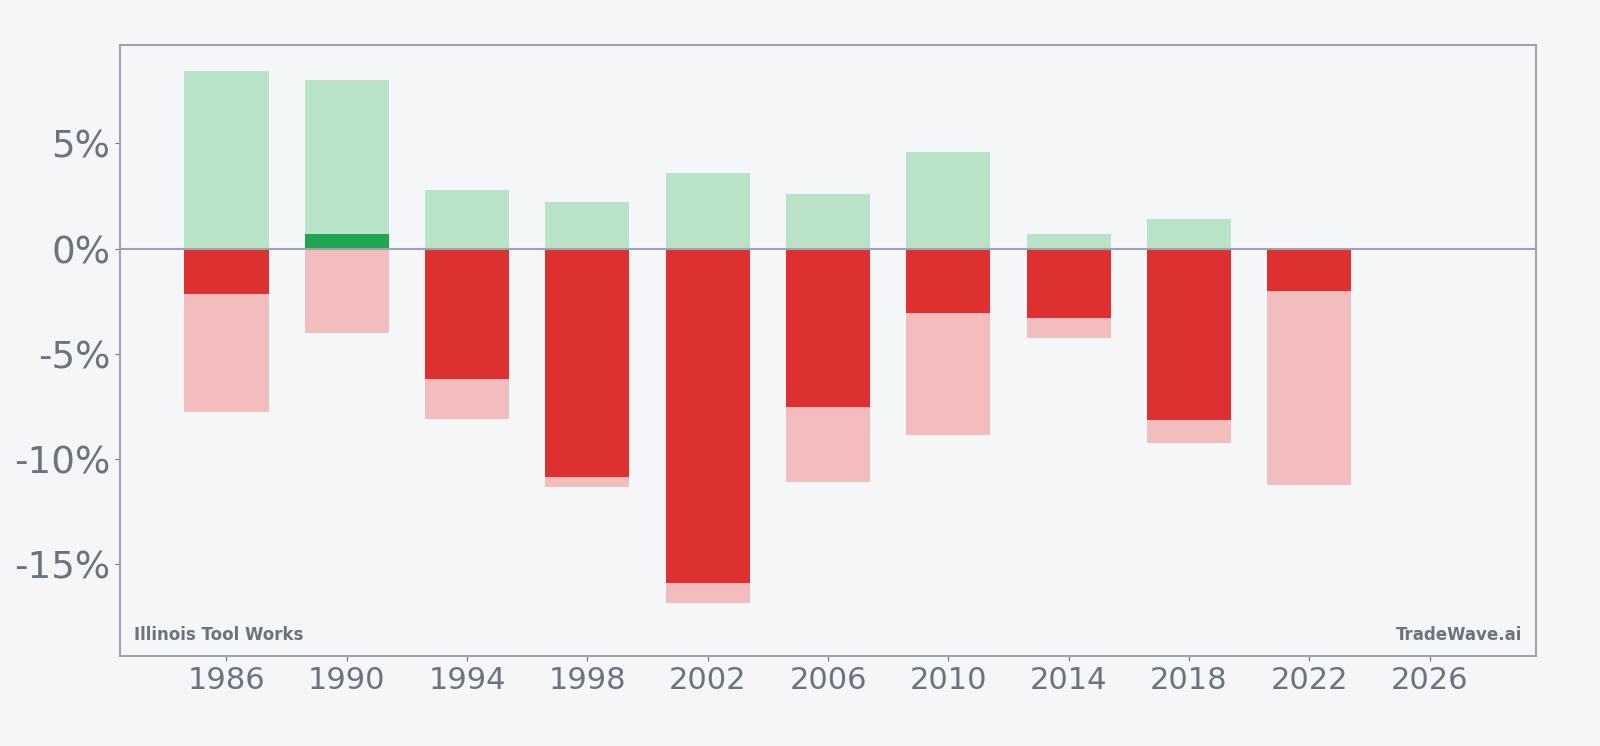
The stacked net, maximum favorable excursion and maximum adverse excursion bars underline how volatile this Illinois Tool Works seasonal pattern has been. In 2002, for example, the stock’s best intraperiod move in the short direction reached 16.86%, while the worst countertrend rally against shorts in 1998 still only climbed about 2.22% before the stock rolled over. Even in the lone losing year for shorts, 1990, the stock first moved roughly 8% in the short direction before reversing into a small net gain for longs by the end of the window.
History does not guarantee future results; adverse excursions can be large even in winning windows, and Illinois Tool Works has shown double-digit intraperiod swings in both directions during this pattern.
Why does Illinois Tool Works (ITW) follow this seasonal pattern?
This midterm-year Illinois Tool Works seasonal pattern may reflect a mix of sector rotation and policy uncertainty that tends to hit industrials in early summer. One likely driver is that midterm election years often bring debates over infrastructure, defense spending and regulation, which can delay orders or push investors to fade cyclical names until policy paths look clearer. Analysts have also pointed to longer-cycle aerospace and defense demand and military funding decisions as key themes for industrials, which can cluster around this part of the calendar in midterm years as budgets and priorities are negotiated.[1]
What is driving Illinois Tool Works (ITW) today?
Illinois Tool Works shares finished Jun 10 at 251.04, down 2.1% on the session, with intraday trading between 250.60 and 257.46 on volume of about 939,000 shares. The stock sits roughly 16.1% below its 52-week high of 299.36 and about 10.1% above its 52-week low near 227.88, with the 50-day moving average up at 258.27 and 20-day average volume closer to 1.37 million shares. That leaves ITW in a consolidating zone rather than at an extreme, even as the historically weak midterm-year summer window opens.
On the fundamental side, analysts discussing the broader industrial and aerospace-and-defense complex have argued that 2025 earnings guidance for peer companies looks conservative, with order books and backlog growth pointing to potential upside as the cycle progresses into 2026.[1] For Illinois Tool Works, that backdrop suggests the macro story is not obviously broken, even if the stock’s historical seasonality in this specific midterm-year slice has leaned bearish. Sector commentary has also highlighted strength in longer-cycle aerospace and defense businesses and potential benefits from military funding and drone-related spending, themes that could support industrial names even during choppier seasonal stretches.[1]
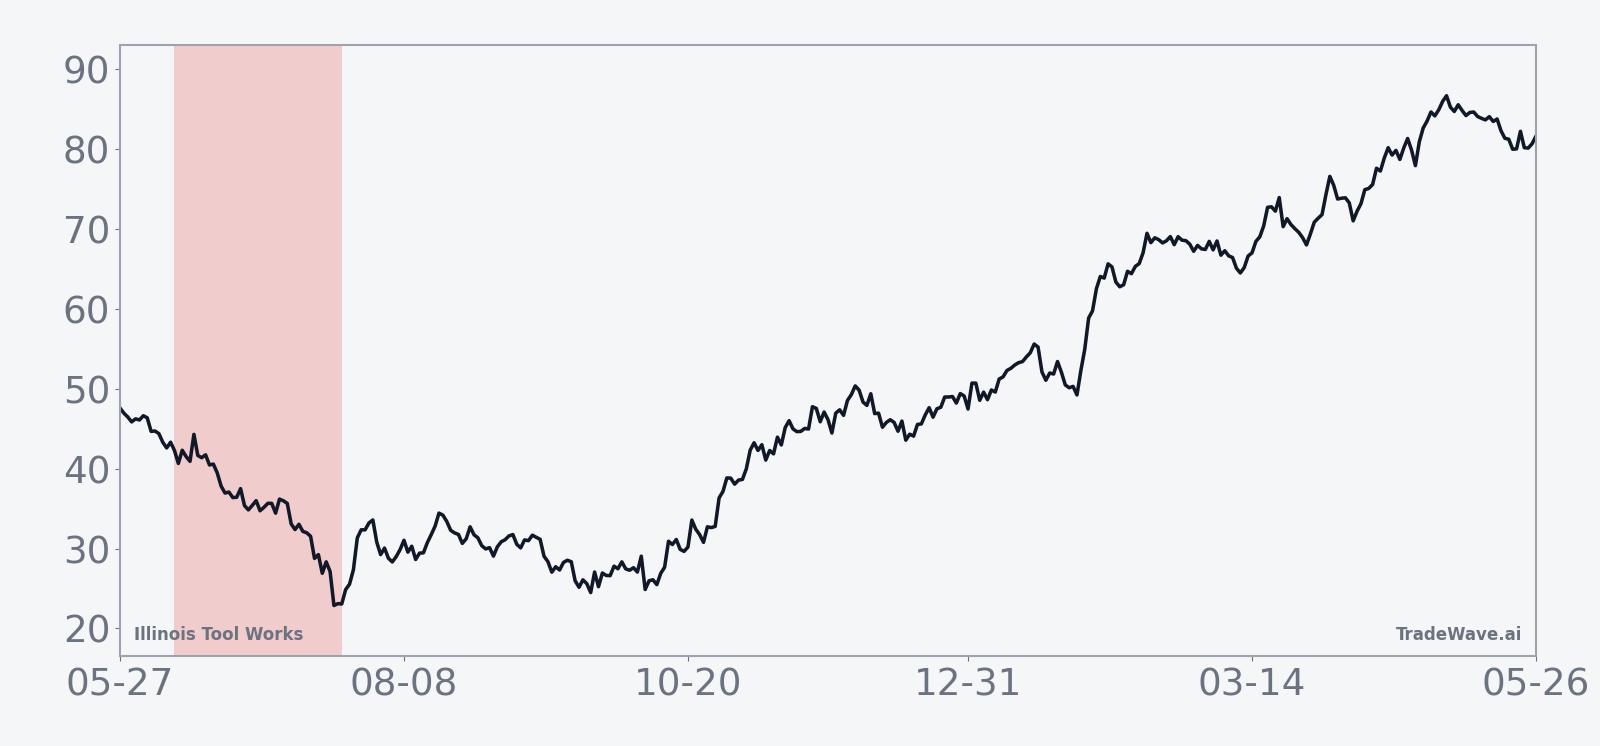
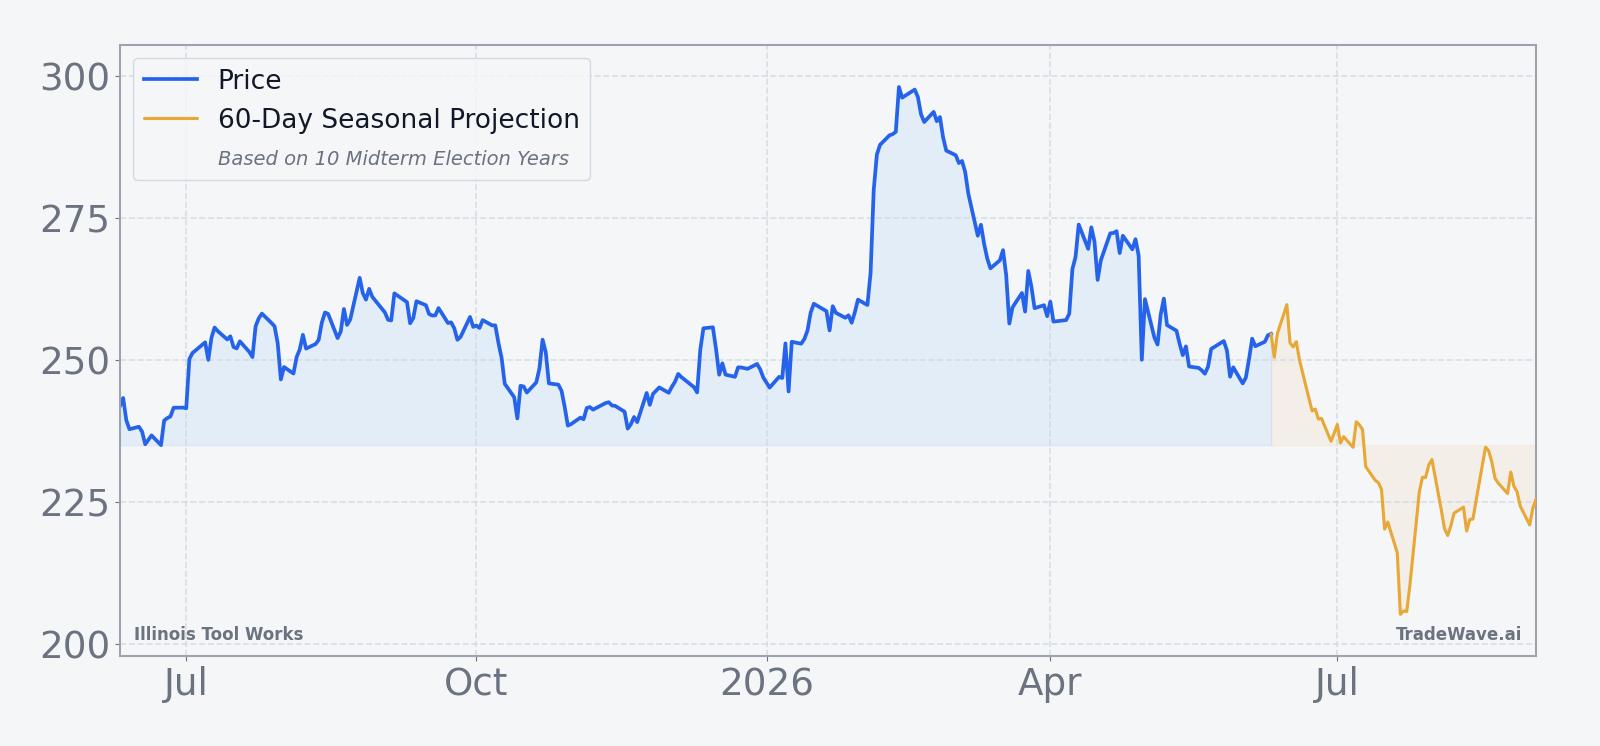
The chart below situates the latest move against Illinois Tool Works’ past year of trading and a 60-day seasonal projection overlay.
What should traders watch in this Illinois Tool Works seasonal window?
For this 44-day midterm-year window, the first thing to watch is whether Illinois Tool Works respects the historical pattern of grinding lower rather than snapping back quickly. A sustained break below the recent intraday low near 250, followed by a drift toward the 240 area, would look more like prior short-friendly years. A sharp reclaim of the 50-day moving average around 258 with strong volume would instead echo the rare losing year for shorts and signal that the pattern is taking a back seat to current fundamentals.
Second, keep an eye on macro and policy headlines tied to industrial demand, especially around aerospace and defense budgets and infrastructure-related spending. If Washington signals firmer long-term funding or if order commentary from industrial peers turns more upbeat, that could blunt the typical midterm-year seasonal weakness even if the historical Illinois Tool Works stock pattern analysis has favored shorts in this stretch.[1]
Finally, monitor how volatility behaves inside the window relative to the historical maximum favorable and adverse excursions. If intraperiod swings stay contained to just a few percentage points, the current regime would be running quieter than the past decade of midterm-year samples. If instead Illinois Tool Works starts printing double-digit moves from the entry level in either direction, it would confirm that this summer window is again one where the stock can travel far before the final outcome is known.
Sources
About this seasonal analysis
Seasonal pattern data is sourced from TradeWave.ai, which analyzes historical price behavior across annual calendar windows going back up to 30 years. Read the full data methodology or the book The 100-Year Pattern by Afshin Moshrefi (2026 edition). Past performance of seasonal patterns does not guarantee future results. This article is for informational purposes only and does not constitute investment advice.