DuPont (DD) Faces 37-Day Midterm Slide Window After Latest 3.7% One-Day Drop
DuPont is heading into a 37-day midterm-year stretch that has been consistently weak for the stock, just as shares pull back and investors weigh a fresh guidance hike and buyback.

What is the seasonal pattern for DuPont (DD)?
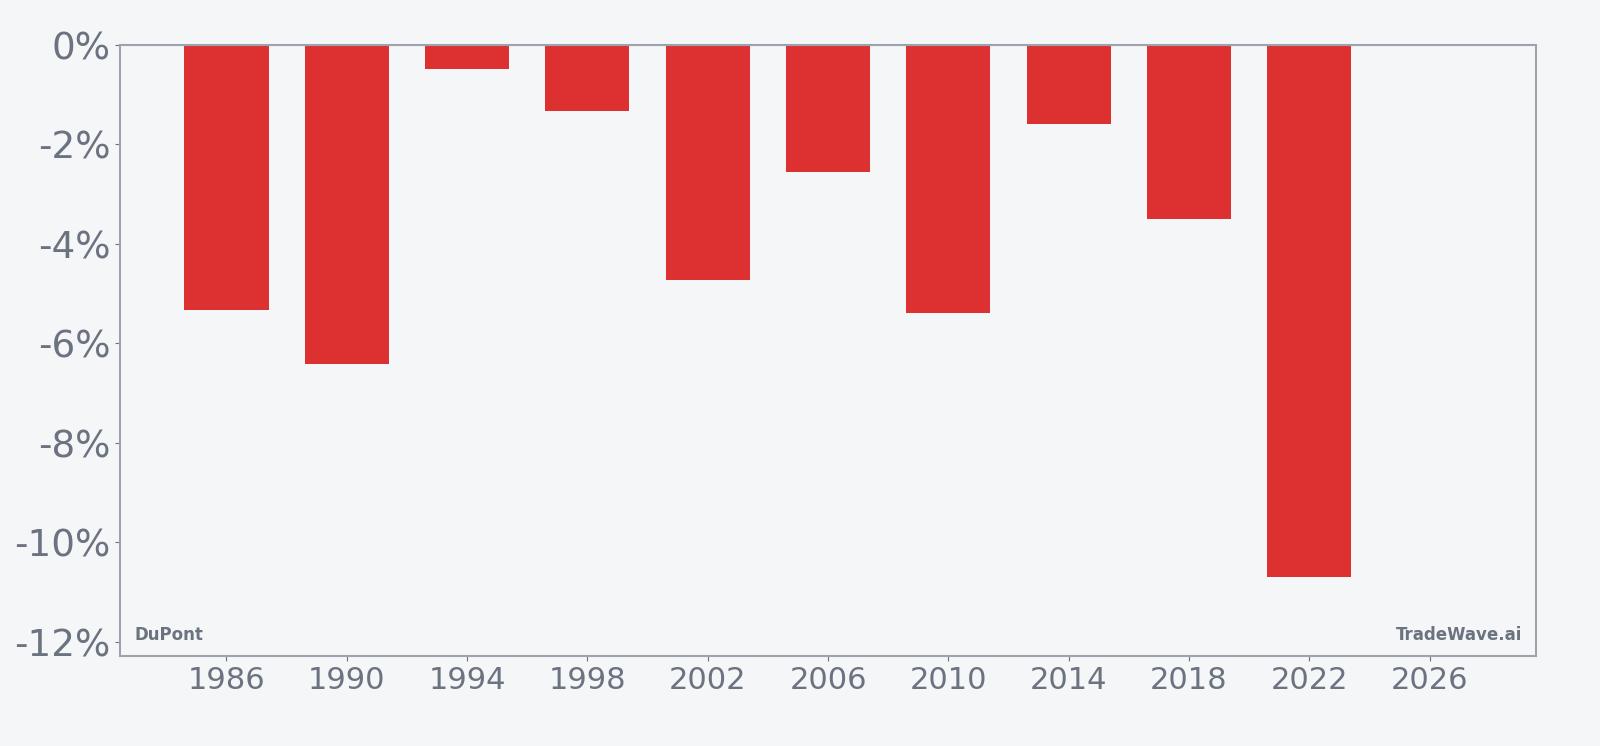
DuPont has fallen in 10 of 10 midterm-year summer windows starting around June 11, with an average decline of 4.2% in those years.
- 10 for 10 in this window, with DuPont posting negative returns in every midterm-year stretch since 1986 and averaging a 4.2% move in the trade direction.
- The upcoming 37-day DuPont trading window starts on Jun 11 and historically favors short exposure during midterm election years.
- Percent Profitable is 100%, with 10 winners and 0 losers for the short pattern across the last 10 midterm election years.
- Average profit in winning years is 4.2%, while the TradeWave Ratio of 1.82 suggests price typically travels meaningfully in the trade direction inside the window.
- Intraperiod swings have been sharp at times, with several years showing double-digit worst drawdowns from entry before the trade finished in the pattern’s favor.
- The pattern sits in the mid part of the midterm election year, a phase that often brings policy uncertainty and choppier trading for industrial names.
According to historical data from TradeWave.ai, this midterm-year slice of the calendar has behaved very differently from an average summer for DuPont. The next section looks at how that pattern has played out across the last ten midterm election cycles.
How has DuPont (DD) traded in this midterm-year summer window?
In the last 10 midterm election years, DuPont has declined in this 37-day summer window every single time, with the short side winning in all 10 cycles and average profits of 4.2%. The new iteration begins on Jun 11, with shares last changing hands around 45.06 after a 3.7% slide in the latest session and trading well below a 52-week high near 51.83. That combination of a clean 10-for-10 record and a fresh pullback gives this year’s window extra weight for traders watching the DuPont seasonal trend.
Grouping the data by the presidential election cycle matters here because this window always lands in the midterm election year, a phase that often brings policy uncertainty, shifting fiscal priorities and more cautious positioning in cyclical industrials. In this pattern, the calendar today is in the mid part of the midterm year, and the 37-day stretch from Jun 11 has repeatedly lined up with softer trading for DuPont even when the broader market backdrop differed from cycle to cycle.
Across the 10 midterm years in the sample, the trade direction is explicitly short. Negative returns for the stock are favorable outcomes for the pattern, and every year from 1986 through 2022 delivered that, with net declines ranging from about 0.5% to more than 10%. The strongest year for the short side was 2022, when DuPont fell 10.69% between entry and exit, while the softest win came in 1994 with a 0.48% drop.
Average profit of 4.2% reflects the mean move in the trade direction across all 10 years, while the median outcome of 4.12% shows that the typical midterm-year iteration has not been skewed by a single outlier. Because there are no losing years in this sample, the average profit figure already captures the full distribution of outcomes for the short pattern. The cumulative return of 50% across the decade of midterm windows underlines how consistently this slice of the calendar has leaned toward downside for DuPont.
The intraperiod path has not been smooth. Maximum favorable excursions, which measure the best point-to-peak move in the trade direction during the window, have reached as much as 13.64% in 2022 and 15.59% in 2010 for the short side, showing that some years delivered deep slides before the exit date. At the same time, maximum adverse excursions, the worst drawdowns from entry, have at times been sizable, with several cycles seeing the stock rally 5% to 9% against the short before rolling over again.
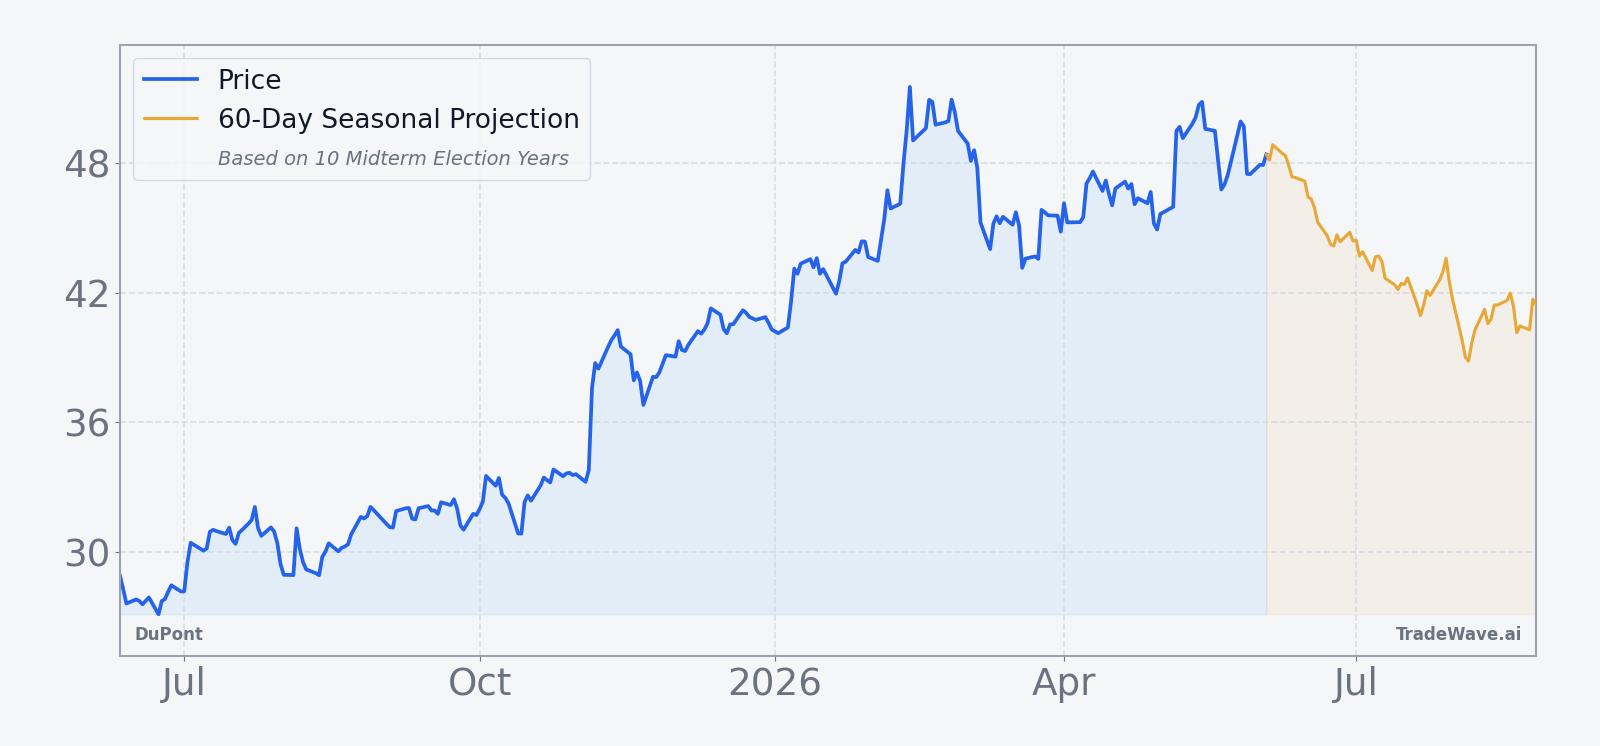
The historical seasonal trend chart for this DuPont trading window shows a fairly steady grind lower across the 37 days when averaged over the last 10 midterm election years, with most of the downside accruing in the middle third of the window rather than right at the start or the end. That suggests the typical pattern has been a modest initial drift, followed by a more decisive leg lower as the window progresses.
A second view combines yearly net results with the best and worst intraperiod swings to show how far DuPont has tended to move inside the window.
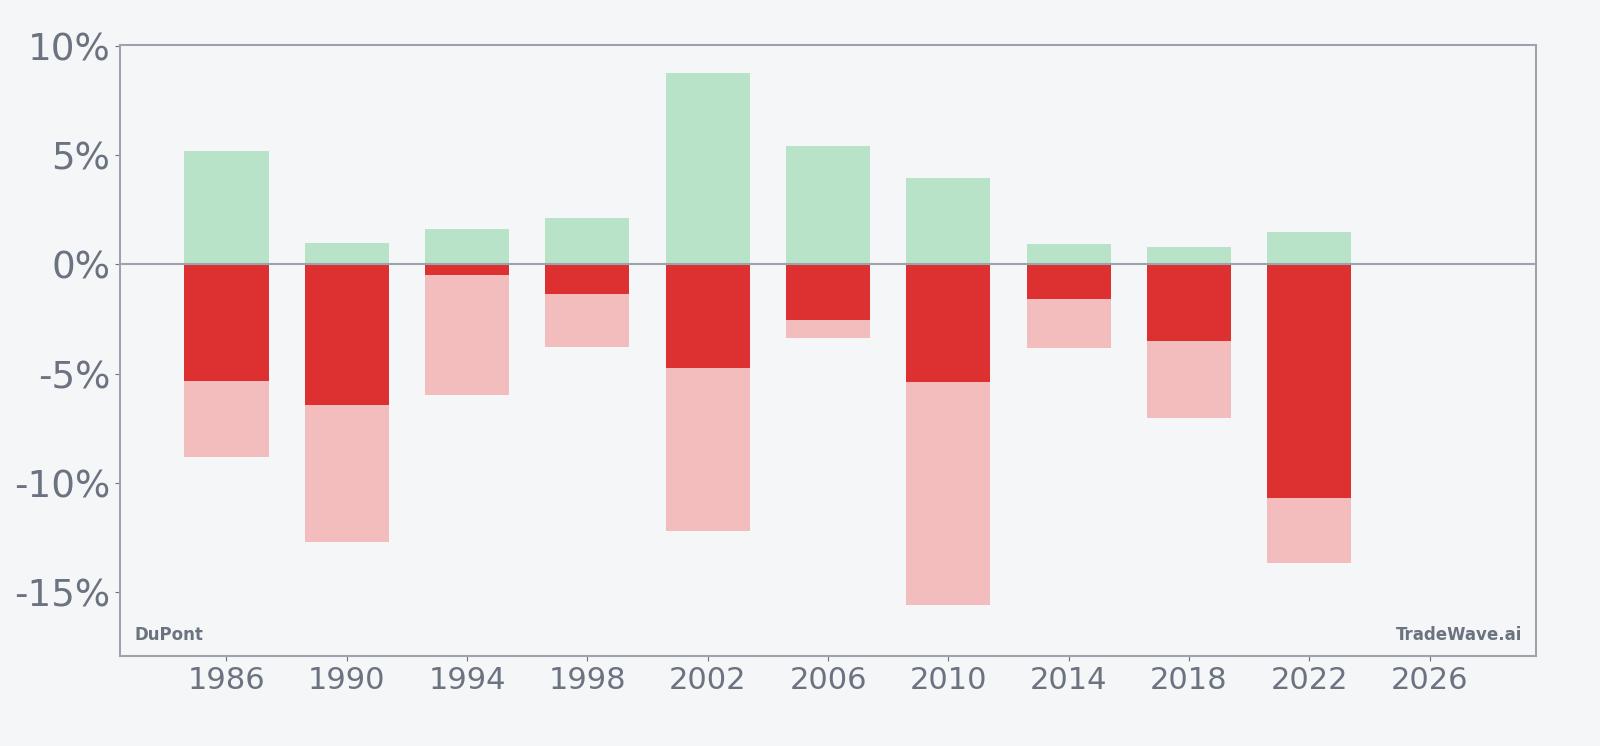
The stacked net, maximum favorable and maximum adverse bars show a pattern that is both consistent and volatile: every year has finished in the short pattern’s favor, yet several cycles featured double-digit rallies against the position before the eventual decline. Add it up: 10 straight midterm-year windows have rewarded shorts on this calendar slice, but they have often demanded patience and tolerance for sharp countertrend moves along the way.
Why does DuPont (DD) follow this seasonal pattern?
One likely driver is the way midterm election years cluster policy and macro uncertainty into the middle of the year, which can weigh on capital spending expectations for industrial and materials names like DuPont. Analysts have also pointed to institutional portfolio repositioning around midyear, as managers rebalance exposure to cyclical sectors ahead of the second-half policy and budget calendar. This pattern may also reflect how DuPont’s earnings and guidance cadence has historically lined up with midyear macro headlines, creating a pocket where investors are quicker to fade strength than to chase it.
History does not guarantee future results, and even in a window with a perfect track record, adverse excursions inside the period can be large before the pattern ultimately plays out.
What is driving DuPont (DD) today?
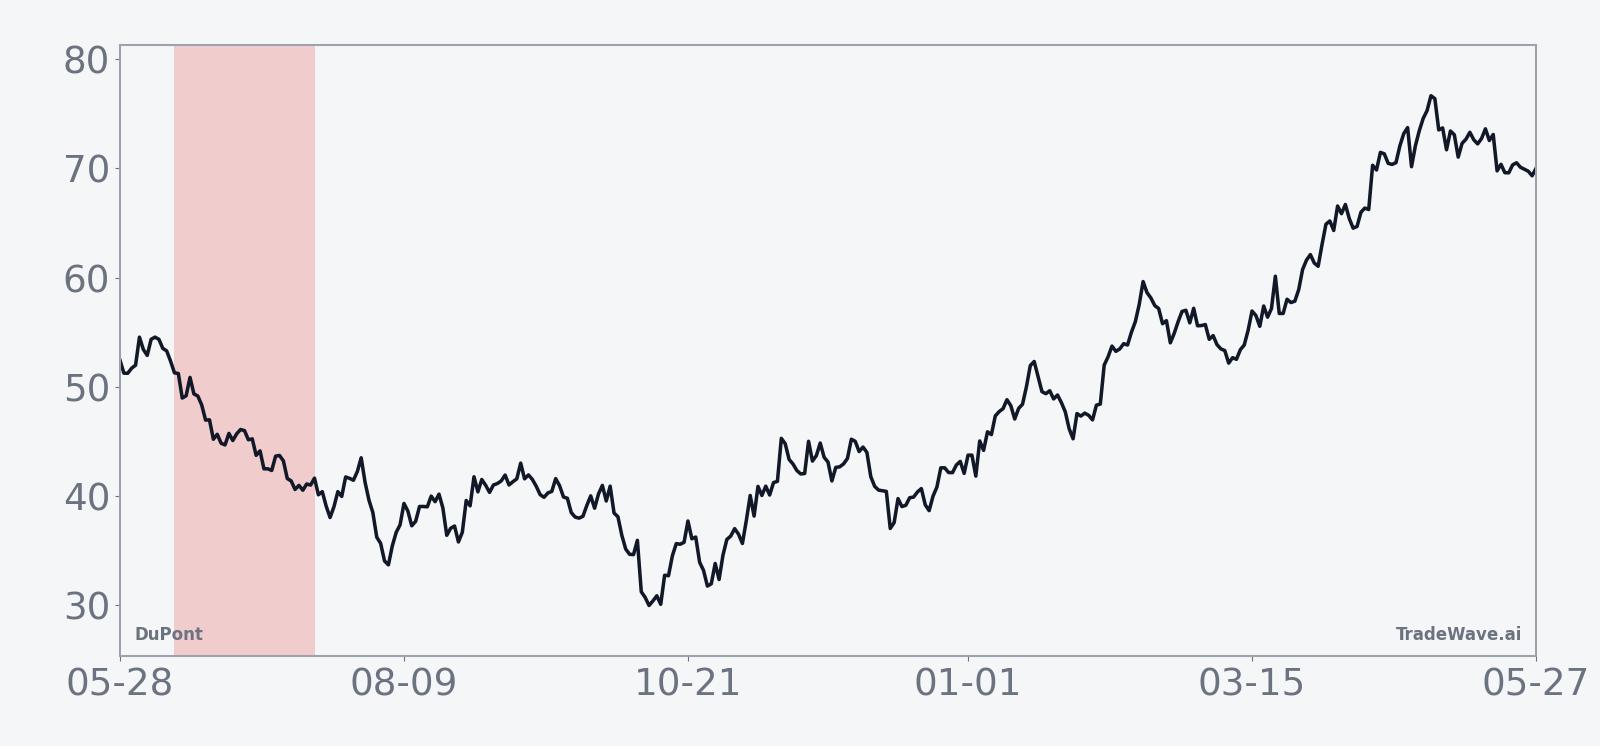
DuPont shares closed at 45.3 in the latest session, down 3.7% on the day, leaving the stock about 12.6% below its 52-week high near 51.83 and well above a 52-week low around 11.07. The pullback comes after a stretch of strong performance following the Qnity Electronics spinoff and a series of multi-session rallies that left the stock vulnerable to profit-taking in the short term.[1]
On May 5, 2026, DuPont lifted its full-year adjusted EPS guidance to a range of $2.35 to $2.40 and nudged its net sales outlook higher to $7.16 billion to $7.22 billion, while also announcing a $275 million share buyback program.[2] That combination of better earnings visibility and capital returns has helped reset the story around the “remaining” DuPont after the separation of its electronics business, positioning the stock as a more focused play on industrial and specialty materials demand.
The guidance hike followed a longer restructuring arc. In Nov 2025, DuPont reported Q3 2025 net sales of $3.07 billion and adjusted EPS of $1.09, topping LSEG estimates, but the market reaction was muted as investors worked through the accounting impact of the Qnity Electronics spinoff and the Aramids divestiture being reported as discontinued operations.[1] Earlier, in Aug 2025, the company had adjusted its 2025 outlook after sales gains, signaling a gradual shift toward a leaner, more targeted portfolio.[3]
CNBC’s coverage in Oct 2025 framed the post-spinoff DuPont as a more straightforward industrial and materials company, with management leaning into megatrends such as electrification, housing shortages, aerospace demand and sustainability as key growth drivers for the remaining portfolio.[4] That macro backdrop, combined with the buyback and higher earnings bar, means investors are entering this historically weak seasonal window with a fundamentally stronger, but also more cyclical, DuPont than in some past cycles.
The chart below places the latest pullback in the context of DuPont’s past year of trading and a 60-day seasonal projection.
What should traders watch in this DuPont (DD) window?
First, the calendar: the 37-day midterm-year window starting Jun 11 has been a reliable pocket of weakness for DuPont in the past, so how the stock behaves in the first two weeks will be an early tell on whether this cycle rhymes with history. A quick bounce back toward the 50-day moving average near 47.13 would mark a departure from the typical pattern, while a grind lower that keeps rallies contained below that band would be more in line with prior midterm summers.
Second, the policy and macro tape: midterm years often bring shifting expectations around fiscal spending, regulation and industrial policy, and DuPont’s exposure to electrification, housing and aerospace means it is sensitive to those headlines.[4] Any signs of slowing demand in those end markets, or a more cautious tone from management in upcoming appearances, would likely reinforce the historical seasonal bias.
Third, watch how volume behaves around any sharp moves. Past cycles have seen DuPont stage sizable intraperiod rallies against the short pattern before rolling over, and earlier coverage has highlighted multi-session rallies and strong post-spinoff performance followed by short-term pullbacks.[1] If renewed strength comes on lighter volume and stalls quickly, it would fit the historical script of countertrend pops inside a broader weak window; sustained, high-volume buying would argue that this midterm-year iteration is breaking the mold.
Finally, keep an eye on how the stock trades into and out of company-specific news, including any updates tied to the buyback pace or tweaks to the full-year outlook.[2] A market that shrugs off good news during this window would echo the pattern of prior midterm summers, while a market that rewards positive surprises with durable gains would be a clear sign that DuPont’s election-cycle seasonal pattern is starting to evolve.
Sources
- CNBC, "DuPont's stock surge to 52-week highs takes a pause. But we still see plenty of upside ahead" (Nov 06, 2025)
- The Wall Street Journal, "DuPont Lifts Outlook, Plans $275 Million Buyback" (May 05, 2026)
- The Wall Street Journal, "DuPont de Nemours Adjusts 2025 Outlook Following Sales Gains" (Aug 05, 2025)
- CNBC, "DuPont prepares to say goodbye to electronics. What investors get with the remaining company" (Oct 15, 2025)
- CNBC, "Why DuPont's electronics business has the most potential after next month's split" (Oct 13, 2025)
About this seasonal analysis
Seasonal pattern data is sourced from TradeWave.ai, which analyzes historical price behavior across annual calendar windows going back up to 30 years. Read the full data methodology or the book The 100-Year Pattern by Afshin Moshrefi (2026 edition). Past performance of seasonal patterns does not guarantee future results. This article is for informational purposes only and does not constitute investment advice.