This 59-Day Midterm Window Has Delivered 79% Cumulative Gains for Abbott Laboratories (ABT)
Abbott Laboratories is heading into a historically strong 59-day midterm-year trading window even as the stock trades well below its 52-week high after guidance cuts tied to the Exact Sciences deal.
What is the seasonal pattern for Abbott Laboratories (ABT)?
Abbott Laboratories has risen in 10 of 10 midterm-year summer windows starting around Jun 19, with an average gain of 6.1% in winning years.
- 10 for 10 in this 59-day midterm-year window, with average winner gains of 6.1% and a 79% cumulative return across the sample.
- Percent Profitable is 100%, with 10 winners and 0 losers in the last 10 midterm election years for this specific Abbott Laboratories trading window.
- The upcoming window begins Jun 19, 2026 and runs for 59 trading days, covering much of the summer in the current midterm election year.
- Typical gains cluster in the mid-single digits, but the strongest year in the sample delivered a 17.22% advance, showing that upside bursts have occurred.
- Intraperiod swings have been meaningful, with some years seeing adverse moves of more than 20% before finishing higher, so drawdown risk has not disappeared even in winning seasons.
- The TradeWave Ratio of 2.08 and a Sharpe ratio of 1.29 point to a historically favorable risk-reward profile for long exposure during this ABT seasonal trend.
According to historical data from TradeWave.ai, Abbott’s midterm-year summer behavior has followed a distinct seasonal script that differs from its average year-round trading. The next section walks through how that script has played out in prior cycles and what that backdrop means for the upcoming 59-day window.
How has Abbott Laboratories (ABT) traded in past midterm-year summer windows?
The seasonal window beginning Jun 19 and spanning 59 trading days has been one of Abbott Laboratories’ most reliable patterns, with gains in all 10 midterm election years in the sample and an average profit of 6.1% for long positions. That track record comes as ABT changes hands around 90.78, leaving the stock about 32.0% below its 52-week high of roughly 133.55 and only 10.8% above its 52-week low of 81.97, a reminder that the broader trend has been under pressure.
Grouping the data by the presidential election cycle matters here because this pattern only looks at the last 10 midterm election years, not a run of consecutive calendar years. Midterm years often bring policy uncertainty, shifting reimbursement expectations and sector rotation in healthcare, so a midterm-specific Abbott Laboratories seasonal pattern can behave very differently from the same summer stretch in other phases of the cycle.
Across those 10 midterm-year iterations, the trade direction has been long every time, and every single window finished in the green. The weakest outcome still delivered a gain of just over 3%, while the strongest year, 2006, posted a 17.22% advance from entry to exit. Add it up and the cumulative return across all 10 windows is 79%, a striking record for a repeatable 59-day slice of the calendar.
The average winner gain of 6.1% reflects the fact that most years have produced mid-single-digit advances rather than outlier spikes. Median profit sits at 5.0%, which lines up with that story of steady, repeatable upside rather than a pattern dominated by one or two huge years. Because there were no losing years in the sample, the all-years average is effectively the same as the average winner, reinforcing how consistent this ABT seasonal trend has been.
Intraperiod swings tell a more nuanced story. The maximum favorable move, or best point-to-peak rally within the window, has often run well ahead of the final net gain, with several years seeing double-digit percentage run-ups before settling back. At the same time, the maximum adverse move, which measures the worst drawdown from the entry price during the window, has occasionally been deep, including a roughly 20.3% intraperiod drop in 2002 before the stock recovered to finish higher.
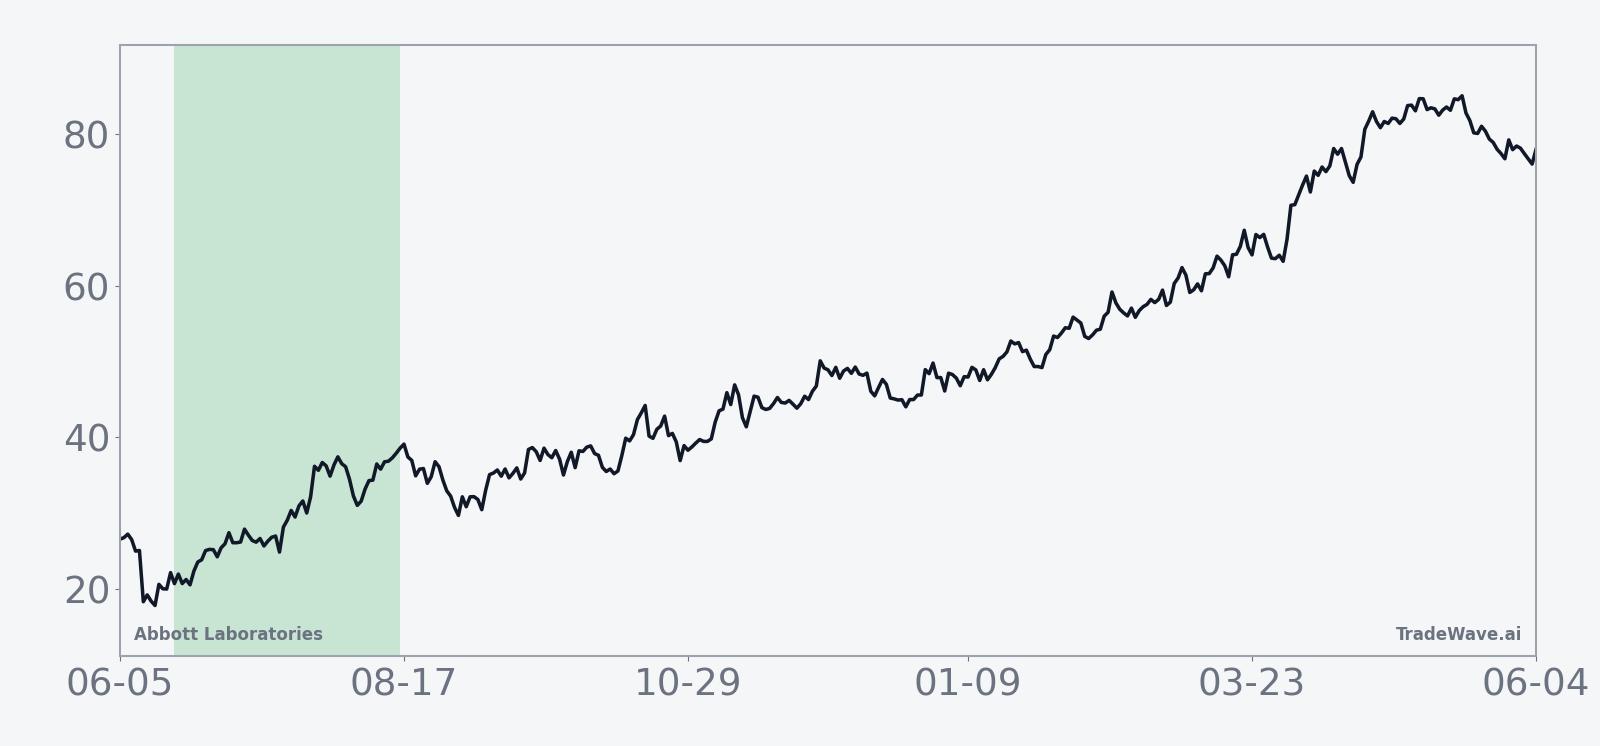
The historical seasonal average trend line for this Abbott Laboratories trading window shows gains that tend to build gradually rather than in a single burst. In many of the past midterm years, the stock has chopped sideways or even dipped early in the window before the bulk of the advance arrived in the back half, which matters for traders thinking about timing and patience inside the 59-day span.
The cumulative return curve across the 59 days reinforces that picture of steady accrual. Instead of a jagged profile dominated by a few big years, the curve slopes upward in a relatively smooth fashion, suggesting that the positive bias has been broad-based across cycles. That does not remove risk, but it does show that this has not been a “one-hit wonder” pattern.
Viewed through the lens of volatility, the combination of strong maximum favorable excursions and sometimes sharp maximum adverse excursions points to a window where both upside and downside swings have been meaningful. Large positive spikes in some years show that rallies can accelerate quickly once they get going, while the deeper drawdowns in others underline that even a historically strong seasonal window can feel uncomfortable in real time.
A second view of yearly net results and intraperiod swings shows how upside and drawdowns have coexisted in this window.
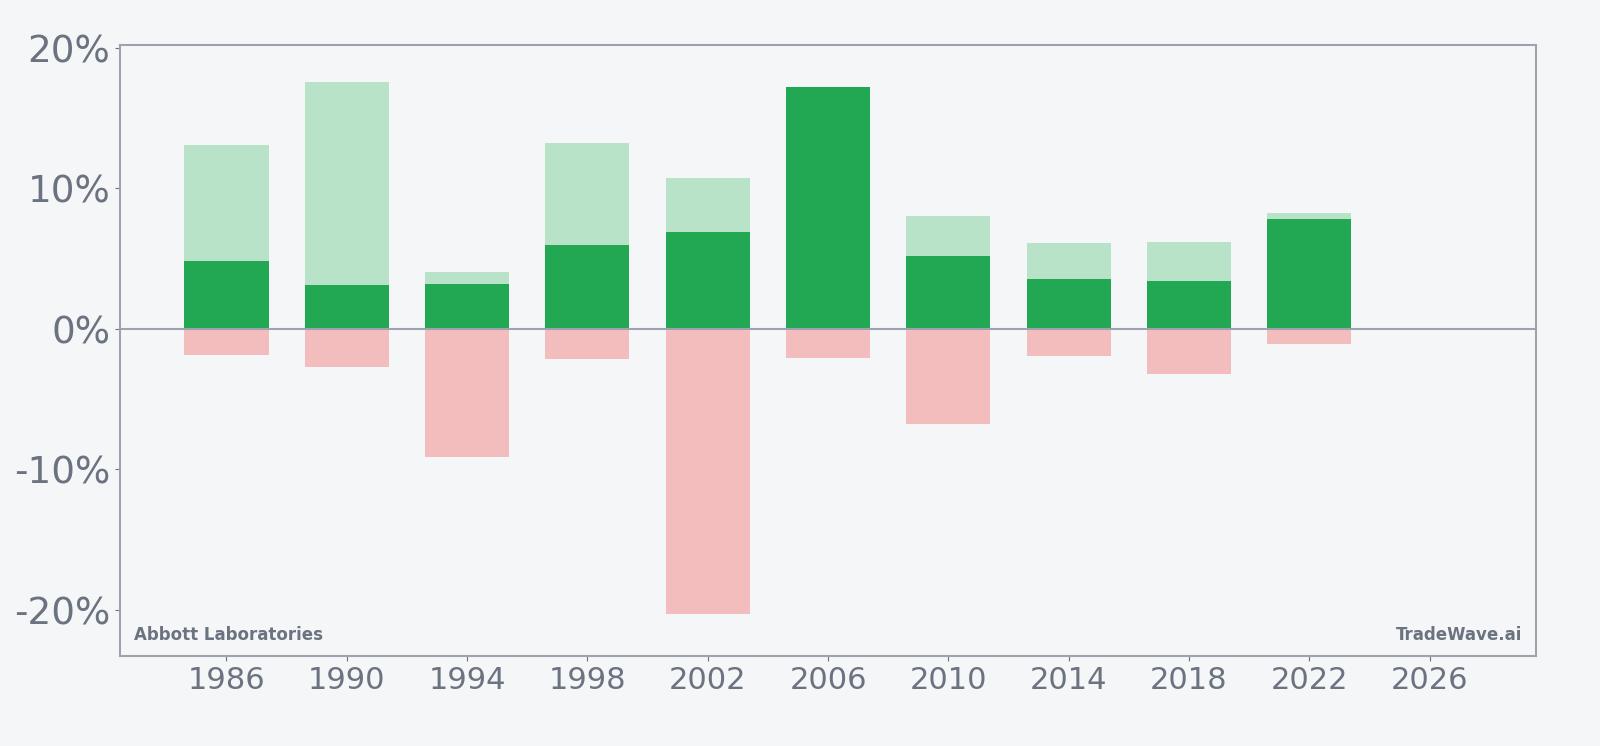
History does not guarantee future results; adverse excursions (MAE) can be large even in winning windows.
Why does Abbott Laboratories (ABT) follow this seasonal pattern?
One likely driver is the way Abbott’s earnings calendar and guidance updates cluster around the middle of the year, which can reset expectations and trigger positioning shifts in medical technology stocks. Analysts have also pointed to midyear portfolio rebalancing and sector rotation in healthcare during midterm election years, as investors reassess policy risk and reimbursement trends. This pattern may reflect that combination of fresh fundamental information and institutional repositioning flowing through a relatively tight 59-day trading window.
What is driving Abbott Laboratories (ABT) today?
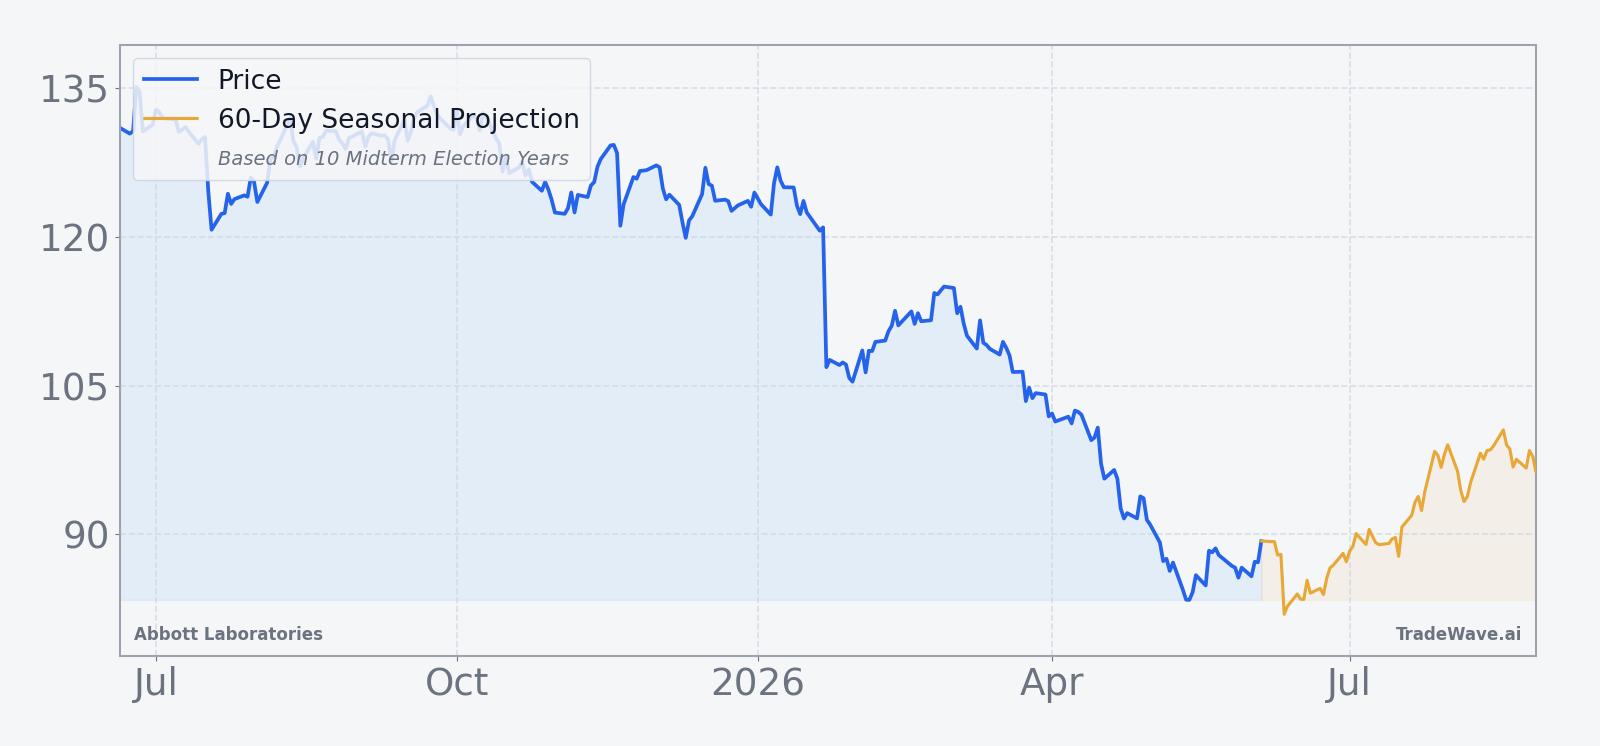
Abbott Laboratories shares last traded around 90.78, up roughly 3.5% from the prior close, as the stock continues to stabilize after a volatile stretch that left it about 32.0% below its 52-week high and only 10.8% above its 52-week low. The move comes in the wake of an Apr 16, 2026 profit forecast cut tied to a roughly $0.20-per-share hit from the company’s about $23 billion acquisition of Exact Sciences, a guidance reset that pushed the stock more than 4% lower in premarket trading at the time and sharpened investor focus on integration risk and margin pressure.[3]
The chart below situates the latest move in its recent multi-month context, alongside a 60-day seasonal projection based on past midterm-year behavior.
In Apr 2026, Abbott also reported first-quarter results that beat expectations on strength in cancer diagnostics and medical devices, even as the Exact Sciences hit forced management to trim its full-year profit outlook.[3] That combination of solid operating performance and softer guidance has kept the stock in a tug-of-war between investors focused on near-term earnings dilution and those looking through to potential revenue synergies in diagnostics and cardiovascular devices.
Earlier in the current cycle, Abbott’s medical devices franchise, including heart devices and continuous glucose monitors, consistently outperformed expectations, while diagnostics and nutrition lagged and weighed on revenue growth.[2] In Jul 2025, the company also flagged that U.S. tariffs could cost “a few hundred million dollars” annually and announced plans to build a new manufacturing facility in Georgia by 2028 to bring more production onshore and blunt that impact.[1] Those strategic moves frame the macro backdrop for the upcoming seasonal window: a medtech leader investing through policy noise while working through acquisition-related earnings drag.
Sources
- Reuters, "Abbott beats quarterly profit estimates on medical devices demand - Reuters" (Jul 17, 2025)
- Reuters, "Abbott revenue misses as diagnostics, nutrition weakness clouds medical devices lift - Reuters" (Oct 15, 2025)
- Reuters, "Abbott trims 2026 profit forecast on Exact deal hit, shares fall | Reuters" (Apr 16, 2026)
About this seasonal analysis
Seasonal pattern data is sourced from TradeWave.ai, which analyzes historical price behavior across annual calendar windows going back up to 30 years. Read the full data methodology or the book The 100-Year Pattern by Afshin Moshrefi (2026 edition). Past performance of seasonal patterns does not guarantee future results. This article is for informational purposes only and does not constitute investment advice.