DuPont (DD) Has Dropped in 10 of 10 Midterm June-July Windows as 37-Day Weak Stretch Nears
DuPont is heading into a June–July stretch that has been reliably weak in past midterm election years, just as the stock trades well below its 52-week high after a guidance raise and new buyback.

What is the seasonal pattern for DuPont (DD)?
DuPont has fallen in 10 of 10 midterm-year June–July windows during this pattern, with an average gain of 4.2% in winning short trades.
- 10 for 10 in this window, with short trades averaging 4.2% gains across the last 10 midterm election years.
- The upcoming 37-day DuPont trading window starts Jun 11 and has historically favored downside for the stock.
- Percent Profitable is 100%, with 10 winners and 0 losers for the short-side seasonal setup.
- Average winner profit of 4.2% compares with a cumulative 50% gain for the strategy across all ten cycles.
- Intraperiod swings have been sharp, with past years showing double-digit peak drawdowns against the trade before ultimately resolving lower.
- TradeWave Ratio of 1.82 and a Sharpe ratio of 1.26 point to a historically efficient short window, albeit with meaningful volatility.
According to historical data from TradeWave.ai, this midterm-year slice of the calendar has behaved very differently from an average summer for DuPont, and the next iteration is just days away.
How has DuPont (DD) traded in this midterm-year June–July window?
DuPont has declined in every single midterm-year June–July window across the last 10 cycles, with short trades averaging 4.2% gains over 37 trading days. Shares last changed hands at $48.04, leaving the stock about 7.3% below its 52-week high of roughly $51.83 and modestly above its 50-day moving average near $46.99. That combination of a strong historical seasonal bias and a stock that has already rallied off its lows gives this upcoming stretch more weight than a typical summer lull.
Because this pattern is grouped by the presidential election cycle, it only looks at midterm election years, which tend to feature policy uncertainty, shifting fiscal priorities and more volatile positioning in cyclical names. For a diversified industrial and materials player like DuPont, that has often meant choppy demand expectations and valuation resets as investors reassess growth and capital spending into the year before the presidential election.
This seasonal window begins on Jun 11 and spans 37 trading days. Historically, during this period, DuPont has tended to drift lower, which is favorable for the short trade direction embedded in the pattern. Percent Profitable sits at 100%, with 10 winners and 0 losers, and the cumulative return across those cycles is 50%, meaning the strategy has added up to a sizable gain over time.
The average profit of 4.2% reflects the mean outcome across all ten short trades, since there were no losing years in the sample. Median profit is close at 4.12%, which suggests the distribution of outcomes has been relatively tight around that mid-single-digit gain rather than dominated by one or two outliers. Annualized, the pattern translates to a 4.16% return, which is notable for a window that lasts just over seven weeks.
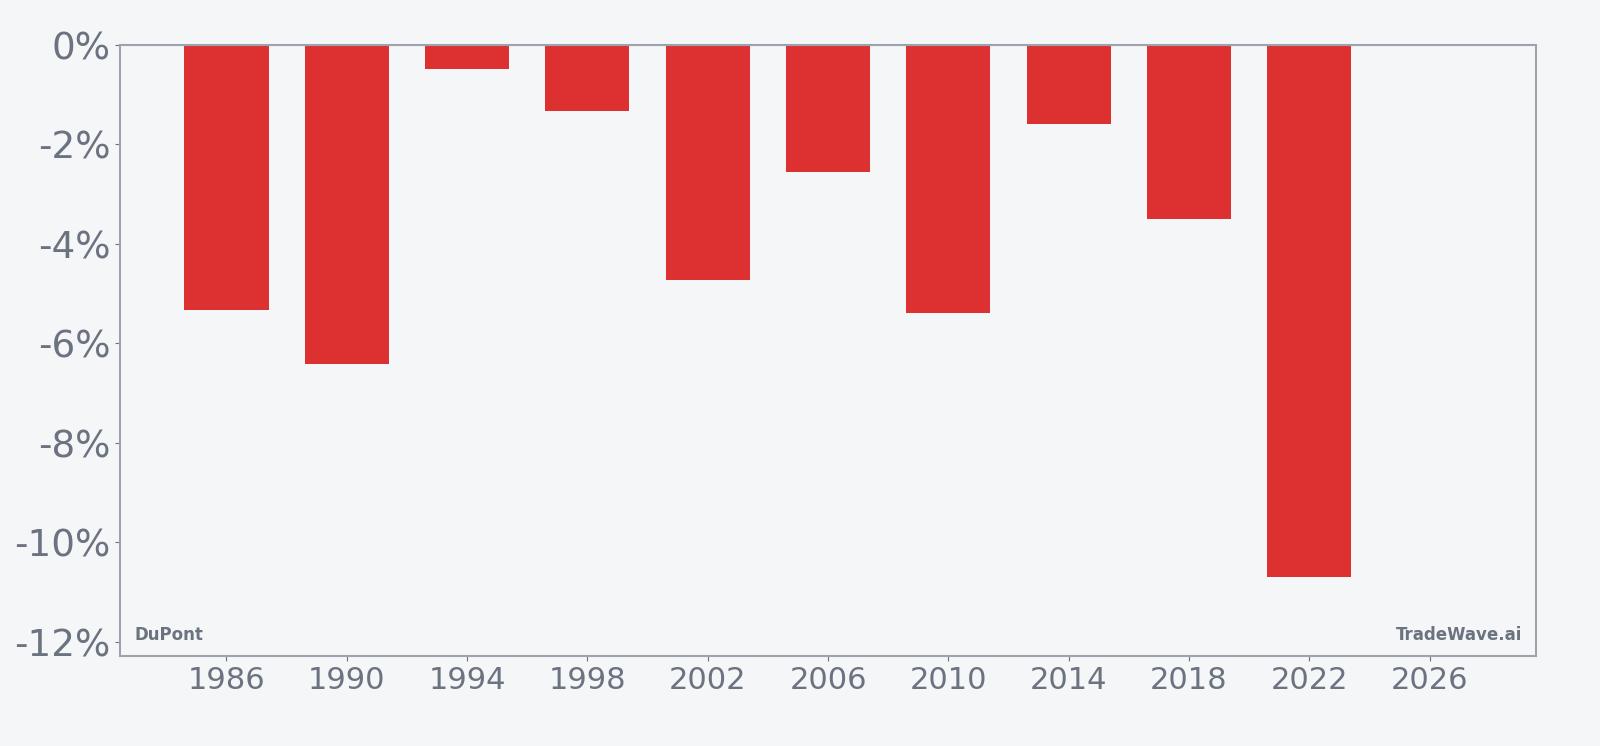
Looking at individual years, the weakest DuPont performance for the stock itself came in 2022, when the short trade captured a 10.69% decline over the window, while the smallest move was in 1994, when the stock slipped just 0.48% from entry to exit. In 2010, the pattern still worked for shorts with a 5.39% gain, but that year also featured one of the deepest intraperiod drawdowns against the trade before the stock rolled over.
The historical seasonal average trend line slopes lower through most of the window, with only modest countertrend bounces. That suggests the typical pattern has been a grind lower rather than a single sharp break, which aligns with the idea of investors gradually de-risking cyclical exposure as midterm-year policy debates heat up.
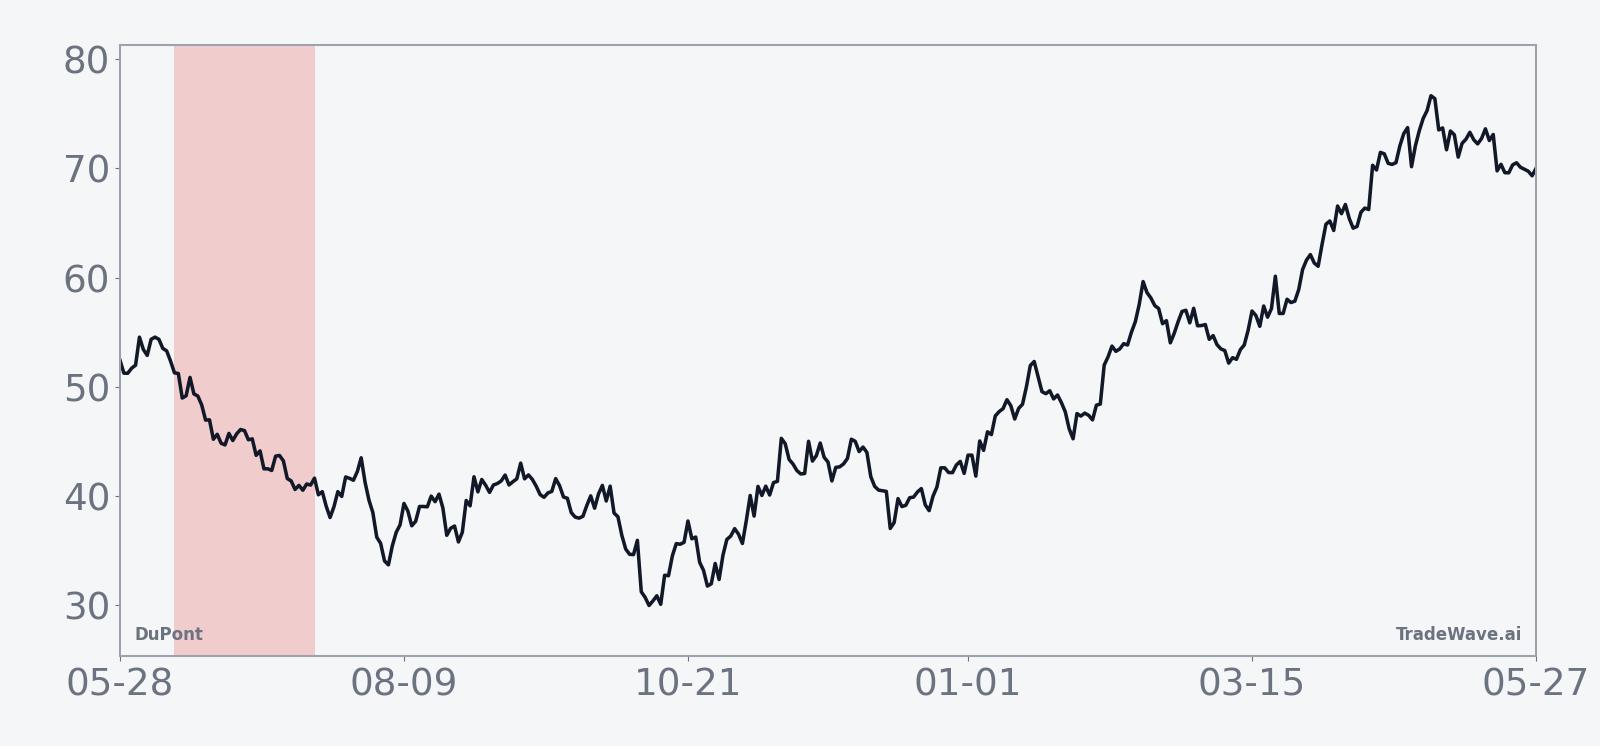
A closer look at yearly net returns alongside peak run-ups and worst drawdowns shows how consistently the pattern has favored shorts, even when DuPont rallied inside the window before reversing.
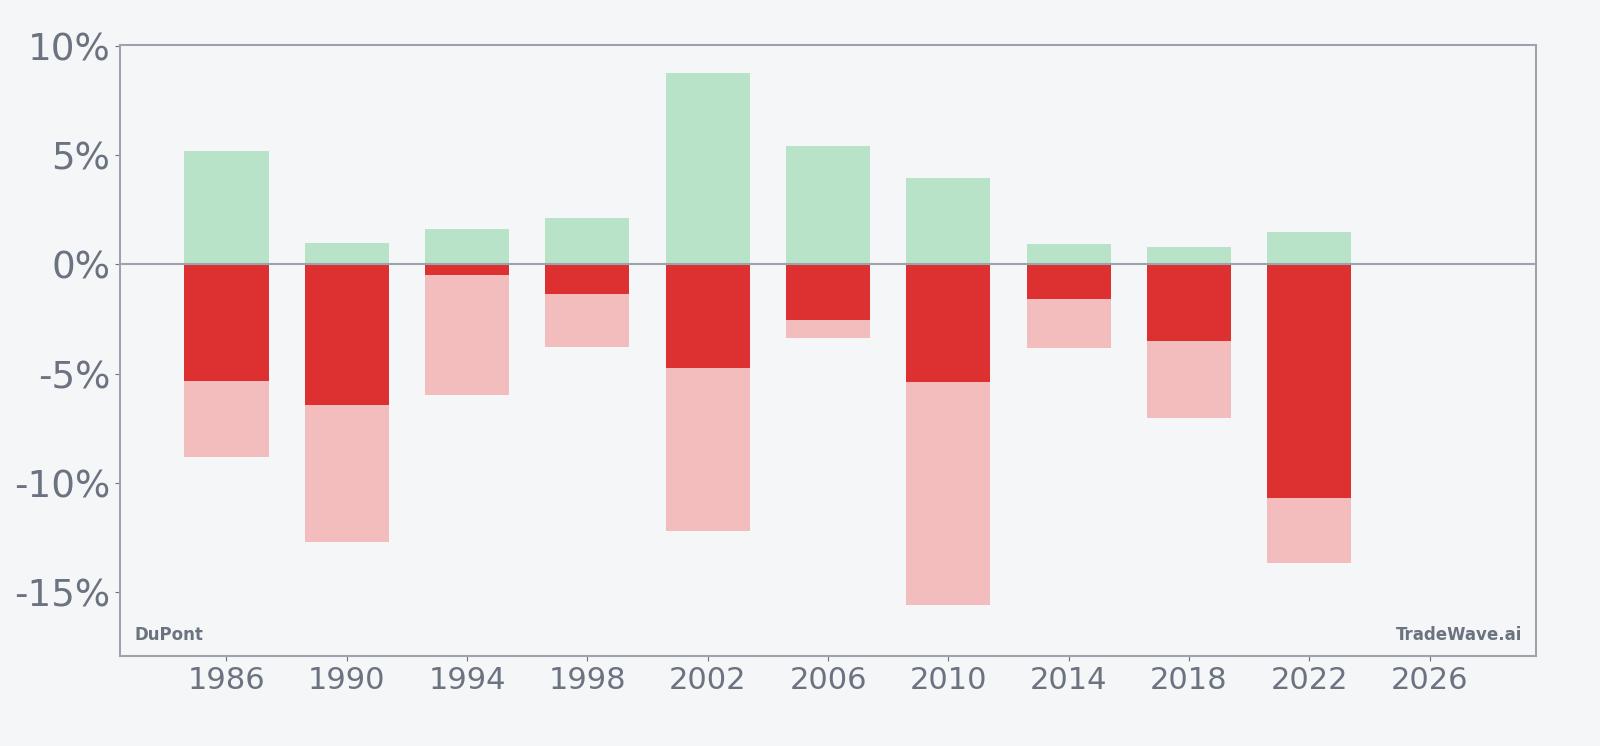
The bar chart that combines net returns with maximum favorable and adverse excursions shows a clear pattern: in years like 2002, 2010 and 2022, DuPont often moved sharply against the short early in the window, with adverse swings of more than 12% before ultimately finishing lower. That mix of sizable maximum favorable moves and deep maximum adverse moves points to a high-variance window where the direction has been consistent but the path has been bumpy.
History does not guarantee future results; adverse excursions can be large even in winning windows, and DuPont has previously seen double-digit intraperiod drawdowns against the short side before the pattern resolved lower.
Why does DuPont (DD) follow this seasonal pattern?
One likely driver is the way midterm election years cluster industrial and materials headlines around fiscal policy, infrastructure spending and regulation, which can prompt portfolio managers to trim cyclical exposure into early summer. Analysts have also pointed to sector rotation out of economically sensitive names and into defensives during periods of policy uncertainty, which can weigh on stocks like DuPont even when company fundamentals are improving. The pattern may also reflect institutional rebalancing around midyear as funds adjust to first-half performance and reset risk ahead of the stronger pre-election year that typically follows.
What is driving DuPont (DD) today?
DuPont slipped 1.3% to close at $48.04 on Wednesday, leaving the stock about 7.3% below its 52-week high and trading slightly above its 50-day moving average after a strong run off last year’s lows. The move comes a month after the company lifted its full-year adjusted earnings guidance to a range of $2.35 to $2.40 per share, raised its sales outlook and authorized a $275 million share buyback, signaling management confidence in the post-spinoff portfolio.[3]
In May, DuPont reported that first-quarter net sales rose to $1.68 billion from $1.61 billion a year earlier and that it had swung back to profit, reinforcing the idea that the streamlined business can grow earnings even in a mixed macro backdrop.[3] That follows a 2025 stretch in which the company completed the separation of its Qnity electronics unit and told investors to expect a cleaner, more focused industrial and materials story, with end markets spanning healthcare, water, industrial and building applications.[5][6]
Analysts covering the name have generally framed the post-spinoff DuPont as a re-rating story, arguing that a simpler portfolio and improving margins could help the stock close the gap with peers over time.[5][10] A June 2025 GuruFocus aggregation showed an “Outperform” consensus rating and a long-term price target framework that sat well above where the stock traded at that time, though those targets reflected an earlier price regime and the pre-Qnity structure.[1]
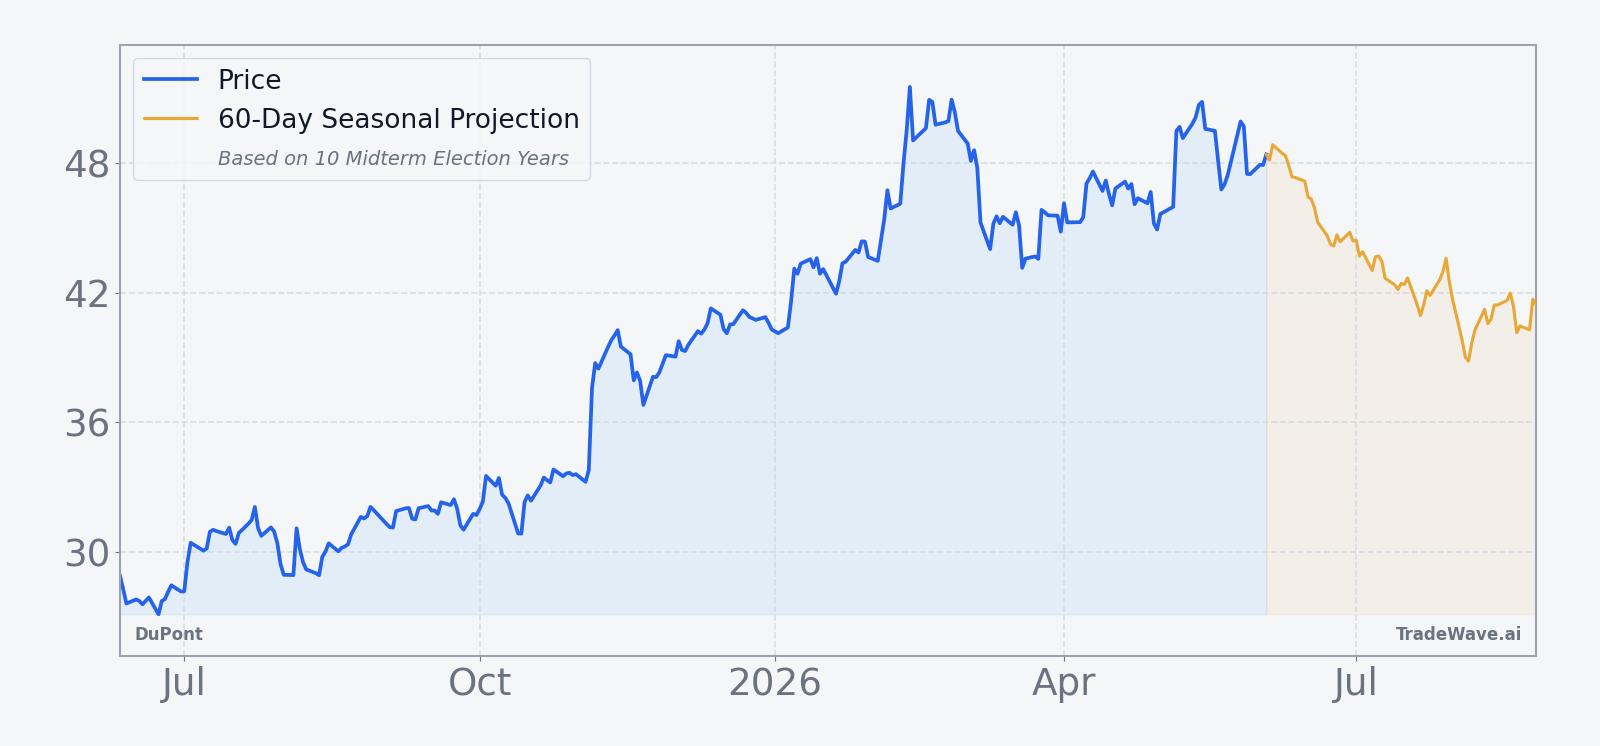
The chart below situates the latest pullback against DuPont’s past year of trading and a 60-day seasonal projection.
From a broader sector standpoint, DuPont sits at the intersection of materials and specialty chemicals, with exposure to healthcare, water and industrial demand that can be sensitive to both interest rates and capital spending cycles.[5] In the wake of the Qnity separation, some strategists have argued that the remaining company should trade closer to pure-play peers, which could amplify moves around macro data and policy headlines as investors recalibrate valuation multiples.[5][10]
What should traders watch in this DuPont seasonal window?
The immediate focus is timing. The 37-day midterm-year window opens on Jun 11, so any sharp move in DuPont around that date will be viewed against a backdrop where the stock has historically drifted lower through late July. Traders will be watching whether the stock stalls again near the low $50s, which has marked the 52-week high area, or whether it can break through that band despite the bearish seasonal tendency.
Macro and policy catalysts also matter. Midterm years often bring noisy debates over spending and regulation, and DuPont’s exposure to infrastructure, building and healthcare means headlines on fiscal priorities or environmental rules can quickly feed into earnings expectations.[4][5][10] Any sign that capital spending or construction demand is slowing into the second half of the year would rhyme with the historical pattern of weakness in this window.
On the company side, investors will track how quickly the new $275 million buyback is deployed and whether management offers any mid-quarter color on orders or pricing after the May guidance raise.[3] Aggressive repurchases or upbeat commentary could blunt the typical seasonal pressure, while a more cautious tone would fit the historical script of midyear softness.
Finally, behavior inside the window will be key. If DuPont rallies sharply into late June and early July and holds those gains, that would mark a clear break from the last ten midterm-year patterns. If instead the stock sees early strength followed by a rollover into the back half of the window, especially on rising volume, it would look much more like prior cycles where shorts ultimately prevailed despite sizable intraperiod swings. Either way, the combination of a 10-for-10 historical record and a stock trading well below its 52-week high makes this a calendar stretch worth watching closely.
Sources
- [1] GuruFocus – DuPont (DD) Boosts Healthcare Manufacturing in Costa Rica (Jun 5, 2025).
- [2] CNBC – DuPont’s stock surge to 52-week highs takes a pause (Nov 6, 2025).
- [3] The Wall Street Journal – DuPont Lifts Outlook, Plans $275 Million Buyback (May 5, 2026).
- [4] The Wall Street Journal – DuPont de Nemours Adjusts 2025 Outlook Following Sales Gains (Aug 5, 2025).
- [5] CNBC – DuPont prepares to say goodbye to electronics (Oct 15, 2025).
- [6] CNBC – Why DuPont’s electronics business Qnity has the most post-split potential (Oct 13, 2025).
- [10] CNBC – Sector and valuation context for DuPont after Qnity spinoff (Oct 15, 2025).
About this seasonal analysis
Seasonal pattern data is sourced from TradeWave.ai, which analyzes historical price behavior across annual calendar windows going back up to 30 years. Read the full data methodology or the book The 100-Year Pattern by Afshin Moshrefi (2026 edition). Past performance of seasonal patterns does not guarantee future results. This article is for informational purposes only and does not constitute investment advice.