14-of-15 Win Streak: Alphabet Inc. (Class A) (GOOGL) Nears a Bullish 32-Day June Run
Alphabet Inc. (Class A) is trading just under record territory as it approaches a 32-day June seasonal window that has historically skewed bullish and added fuel to Big Tech momentum.

What is the seasonal pattern for Alphabet Inc. (Class A) (GOOGL)?
Alphabet Inc. (Class A) has risen in 14 of 15 years during this mid-June 32-day window, with an average gain of 4.45% in winning years.
- 14-for-15 record in this window, with winning years averaging 4.45% gains and only one small losing year.
- The upcoming 32-day trading window starts Jun 12, 2026 and has been a historically bullish GOOGL seasonal trend.
- Percent Profitable sits at 93%, with 14 winners and 1 loser across the 15-year lookback.
- Avg Profit - All, which includes the lone down year, is still a strong 4%, pointing to a consistently positive stock pattern analysis.
- Intraperiod swings have been meaningful, with several years showing double-digit peak run-ups and notable drawdowns before finishing higher.
- Add it up: an 82% cumulative return across these mid-June Alphabet Inc. (Class A) trading windows over the past decade and a half.
According to historical data from TradeWave.ai, this specific mid-June stretch has behaved very differently from an average month on the calendar for GOOGL, and the next iteration is only weeks away.
How has Alphabet Inc. (Class A) (GOOGL) traded in this June–July seasonal window?
Alphabet Inc. (Class A) has risen in 14 of the past 15 years during the 32 trading days starting Jun 12, averaging 4.45% gains in winning years. Today the stock closed at $388.91, up 0.3% on the session and about 4.8% below its 52-week high of $408.61, leaving it near the top of its recent range.[5]
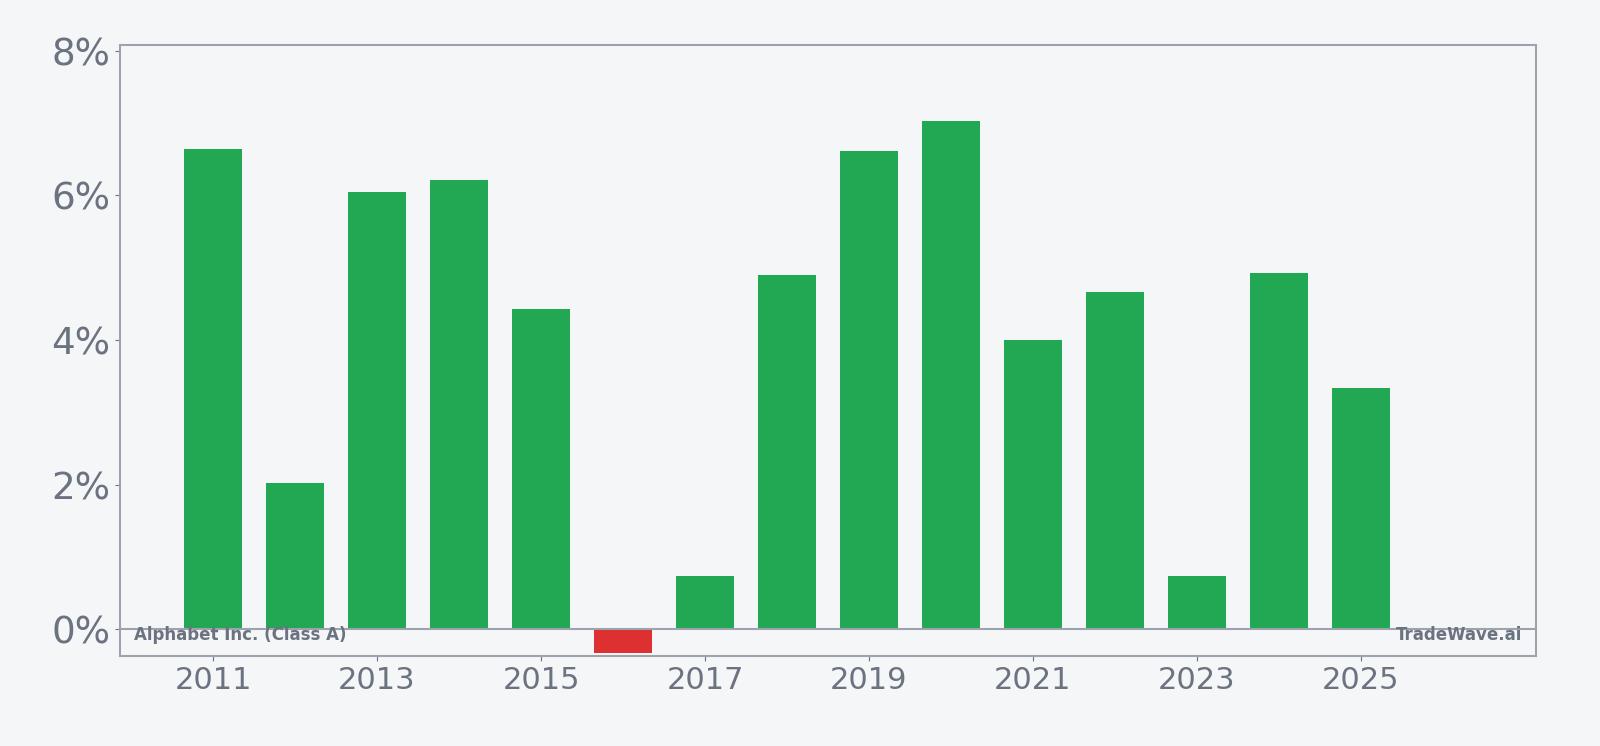
For this long trade direction, positive years are the ones where GOOGL finished the window higher, and those have dominated the sample. The lone losing year, 2016, saw only a 0.33% decline, while strong years such as 2019, 2020, 2022 and 2024 posted net gains between roughly 4.9% and 7.0% over the 32 trading days. Even when including that small down year, the all-years average return clocks in at 4%, which is unusually high for a one-and-a-half month slice of the calendar.
The intraperiod path has not been a straight line. In 2020, for example, the best point-to-peak move inside the window reached 11.57% before settling at a 7.03% net gain, while the worst drawdown from entry was 4.34%. In 2022, the maximum favorable move hit 12.49% with only a 1.27% worst pullback, a profile that shows how some years delivered strong upside with relatively contained downside. Other years, such as 2016 and 2025, saw deeper adverse excursions of roughly 8% and 7.8% respectively before finishing near flat or modestly higher.
Across the 15-year history, the typical pattern shows gains building steadily rather than in a single burst. The median profit of 4.66% sits close to the average, which suggests the window has not been skewed by just one or two outlier years. The annualized return of 4.1% for this specific slice of the calendar, combined with a Sharpe ratio of 1.6, points to a historically favorable risk-adjusted profile for long exposure during this period.
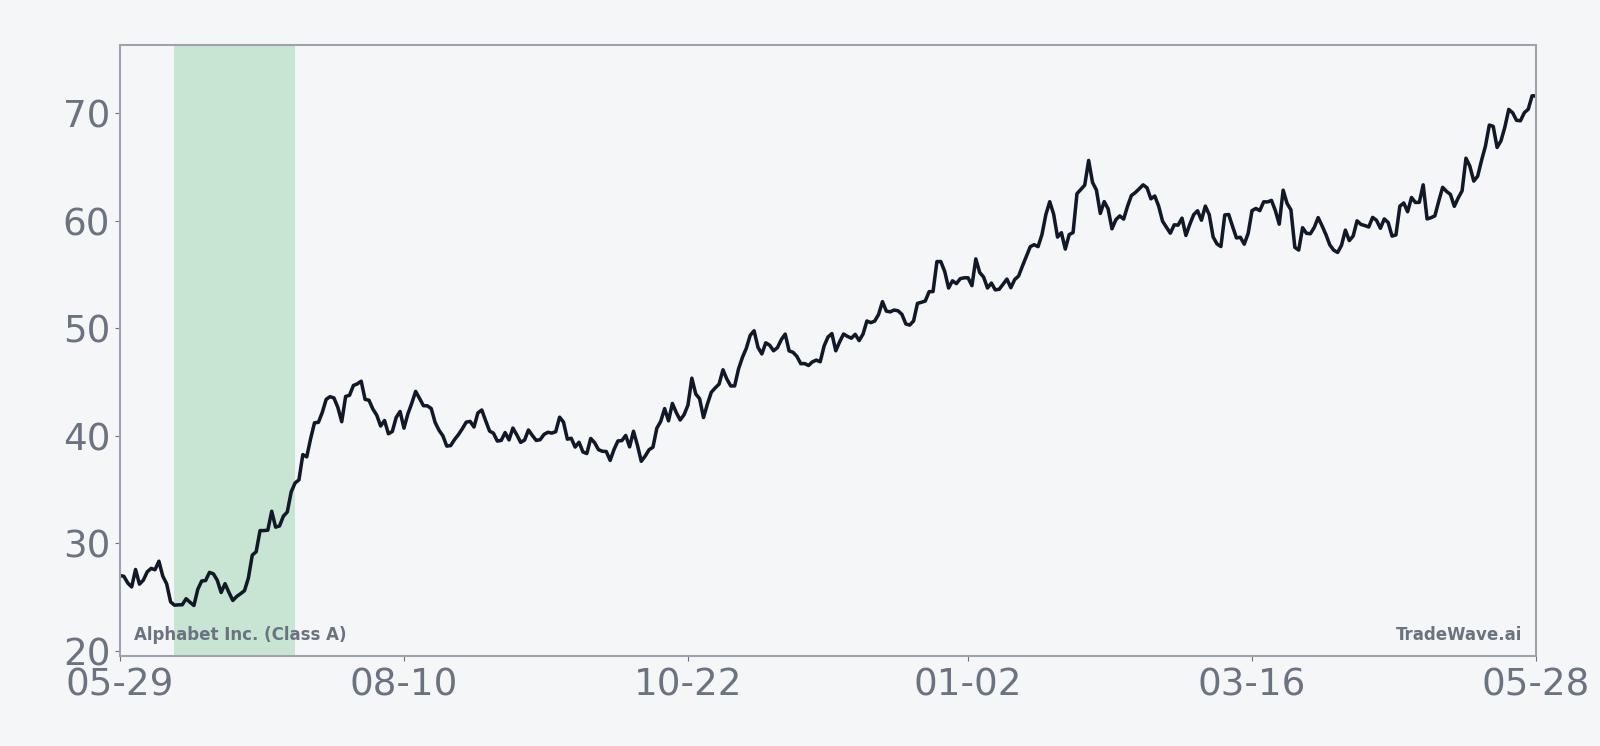
The historical seasonal average trend line slopes higher through most of the window, with gains tending to accumulate rather than mean-revert. Early days often see a modest pickup, followed by a stronger push in the middle of the period and a tendency to consolidate into the close of the window. That shape fits a pattern where buyers lean in as the quarter progresses, then lock in some profits toward the end.
A stacked view of yearly net returns alongside peak run-ups and worst drawdowns shows how much room GOOGL has historically had to move inside this window.
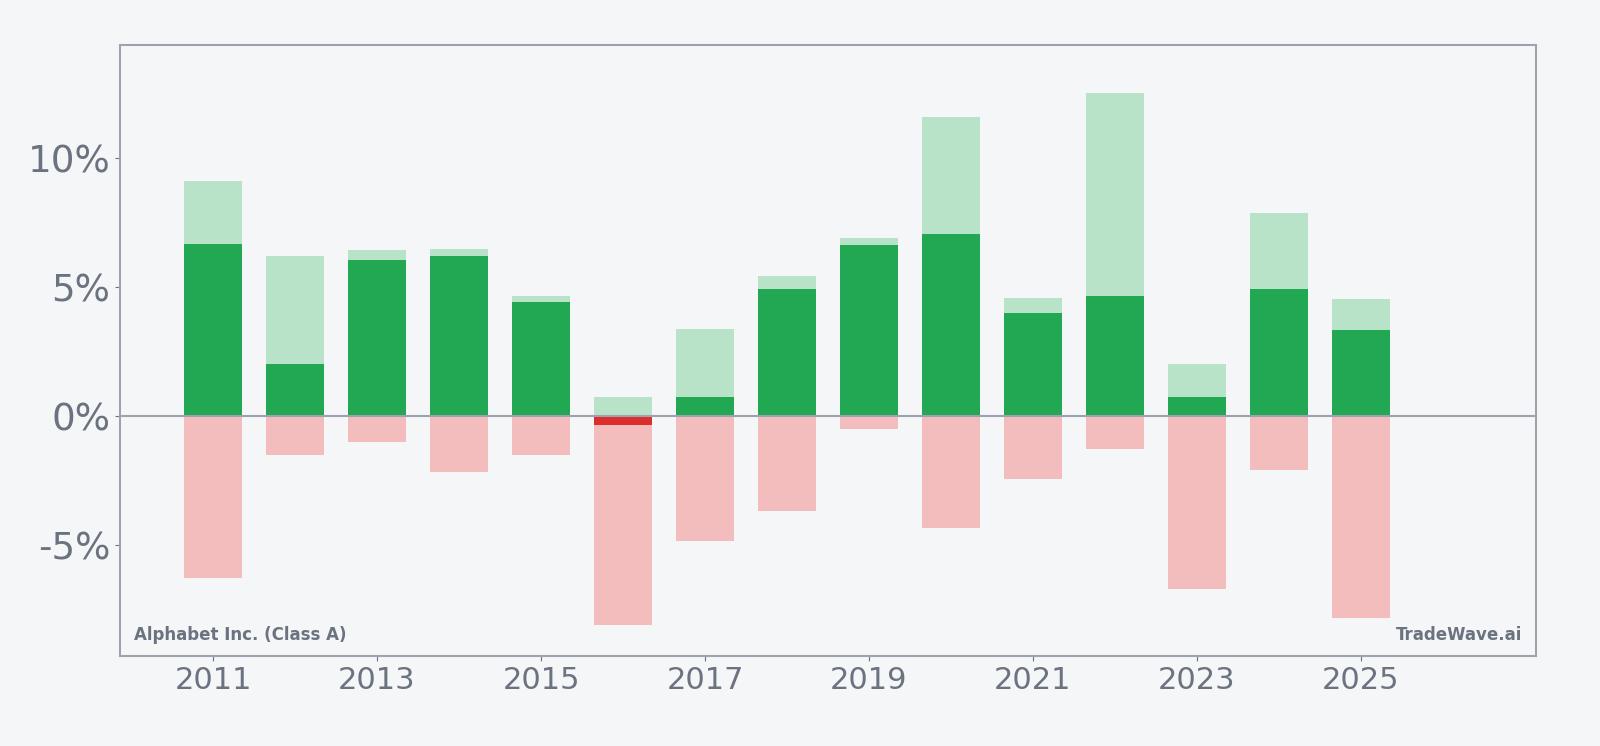
The stacked net, peak run-up and worst drawdown bars underline a key point: even in winning years, GOOGL has often swung several percentage points in both directions before settling higher. Large maximum favorable excursions in 2020 and 2022 show how strong the upside can be when the pattern is working, while the deeper adverse moves in 2016, 2023 and 2025 remind traders that pullbacks of 6% to 8% inside the window have not been unusual. The pattern is clear: this window has favored longs in 14 of 15 years, but it has not been a low-volatility ride.
History does not guarantee future results; adverse excursions (MAE) can be large even in winning windows.
Why does Alphabet Inc. (Class A) (GOOGL) follow this seasonal pattern?
One likely driver is the way Alphabet’s earnings calendar and capital spending updates cluster around mid-year, which can focus investor attention on growth and AI infrastructure plans. Analysts have also pointed to institutional portfolio repositioning into large-cap tech as the second half approaches, especially when cloud and AI themes are in favor.[5] This mid-June window may reflect that combination of earnings follow-through, sector rotation into communication services and technology, and options-related positioning as quarterly expirations pass.
What is driving Alphabet Inc. (Class A) (GOOGL) today?
GOOGL finished Thursday at $388.91, up 0.3% on the day, with roughly 30.5 million shares changing hands versus a 20-day average volume of about 28.8 million.[5] The stock sits about 4.8% below its 52-week high of $408.61 and well above its 50-day moving average near $337.97, underscoring how strong the recent uptrend has been.[5] That strength has been fueled in part by a powerful run in AI-related names and accelerating demand for cloud and AI infrastructure across Big Tech.[3]
In Feb 2026, Alphabet reported Q4 2025 results that showed revenue of $113.8 billion versus estimates of $111.4 billion and earnings per share of $2.82 versus $2.63 expected, with net income up 30% year over year.[5][7] Google Cloud revenue jumped to $17.7 billion, up 48% year over year, reinforcing the narrative that Alphabet is one of the key beneficiaries of AI-driven workloads and enterprise digital transformation.[5] Management also raised 2025 capital expenditure guidance to $85 billion and signaled that capex could nearly double in 2026, a sign of aggressive investment in data centers, custom chips and network capacity to support AI services.[5]
Those spending plans have helped anchor the broader sector story around “Cloud and AI infrastructure,” where investors have been willing to pay up for scale players that can monetize AI demand across search, productivity tools and cloud platforms.[5] At the same time, the lack of a fresh earnings date on the calendar means the next major fundamental catalyst is still to be set, leaving technicals, macro AI sentiment and this upcoming seasonal window to do more of the near-term heavy lifting.
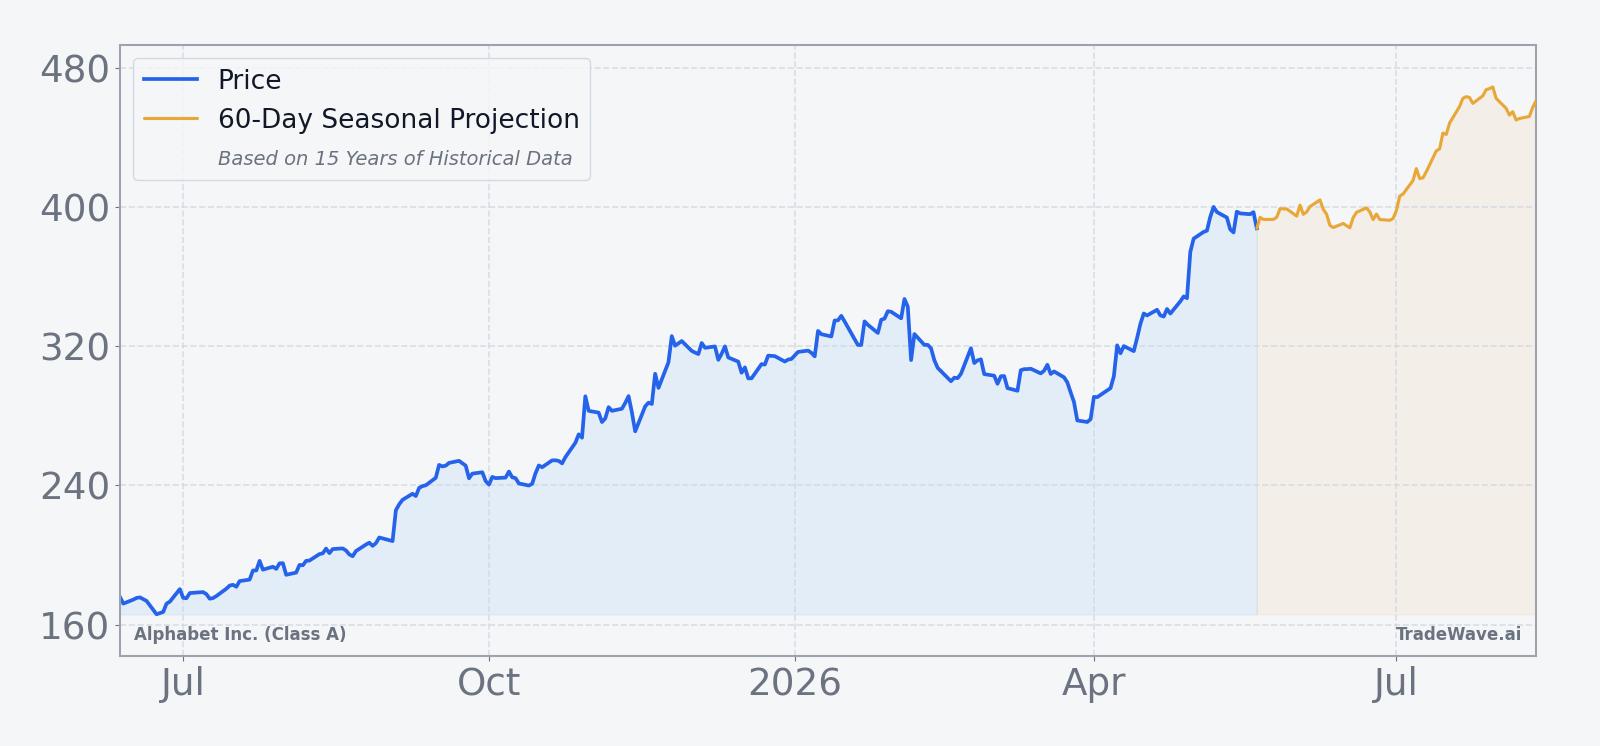
The chart below situates the latest move in its recent multi-month context and overlays the next 60 days of the historical seasonal projection.
How do AI momentum and valuation frame this GOOGL seasonal setup?
Alphabet sits at the center of the market’s AI momentum trade, alongside other mega-cap platforms that are pouring capital into cloud and model infrastructure.[3][5] Strong Google Cloud growth and rising capex have reinforced the idea that Alphabet is not just a search and ads story but also a core infrastructure provider for AI workloads.[5] That backdrop has supported premium valuations across the group, even as investors debate how quickly AI investments will translate into durable free cash flow.
While specific valuation multiples are not detailed in the available data, the combination of double-digit revenue growth, 30% net income expansion and a 48% surge in cloud revenue in Q4 2025 has kept Alphabet in the “growth at scale” bucket rather than a mature, low-growth tech name.[5][7] For traders watching the upcoming June seasonal window, that matters because historically strong windows can attract more attention when they line up with a powerful fundamental story and a stock already trading near its highs.
What should traders watch as the GOOGL seasonal window opens?
The mid-June seasonal window for Alphabet Inc. (Class A) begins on Jun 12 and runs for 32 trading days, overlapping the heart of the summer for U.S. markets. The historical record is striking: 14 winners, 1 loser, roughly 4% average gains across all years and several instances of double-digit peak rallies inside the window. At the same time, intraperiod drawdowns of 6% to 8% have been common in some years, so the path has often been choppy even when the destination was higher.
Into this year’s iteration, traders will be watching a few key items. First, whether GOOGL can hold above its 50-day moving average and push back toward the $408.61 52-week high as the window opens, or whether early selling pressure produces one of the deeper drawdowns that have occasionally marked this period.[5] Second, any updates on AI product rollouts, cloud customer wins or capex plans that could refresh the growth narrative that powered the strong Q4 2025 print.[5][7] Third, broader AI and Big Tech sentiment, since Alphabet’s weight in major indices means sharp moves in this stock can ripple through sector ETFs and the wider market.
For traders who track historical seasonality, the confirmation signal would be a familiar one: GOOGL respecting support on pullbacks and grinding higher through the middle of the window, with rallies building on strong volume rather than fading quickly. A clear break of recent support levels accompanied by heavy selling would be the opposite pattern and would mark a rare year where this historically strong window fails to deliver. Either way, the next 32 trading days after Jun 12 will offer a clean test of whether one of GOOGL’s most reliable calendar patterns can keep working with the stock already near the top of its range.
Sources
About this seasonal analysis
Seasonal pattern data is sourced from TradeWave.ai, which analyzes historical price behavior across annual calendar windows going back up to 30 years. Read the full data methodology or the book The 100-Year Pattern by Afshin Moshrefi (2026 edition). Past performance of seasonal patterns does not guarantee future results. This article is for informational purposes only and does not constitute investment advice.