Advanced Micro Devices (AMD) Options Price Big Swings Into One of Its Weakest 21-Day Runs
Advanced Micro Devices is entering a historically bearish 21-day midterm-election-year window just as its stock trades near record highs after a powerful post-earnings surge.

What is the seasonal pattern for Advanced Micro Devices (AMD)?
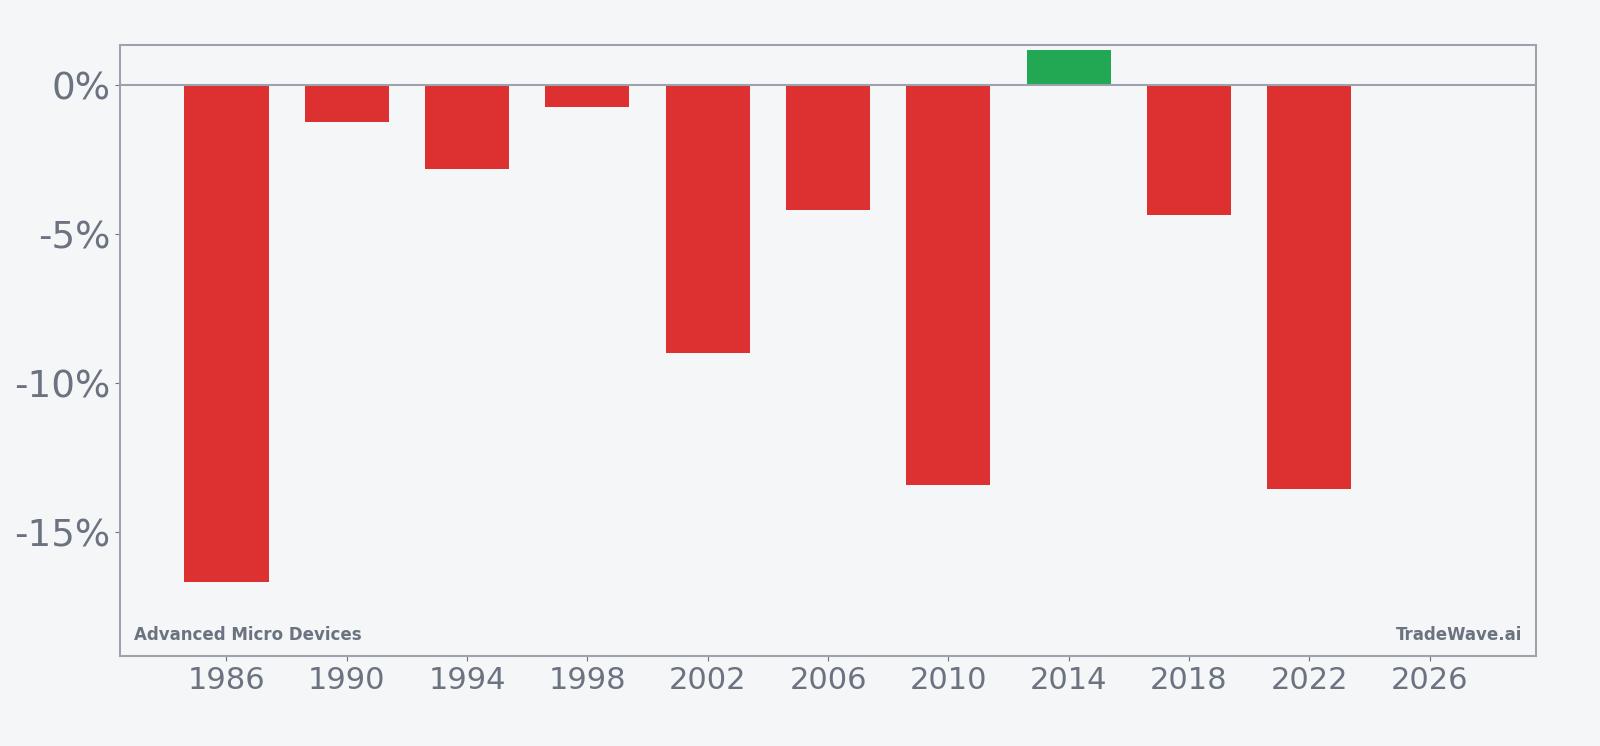
Advanced Micro Devices has fallen in 9 of 10 midterm-election-year windows during this 21-day stretch, with an average gain of 7.33% in winning short years.
- 9 for 10 in this window for short trades, with winning years averaging 7.33% moves in AMD’s favor.
- The 21-day window begins Jun 12 and is grouped across the last 10 midterm election years, not consecutive calendar years.
- Percent Profitable is 90%, with 9 winners and 1 loser for the short-side pattern.
- Including all years, the average outcome is a 6% move in the trade direction, showing the AMD seasonal trend has been consistently bearish in this slice.
- Individual years have seen maximum adverse moves near 20% against the short, so intraperiod drawdowns can be sharp even when the final result is profitable.
- The TradeWave Ratio of 2.32 signals that price has typically traveled meaningfully in the short direction within the window, independent of the final close.
According to historical data from TradeWave.ai, this midterm-election-year stretch has behaved very differently from an average month for AMD, and the next 21 days line up with one of its most consistent calendar patterns.
How has Advanced Micro Devices (AMD) traded in this midterm-year June window?
Advanced Micro Devices has delivered profitable short setups in 9 of the last 10 midterm-election-year windows starting on Jun 12, with winning years averaging a 7.33% move in the trade direction. The latest iteration begins today with AMD at $488.45, up 8.0% on the session and sitting about 10.6% below its 52-week high of $546.44.[13] Weekly options ahead of AMD’s May earnings were priced for nearly a 9% post-report swing, underscoring how traders have been bracing for outsized moves around this period.[6]
Because this pattern is grouped by the presidential election cycle, it only looks at midterm election years, which tend to feature heavier policy uncertainty and more tactical repositioning in high-beta tech. Pattern phase equals midterm election year, and the calendar is also in a midterm election year, so the historical sample lines up cleanly with today’s backdrop.
Across the 10 midterm-election-year samples, the short-side AMD seasonal trend has been striking. Percent Profitable sits at 90%, with 9 winners and just 1 losing year, and the all-years average outcome is a 6% move in favor of the short over the 21-day window. In winning years, the average profit of 7.33% shows that when the pattern works, it has tended to deliver more than a token drift lower.
The per-year table shows how that plays out in individual cycles. In 1986, the short trade captured a 16.67% net decline in AMD, with the worst intraperiod drawdown from entry, or maximum adverse excursion, reaching 19.79% before the stock rolled over. At the other end of the spectrum, 2014 was the lone losing year, with AMD rising 1.17% against the short even as the stock still saw a 9.09% adverse move at one point.
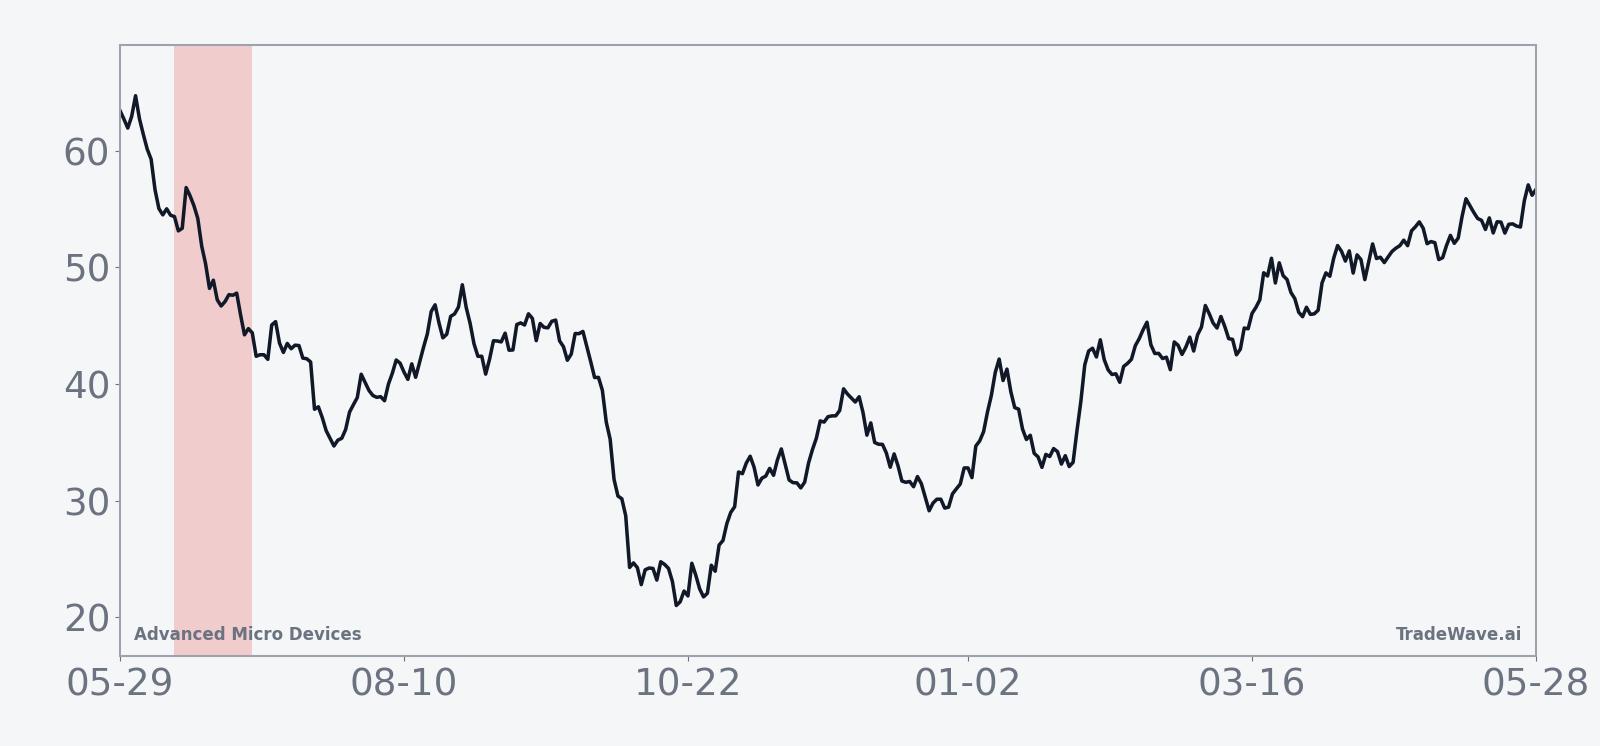
The historical seasonal average trend for this window slopes steadily in favor of the short, with much of the move typically accruing in the middle of the 21-day span rather than in a single gap. That profile suggests a tendency toward grinding weakness rather than one-off shock events, even though individual years have still seen sharp swings.
The combined net, peak favorable, and worst adverse moves by year show how much AMD has tended to travel inside the window before settling at its final result.
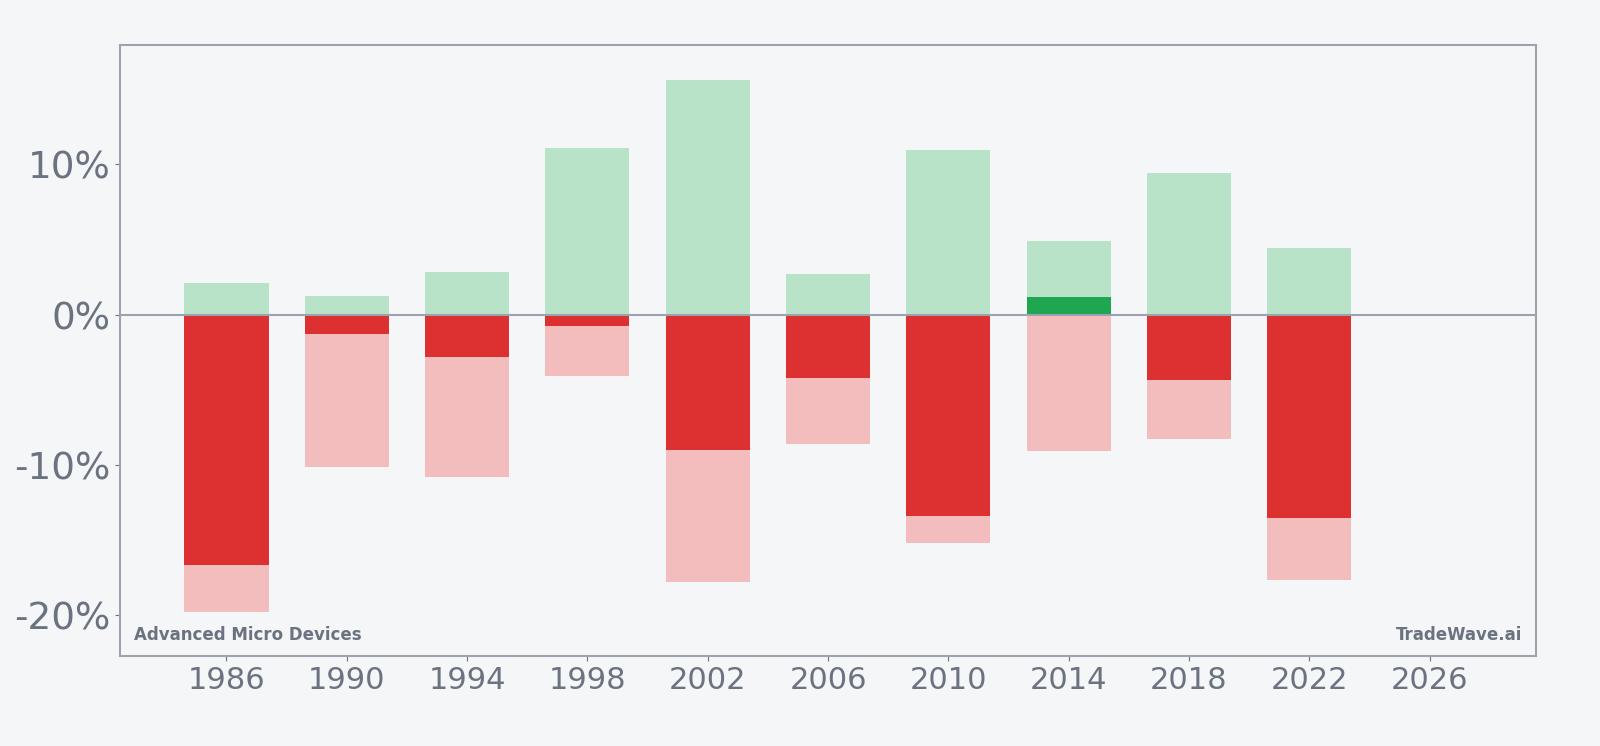
The stacked net, maximum favorable excursion and maximum adverse excursion bars underline how volatile this AMD trading window can be. Several years, including 2002 and 2022, show double-digit favorable moves for the short alongside adverse swings of more than 15%, meaning traders who were ultimately right still had to sit through sizable rallies against them. That mix of strong follow-through and deep countertrend spikes is consistent with a TradeWave Ratio of 2.32 and a Sharpe ratio of 1.0, pointing to a window where the direction has been reliable but the path has been bumpy.
History does not guarantee future results; adverse excursions (MAE) can be large even in winning windows.
Why does Advanced Micro Devices (AMD) follow this seasonal pattern?
This AMD seasonal pattern may reflect how institutional investors rebalance AI and semiconductor exposure in the middle of midterm election years, when policy risk and spending debates often peak. One likely driver is the clustering of earnings updates and product commentary around this part of the calendar, which can trigger profit-taking in high-flying chip names after strong first-half runs. Analysts have also pointed to sector rotation between growth and value as midyear macro data and rate expectations shift, leaving richly valued AI leaders more vulnerable during this specific stretch.
What is driving Advanced Micro Devices (AMD) today?
AMD jumped 7.97% on Friday to close at $488.45, extending a powerful post-earnings run that has left the stock less than $60 below its 52-week high of $546.44 and far above its 52-week low of $115.06.[13] The move builds on Q1 2026 results that showed revenue of $10.25 billion and net income up 95% year over year, driven by AI data-center demand and stronger margins in key segments.[7][13] Ahead of that report on May 5, weekly options were priced for roughly a 9% post-earnings swing, a sign that derivatives markets were braced for a big break in either direction.[6]
Those expectations were met when AMD shares surged as investors focused on accelerating AI GPU revenue and management’s guidance for Q2 2026 revenue around $11.2 billion plus or minus $300 million.[7][13] The company’s Instinct accelerator roadmap and commentary about demand from hyperscale cloud customers have reinforced the view that AMD is one of the core beneficiaries of the AI buildout, alongside other mega-cap chip names.[7] Sector-wide, AI and data-center demand remain the dominant themes, with analysts highlighting how GPU shortages and cloud capex plans continue to support elevated growth assumptions for leading semiconductor stocks.[7]
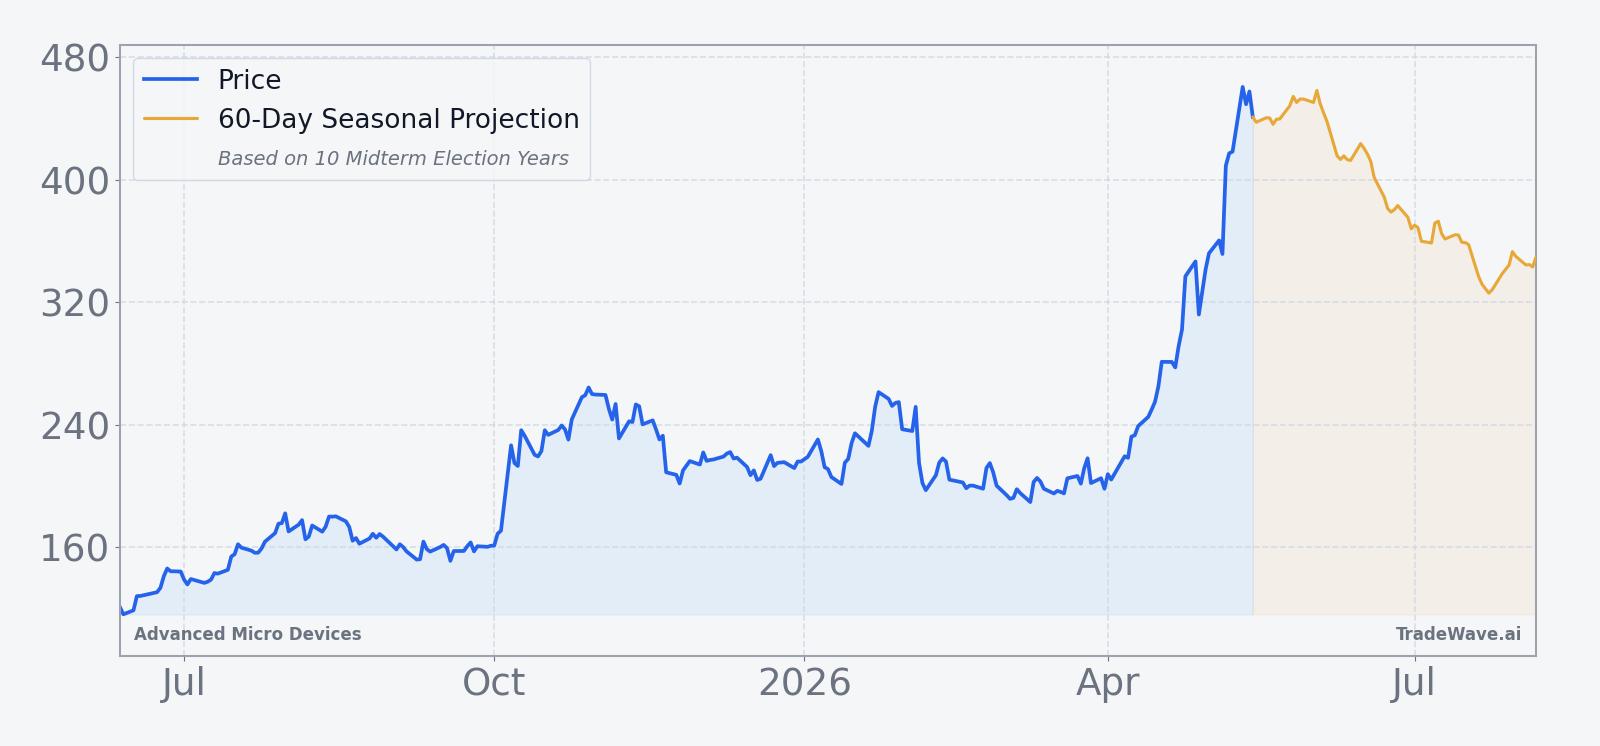
In this context, AMD’s role as a key driver of AI sentiment inside the S&P 500 makes the clash between its strong uptrend and a historically bearish midterm-year window more notable. The stock has already logged a 0.92% gain over the past month despite volatility, and it is trading well above its 50-day moving average of $375.05 on heavy volume of more than 30 million shares, close to its 20-day average.[13] For traders, that combination of stretched price, elevated expectations and a historically negative seasonal stretch sets up a clean test of whether the AI trade can overpower the usual midyear pattern.
The chart below situates the latest surge against AMD’s past year of trading and the 60-day seasonal projection.
What should traders watch in this AMD seasonal window?
First, watch how AMD behaves around the $500 area and the prior 52-week high of $546.44 as the 21-day window unfolds.[13] A pattern of lower highs and heavier intraday selling near those levels would be more consistent with the historical midterm-year tendency for the stock to drift lower in this stretch. Conversely, a clean breakout through the old high with strong follow-through would mark only the second losing year for the short-side pattern in the last 10 cycles.
Second, keep an eye on options pricing and volume as a real-time read on whether the May volatility premium persists.[6] If weekly options continue to imply large moves and realized swings stay elevated, that would fit the historical profile of big maximum favorable and adverse excursions inside the window. A sharp cooling in implied volatility, by contrast, would suggest traders are less worried about a midyear air pocket despite the seasonal backdrop.
Third, monitor AI and data-center headlines, including any updates on cloud capex plans or competitive GPU launches, since those have been the main macro drivers of AMD’s earnings story.[7][13] Negative surprises on deployment timing or pricing could align with the historical pattern of midyear weakness, while continued upside revisions would test how much weight the AMD seasonal trend still carries in a market dominated by AI enthusiasm.
Finally, remember that this window sits in the middle of the midterm election year, a phase that often features choppy trading as investors digest policy debates and fiscal negotiations. If AMD starts to show the kind of grinding, multi-week softness that has defined prior midterm-year windows, it would be a sign that the election-cycle playbook is still in force. If instead the stock shrugs off the pattern and powers higher, it would signal that the current AI-driven regime is strong enough to override one of its most reliable historical stretches.
Sources
- [1] Barchart.com, "Can AMD Stock Hit $210 In 2025? - Barchart.com", Jul 31, 2025
- [2] Yahoo Finance (Insider Monkey content), "AMD Reports August 5—Analyst Sees Q3 Upside and CPU Market Gains", Jul 31, 2025
- [3] The Motley Fool, "AMD Stock Slips Despite 30% Earnings Growth and Stronger-Than-Expected Guidance", Nov 4, 2025
- [5] Seeking Alpha, "AMD shares end in red after six straight days of gains", Jul 31, 2025
- [6] Seeking Alpha, "AMD options traders price ~9% post-earnings move", May 5, 2026
- [7] Barron's, "AMD Stock Soars on Strong Earnings and Growing Confidence About AI", May 5, 2026
- [9] Forbes, "Advanced Micro Devices Stock Could Make Quick Comeback", Jan 8, 2026
- [13] Yahoo Finance (GuruFocus content), "AMD Jumps on AI Surge, Profit Nearly Doubles", May 7, 2026
- [14] Yahoo Finance (GuruFocus content), "AMD Shares Rally on GPU Snapback Outlook", Jun 16, 2025
About this seasonal analysis
Seasonal pattern data is sourced from TradeWave.ai, which analyzes historical price behavior across annual calendar windows going back up to 30 years. Read the full data methodology or the book The 100-Year Pattern by Afshin Moshrefi (2026 edition). Past performance of seasonal patterns does not guarantee future results. This article is for informational purposes only and does not constitute investment advice.