10-for-10: Abbott Laboratories (ABT) Has Rallied Every Midterm Summer in This 59-Day Window
Abbott Laboratories is heading toward a midterm-year summer stretch that has never been negative in the last 10 cycles, even as the stock trades well below its 52-week high.
What is the seasonal pattern for Abbott Laboratories (ABT)?
Abbott Laboratories has risen in 10 of 10 midterm-year summer windows during this 59-day stretch, with an average gain of 6.1% in winning years.
- 10 for 10 in this window, with Abbott Laboratories averaging 6.1% gains across all winning years.
- The upcoming 59-day window starts on Jun 19, 2026 and covers the heart of the midterm-year summer.
- Percent Profitable is 100%, with 10 winners and 0 losers across the last 10 midterm election years.
- Median profit of 5.0% shows the typical outcome has been a solid single-digit gain rather than a one-off outlier.
- Intraperiod swings have been meaningful, with past years showing both double-digit run-ups and notable drawdowns before finishing higher.
- The pattern aligns with a long trade direction, reinforcing a historically bullish seasonal outlook for ABT in this specific election-cycle slice.
According to historical data from TradeWave.ai, this midterm-year summer stretch has behaved very differently from an average month on the calendar for Abbott Laboratories, and the next iteration is just days away.
How has Abbott Laboratories (ABT) traded in past midterm-year summer windows?
Abbott Laboratories has risen in every one of the last 10 midterm election years during the 59 trading days starting Jun 19, posting an average gain of 6.1% and a cumulative 79% across those cycles. Today the stock closed at 89.17, down 2.3% on the session and about 33.2% below its 52-week high of 133.55, even after a 17% gain year-to-date.[4]
Grouping the data by the presidential election cycle matters here because this window sits in the midterm election year, a phase that often brings policy noise, tariff headlines and sector rotation in healthcare. For a diversified medical devices and diagnostics name like Abbott, that mix has historically lined up with a constructive summer pattern even when the broader tape was choppy.
The Trade Direction for this pattern is long, and the track record is unusually clean. Percent Profitable is 100%, with 10 winners and 0 losers, so every midterm-year sample in this window finished higher than it started. Average profit across those winners is 6.1%, while the median outcome of 5.0% shows that gains have been fairly consistent rather than driven by a single blockbuster year.
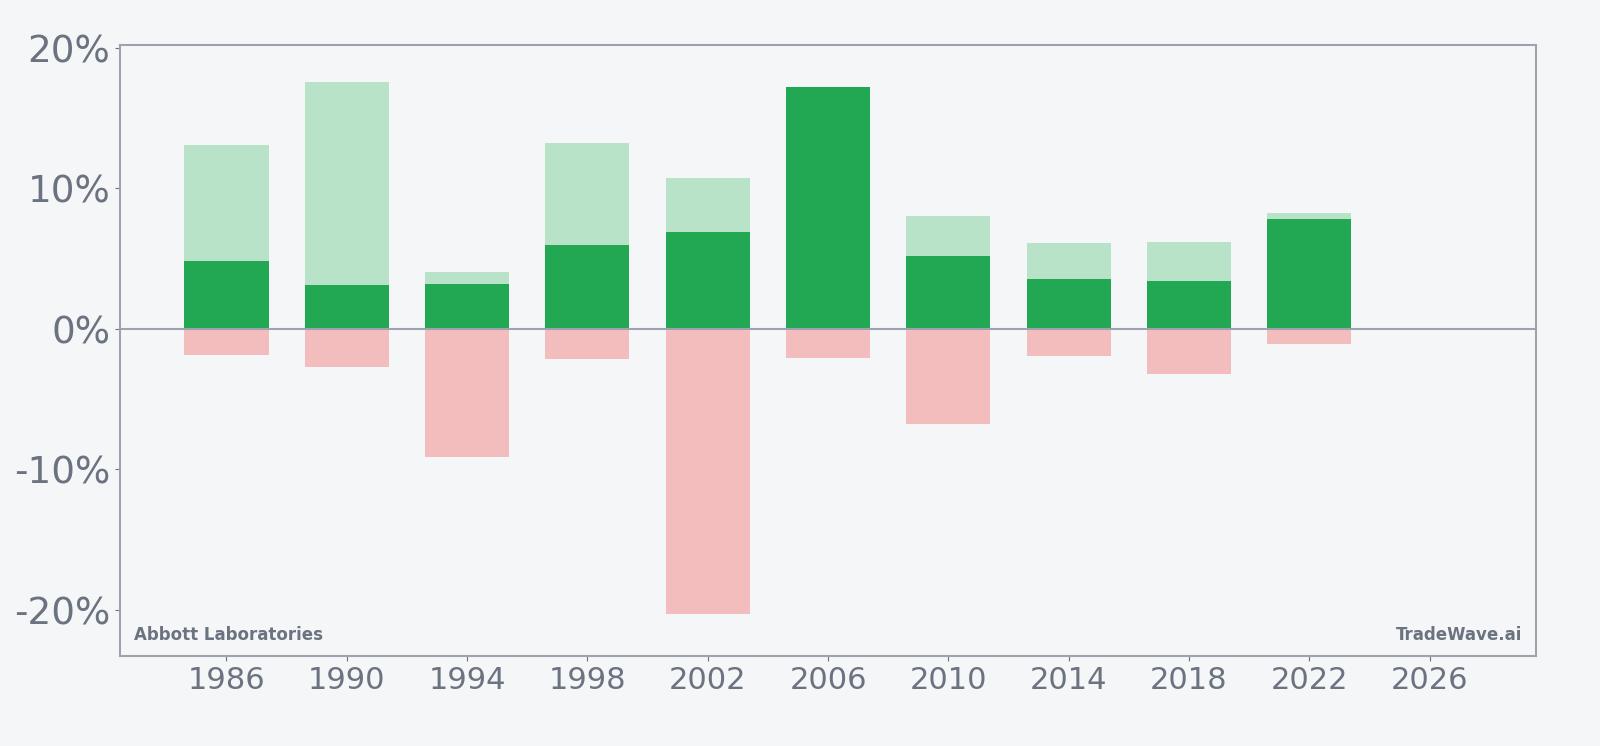
Individual years show a range of outcomes but all in the same direction. The strongest midterm sample was 2006, when ABT gained 17.22% over the window, while the softest was 1990 with a still-positive 3.09% move. Even in tougher macro backdrops like 2002, the stock finished the window up 6.85%, underscoring how persistent this ABT seasonal trend has been in midterm summers.
Intraperiod swings have been real, which matters for anyone trying to sit through the full 59 days. In 2002, for example, the stock’s best point-to-peak move within the window reached 10.75%, but the worst drawdown from entry hit -20.3% before the trade recovered to finish positive. Other years, such as 1994, also saw adverse moves near -9.2% even though the final result was a 3.19% gain.
Across the full sample, the pattern’s Sharpe ratio of 1.29 points to a solid risk-adjusted profile based on end-of-window outcomes, not just raw returns. The TradeWave Ratio of 2.08 captures how far price typically travels in the trade direction within the window, independent of the final close, and reinforces that the upside path has often been meaningfully larger than the simple close-to-close gain.
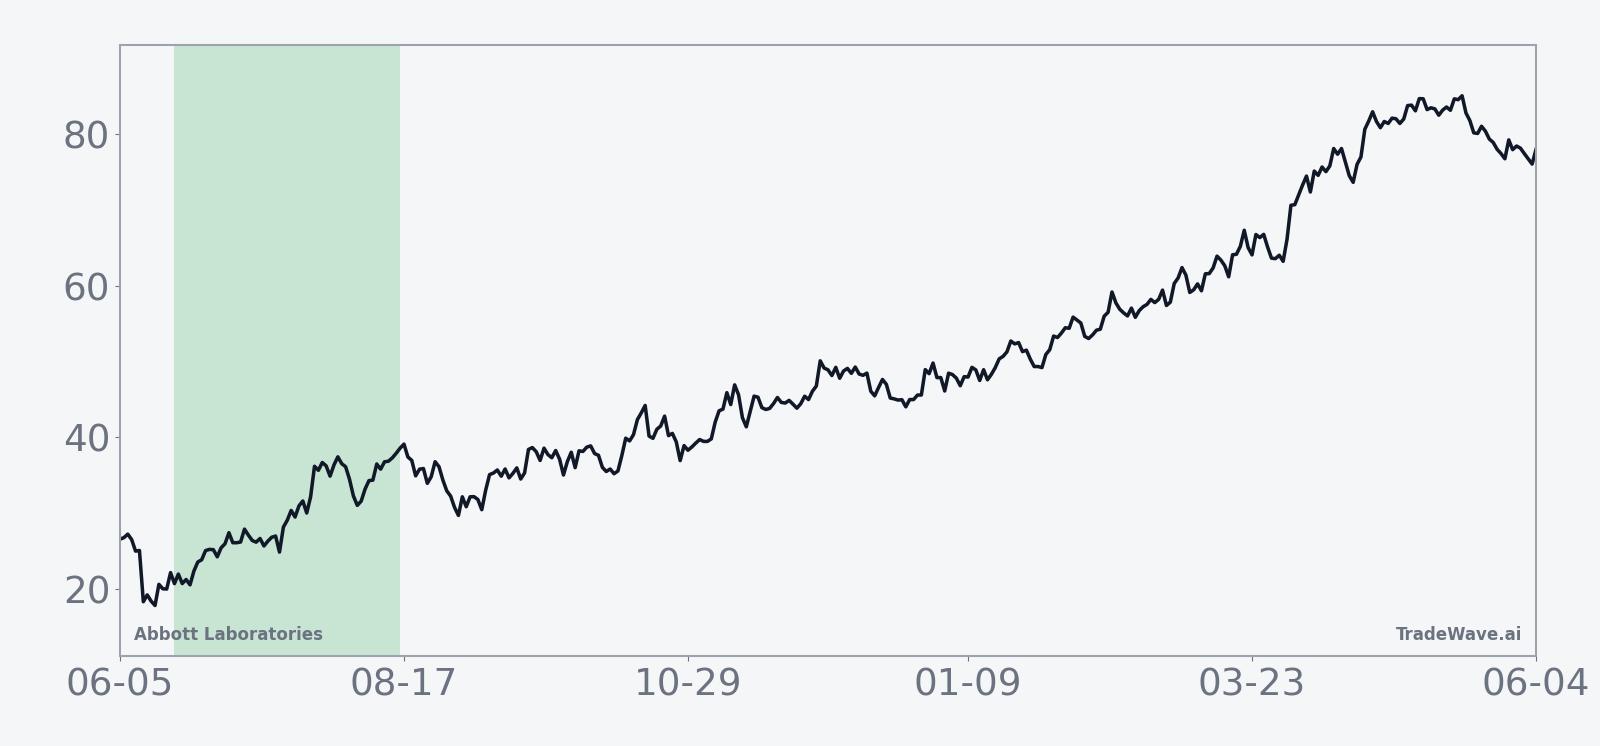
The historical seasonal trend chart for this window shows a fairly steady upward slope rather than a single burst. Gains tend to build gradually, with some years front-loading strength in the first few weeks and others grinding higher into the back half, but there is no clear pattern of early spike followed by fade. For a long setup, that kind of “climb the wall” behavior can be easier to hold than a one-shot pop.
The cumulative return profile across the last 10 midterm election years also leans in the same direction. When you stack each of those 59-day windows on top of one another, the line trends higher with only modest pauses, reflecting the 79% cumulative gain across the sample. Add it up: 10 for 10 positive outcomes and a smooth cumulative curve is a rare combination for a single-stock seasonal window.
A second view of yearly net, best-case and worst-case moves shows how upside and drawdowns have coexisted inside this bullish window.
History does not guarantee future results; adverse excursions can be large even in winning windows, and past 100% hit rates can always break.
Why does Abbott Laboratories (ABT) follow this seasonal pattern?
One likely driver is the way healthcare and medical device stocks trade around the midyear policy and reimbursement calendar, which often clusters regulatory updates and tariff headlines in the midterm election year.[6] Analysts have also pointed to institutional portfolio repositioning around midyear, as investors rebalance into defensive growth names like Abbott when macro uncertainty rises. This pattern may reflect that combination of policy noise, sector rotation and steady demand for diabetes and diagnostics products that tends to favor Abbott in early summer midterm windows.[13]
What is driving Abbott Laboratories (ABT) today?
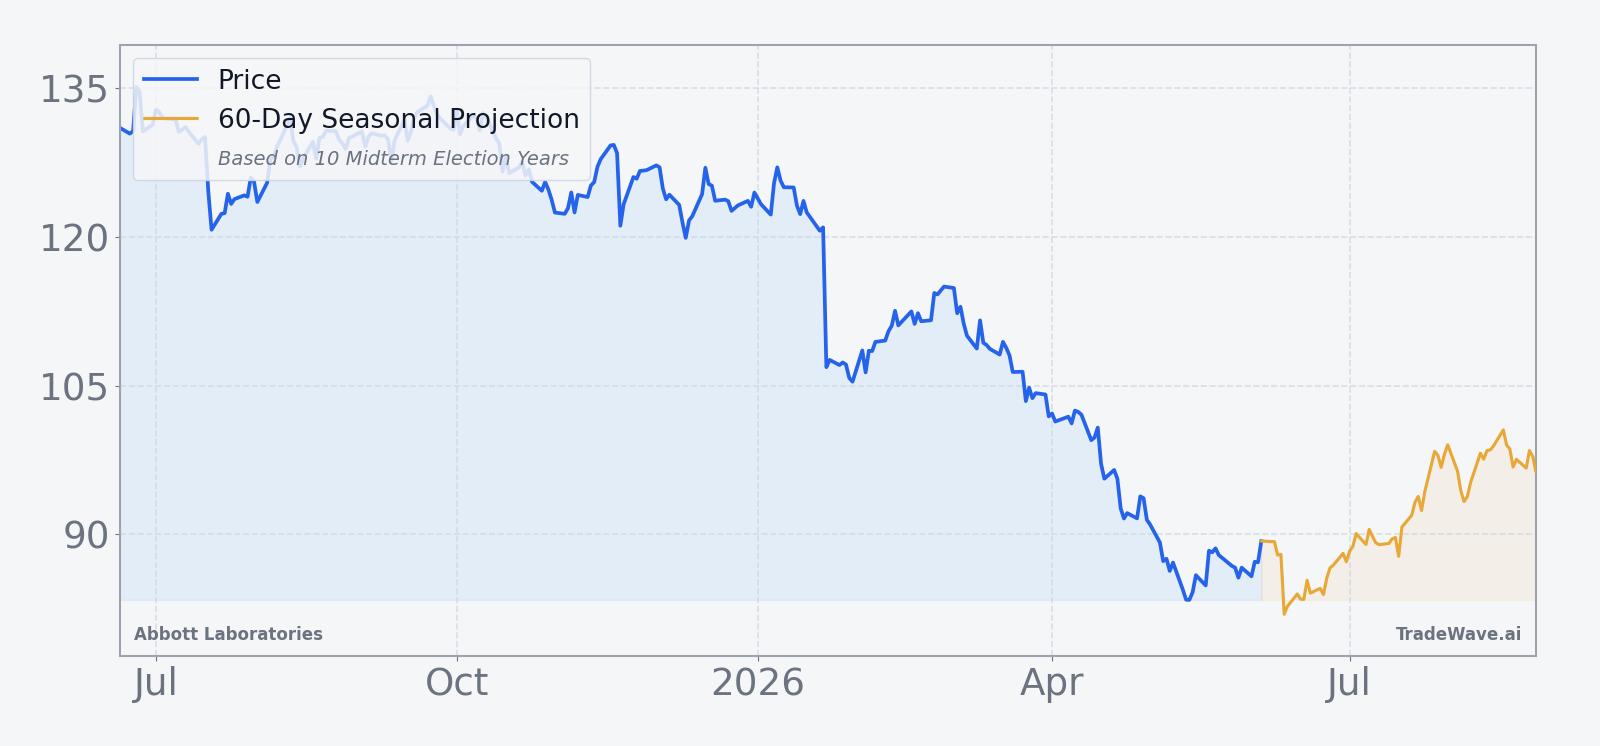
Abbott closed Thursday at 89.17, down 2.3% on the day, leaving the stock about 33.2% below its 52-week high of 133.55 and roughly 8.8% above its 52-week low of 81.97.[4] That pullback comes after a 17% year-to-date climb, a reminder that the name has already staged a sizable recovery even as it trades at a discount to last year’s highs.[4]
Recent fundamental drivers sit in the background rather than the headlines. In July 2025, Abbott reported second-quarter revenue of $11.14 billion, slightly ahead of LSEG estimates, with adjusted EPS of $1.26 topping the $1.25 consensus, helped by strong demand for medical devices.[1] The same day, management guided third-quarter profit to $1.28 to $1.32 per share, below the $1.34 analysts were looking for, and flagged that tariffs tied to U.S. trade policy could cost a few hundred million dollars annually while the company ramps U.S. manufacturing, including a planned Georgia facility by 2028.[2][6]
Sector-wise, Abbott remains tied to the medical devices and diabetes care story. In July 2025, Reuters reported that sales of its continuous glucose monitoring devices jumped 21.4% to $1.9 billion in the second quarter, underscoring how rising diabetes awareness and broader insurance coverage have been tailwinds for the group.[13] Later that year, another Reuters piece noted that while diagnostics and nutrition were softer, medical devices continued to lift overall revenue and the company nudged its annual adjusted profit range higher.[4]
The chart below situates the latest move in its recent multi-month context and overlays the upcoming 59-day seasonal projection.
What should traders watch as this seasonal window approaches?
The next iteration of this 59-day window begins on Jun 19, so the near-term focus is whether ABT stabilizes above the recent low near 88.69 or retests the 52-week floor around 81.97 before the pattern kicks in.[4] Historically, the strongest years have seen the stock hold its footing early in the window and then grind higher, while the more volatile samples featured sharp drawdowns that still resolved into gains by day 59.
On the fundamental side, traders will be watching for any updates on tariff exposure, U.S. manufacturing build-out and the growth trajectory of continuous glucose monitors, since those themes framed the last major earnings reset in July 2025.[2][6][13] Price action that respects support and responds positively to constructive news during the window would line up with the historical seasonality; a decisive break of the low-80s range or sustained selling through the window would be a clear departure from the 10-for-10 record.
Finally, intraday volatility will matter as much as closing prices. Past windows have featured double-digit maximum favorable moves alongside sizable adverse excursions, so traders may want to track how deep any pullbacks run relative to prior years’ worst drawdowns. If ABT sells off sharply early in the window but then recovers in line with the historical pattern, that would fit the established script; if downside pressure persists without the usual rebound, it would signal that this midterm-year summer is breaking from the long-running seasonal playbook.
Sources
- [1] Reuters, "Abbott beats quarterly profit estimates on medical devices demand," Jul 17, 2025.
- [2] Reuters, "Abbott beats profit estimates on medical devices demand, shares fall on forecast," Jul 17, 2025.
- [3] Reuters, "Abbott beats estimates on medical devices demand as forecast hits shares," Jul 17, 2025.
- [4] Reuters, "Abbott revenue misses as diagnostics, nutrition weakness clouds medical devices lift," Oct 15, 2025.
- [6] Reuters, "Abbott profit forecast falls short, ramps up US investing amid tariff pressure," Jul 17, 2025.
- [13] Reuters, "Abbott posts higher quarterly revenue on strong medical device demand," Oct 15, 2025.
About this seasonal analysis
Seasonal pattern data is sourced from TradeWave.ai, which analyzes historical price behavior across annual calendar windows going back up to 30 years. Read the full data methodology or the book The 100-Year Pattern by Afshin Moshrefi (2026 edition). Past performance of seasonal patterns does not guarantee future results. This article is for informational purposes only and does not constitute investment advice.