Kroger (KR) Has Risen in 9 of 10 Midterm Summers, Averaging 7.51% Gains in Winners
Kroger is heading toward a historically strong 52-day midterm-year seasonal window even as shares trade near record highs and value-focused shoppers keep fueling the core grocery business.

What is the seasonal pattern for Kroger (KR)?
Kroger has risen in 9 of 10 midterm-year summer windows during this 52-day stretch, with an average gain of 7.51% in winning years.
- 9 for 10 in this window, with winning years averaging 7.51% gains and only one losing instance across the sample.
- The 52-day window begins Jun 25 and covers the heart of the midterm-year summer, a period that has historically favored long positions in KR.
- Percent Profitable stands at 90%, with 9 winners and 1 loser across the last 10 midterm election years.
- Including down years, Avg Profit - All is still a solid 7%, showing the KR seasonal trend has been robust even after losses.
- Maximum favorable moves have often pushed into double digits, while adverse excursions have at times approached high single digits, underscoring real drawdown risk inside an otherwise bullish window.
According to historical data from TradeWave.ai, this midterm-year stretch has behaved very differently from an average summer for Kroger. The next section walks through how that pattern has played out and where the risks have clustered in prior cycles.
How has Kroger (KR) traded in this midterm-year summer window?
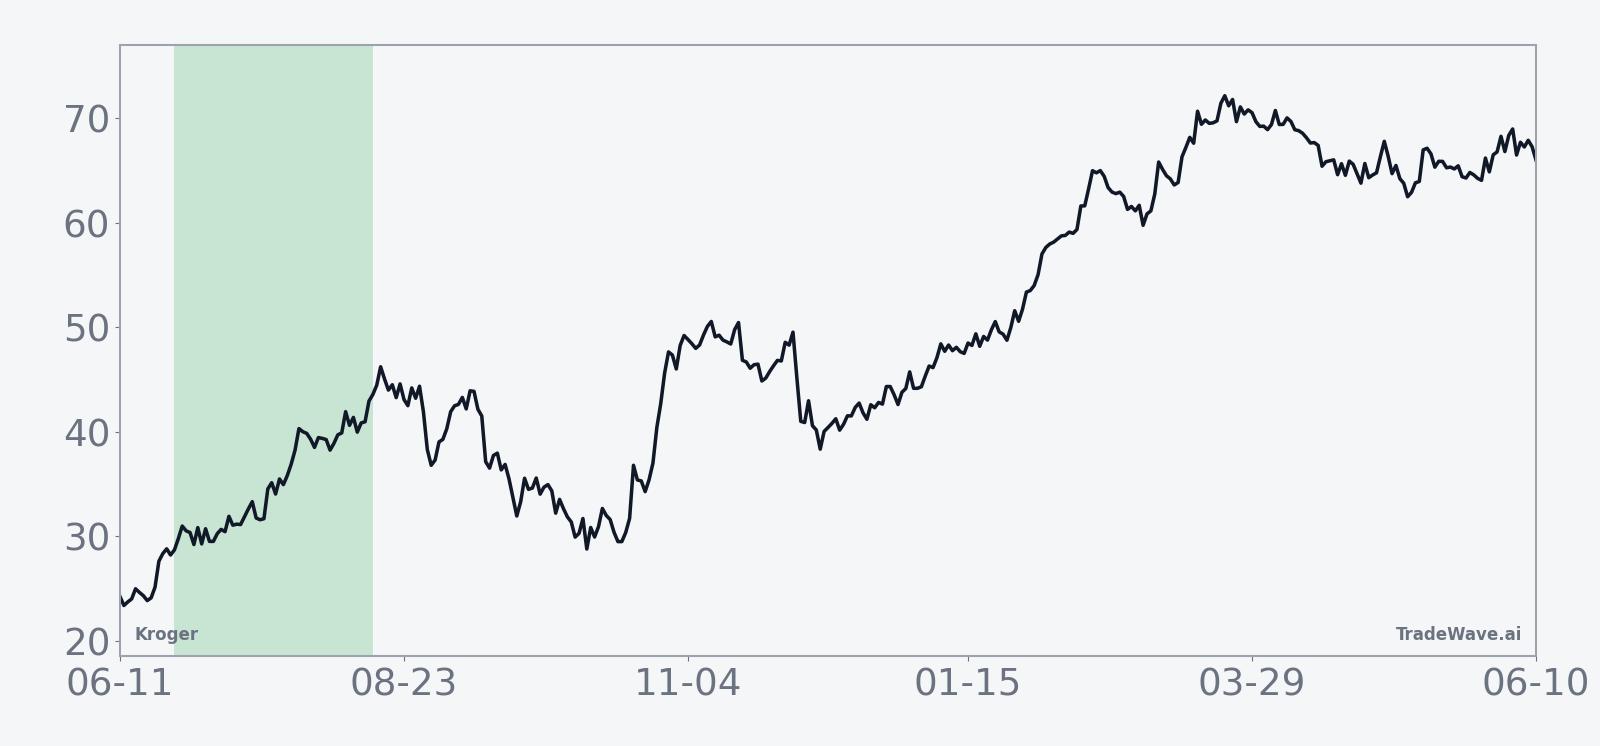
Kroger has risen in 9 of the last 10 midterm election years during this 52-day window, averaging 7.51% gains in winning years as the calendar flips into late June. Shares finished Wednesday at 64.65, up 2.6% on the day and up nearly 16% year to date, leaving the stock about 14.7% below its 52-week high and roughly 12.6% above its 52-week low.
The pattern is grouped by the presidential election cycle, focusing only on midterm election years rather than a simple run of calendar years. That matters for a defensive consumer name like Kroger because policy debates around fiscal tightening, regulation and household support often intensify in the middle of a presidential term, shaping how value-focused shoppers behave and how investors price grocery stocks.
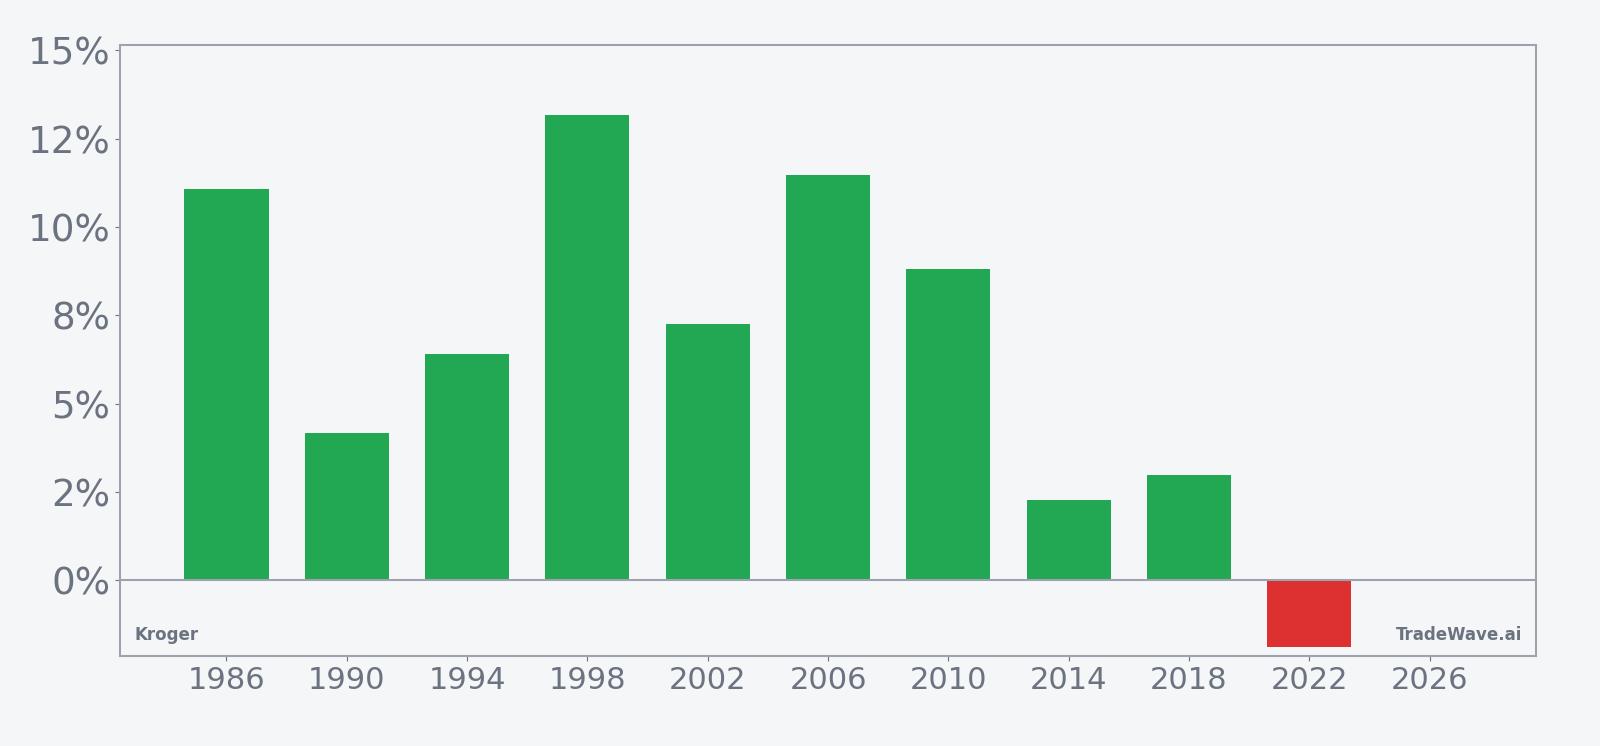
Across the last 10 midterm election years, the KR seasonal trend in this window has been decisively bullish for a long setup. Percent Profitable is 90%, with 9 winners and just 1 loser, and even after including that down year the all-years average outcome is a 7% gain. The median profit of 6.83% sits close to the average, which suggests the pattern is not being skewed by a single outlier year.
Looking at individual cycles, the strongest year in the sample was 1998, when Kroger gained 13.18% between the late-June entry and the end of the 52-day window, after a maximum favorable move of 15.04% and only a modest 3.44% drawdown from entry. On the other side of the ledger, 2022 was the lone losing year, with a net decline of 1.88% after a small 1.77% peak run-up and a much deeper 8.95% worst drawdown, a reminder that even a strong seasonal window can deliver a painful ride when macro or stock-specific pressures hit.
The historical seasonal average trend line shows gains tending to build steadily through the middle of the window rather than spiking only at the end. In many years, the maximum favorable move has occurred before the final day, which means traders who lean on this KR seasonal pattern have often seen the bulk of the upside arrive well before the window officially closes.
The combined net, peak run-up and worst drawdown profile by year shows how much room Kroger has historically had to move in both directions inside this window.
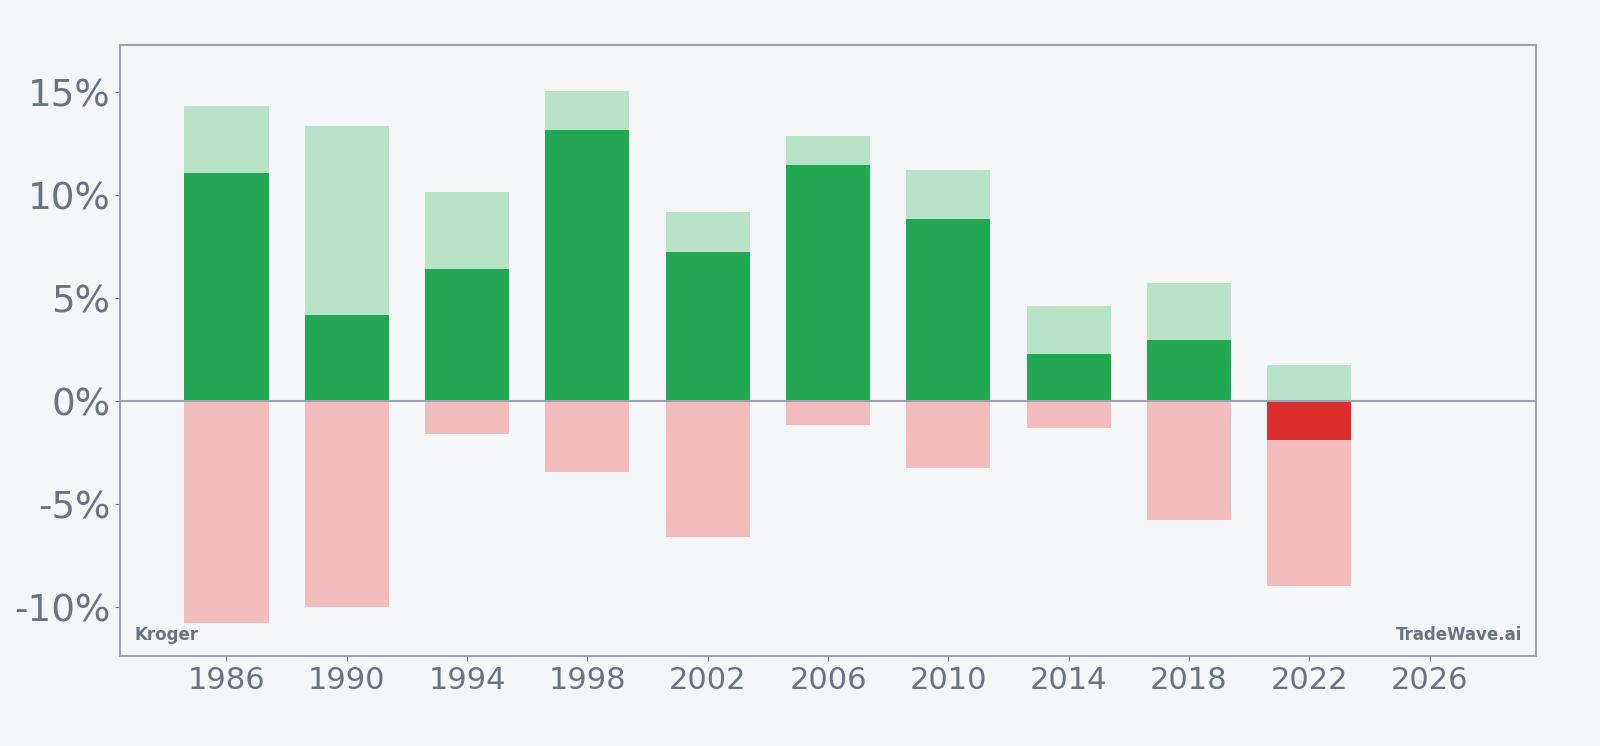
The maximum favorable excursion and maximum adverse excursion bars underline that this has been a high-conviction but not low-volatility window. In several winning years, Kroger’s best intraperiod move topped 10%, while the worst drawdowns in those same windows still reached into mid- to high-single digits. Add it up: 87% cumulative return across the 10 midterm-year windows, an annualized return of 6.48% and a Sharpe ratio of 1.27 for this specific slice of the calendar.
History does not guarantee future results; adverse excursions can be large even in winning windows, and a strong seasonal record does not eliminate stock-specific or macro risk.
Why does Kroger (KR) follow this seasonal pattern?
One likely driver is the way midterm-year summers line up with Kroger’s earnings calendar and guidance cadence, when investors reassess full-year grocery demand and pricing power. Analysts have also pointed to consumer spending cycles, with back-to-school and late-summer pantry restocking often favoring value grocers as households tighten budgets. The pattern may also reflect institutional portfolio repositioning in the middle of the presidential term, when defensive consumer names like Kroger can attract flows as policy uncertainty around the next election starts to build.
What is driving Kroger (KR) today?
Kroger closed at 64.65 on Wednesday, up 1.66 points or 2.6% on the session, leaving the stock up nearly 16% year to date and trading about 14.7% below its 52-week high of 75.78 while sitting roughly 12.6% above its 52-week low of 57.41. The move comes as investors continue to digest a strategy that leans into value-focused shoppers and price investment, with management earlier in 2026 outlining plans to reinvest savings into lower prices while keeping forecasts relatively conservative under a new chief executive.[6]
In April 2026, Kroger also launched its Pearl Street Academy workforce initiative and filed an omnibus shelf registration that gives the company flexibility to issue debt, equity or warrants, a combination that underscores both a push on talent and a desire to keep capital-raising options open.[4] Those steps sit on top of a multi-year effort to sharpen the e-commerce and fulfillment footprint, including a 2025 review of automated warehouses built with Ocado that signaled a willingness to rethink earlier bets on centralized robotics if they do not deliver the right returns.[5]
On the demand side, mid-2025 commentary from management highlighted that lower- and middle-income households were cooking at home more and trading down to private-label products, a trend that has supported Kroger’s sales mix and helped justify multiple guidance raises that year.[1][2][3] That same value-seeking consumer backdrop remains central to the 2026 story, especially as grocery rivals compete aggressively on price and promotions to capture budget-conscious shoppers.[6]
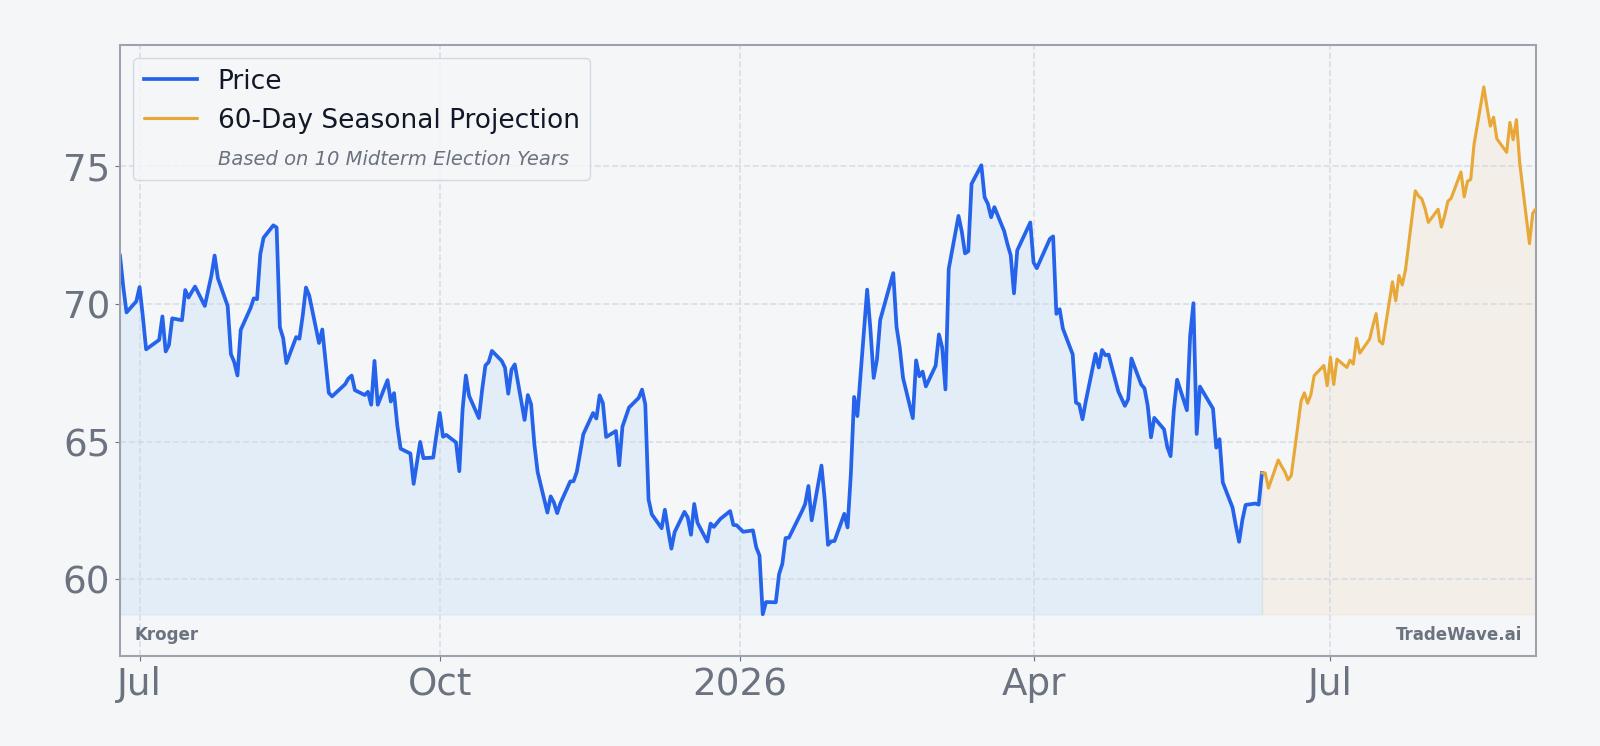
The chart below situates the latest move in its recent multi-month context alongside a 60-day seasonal projection.
What should traders watch as this Kroger seasonal window approaches?
First, the calendar: the 52-day KR seasonal window tied to midterm election years begins on Jun 25, so any sharp move into that date will shape how much room the historical pattern suggests is left. A push back toward the mid-70s would put the stock near its 52-week high, while a drift closer to the high-50s would test support near the recent low band.
Second, the policy and macro backdrop: midterm years often bring louder debates over fiscal policy and consumer support programs, which can influence how much pressure lower-income shoppers feel and how aggressively they trade down into private-label groceries. If value-seeking behavior stays in focus and Kroger continues to emphasize price investment, the historical seasonality could align with a fundamental story of steady, defensive growth.
Third, watch upcoming company updates and any hints on capital deployment following the shelf registration and workforce push.[4] Announcements around store remodels, automation investments or balance-sheet moves could either reinforce Kroger’s role as a defensive compounder or introduce new execution risk right as the seasonal window opens.
Finally, behavior inside the window itself will be telling. A pattern of early strength with contained drawdowns would rhyme with prior winning years, while a quick slide with deep intraperiod downside, similar to 2022, would signal that this midterm-year stretch is breaking from the usual KR seasonal trend. For traders who track seasonality, how Kroger trades between late June and mid-August will show whether this 9-for-10 record remains intact or finally gives way.
Sources
- CNBC, "Kroger's shares rise as grocer says shoppers seek lower prices, cook more at home," Jun 20, 2025
- Reuters, "Kroger lifts annual sales target on resilient demand for groceries," Jun 20, 2025
- Reuters, "Kroger raises annual sales forecast as grocery demand stays strong," Sep 11, 2025
- Yahoo Finance / Simply Wall St, "How Kroger’s New Shelf Registration and Workforce Push Could Shape Kroger (KR) Investors’ Outlook," Apr 24, 2026
- Reuters, "Ocado shares plunge 13% as US partner Kroger rethinks warehouse strategy," Sep 12, 2025
- Reuters, "Kroger keeps forecasts soft as new CEO bets on growth by keeping prices down," Mar 5, 2026
About this seasonal analysis
Seasonal pattern data is sourced from TradeWave.ai, which analyzes historical price behavior across annual calendar windows going back up to 30 years. Read the full data methodology or the book The 100-Year Pattern by Afshin Moshrefi (2026 edition). Past performance of seasonal patterns does not guarantee future results. This article is for informational purposes only and does not constitute investment advice.