Abbott Laboratories (ABT) Has Risen in Every Midterm Summer Window, Averaging 6.1% Gains
Abbott Laboratories is heading into a 59-day midterm-year seasonal window with a perfect win record, as shares trade higher on the year and sit well above their 52-week low.

What is the seasonal pattern for Abbott Laboratories (ABT)?
Abbott Laboratories has risen in 10 of 10 midterm-year summer windows during this 59-day stretch, with an average gain of 6.1% in winning years.
- 10 for 10 in this window, averaging 6.1% gains in winning years across the last 10 midterm election cycles.
- Seasonal window runs from Jun 19 and spans 59 trading days, covering the heart of the midterm-year summer.
- Percent Profitable is 100%, with 10 winners and 0 losers in the historical sample.
- TradeWave Ratio of 2.08 signals that price has typically traveled meaningfully in the long direction within the window.
- Sharpe ratio of 1.29 points to a favorable risk-adjusted profile for this specific Abbott Laboratories trading window.
- Some years still saw notable intraperiod drawdowns before finishing higher, so the ride has not always been smooth.
According to historical data from TradeWave.ai, this midterm-year summer stretch for Abbott Laboratories has behaved very differently from an average month on the calendar, and the next iteration begins in days.
How has Abbott Laboratories (ABT) traded in this midterm-year summer window?
Abbott Laboratories has risen in every one of the last 10 midterm election years during this 59-day summer window, averaging a 6.1% gain. Shares last traded at about $88.67, up roughly 17% year to date and about 33.6% below their 52-week high near $133.55.[1] That combination of a strong historical seasonality and a stock still well off its prior peak gives this upcoming window unusual weight for investors watching the medical devices and diagnostics group.
The pattern is built on the last 10 midterm election years, a phase of the presidential cycle that often brings policy noise, shifting reimbursement expectations and sector rotation in healthcare. Grouping Abbott’s behavior by this election phase rather than by simple calendar years surfaces a cleaner signal for how the stock has tended to trade when Washington is in the middle of the four-year cycle.
Historically, the trade direction for this window has been long, and the record is unusually clean: 10 winners, 0 losers, and a 100% hit rate. Average gains of 6.1% across all years sit alongside a 5.0% median profit, which tells you the typical outcome has been a mid-single-digit advance rather than a one-off outlier skewing the numbers. The cumulative return across these ten midterm-year windows is 79%, and the annualized return clocks in at 6.03%, both strong for a 59-day slice of the calendar.
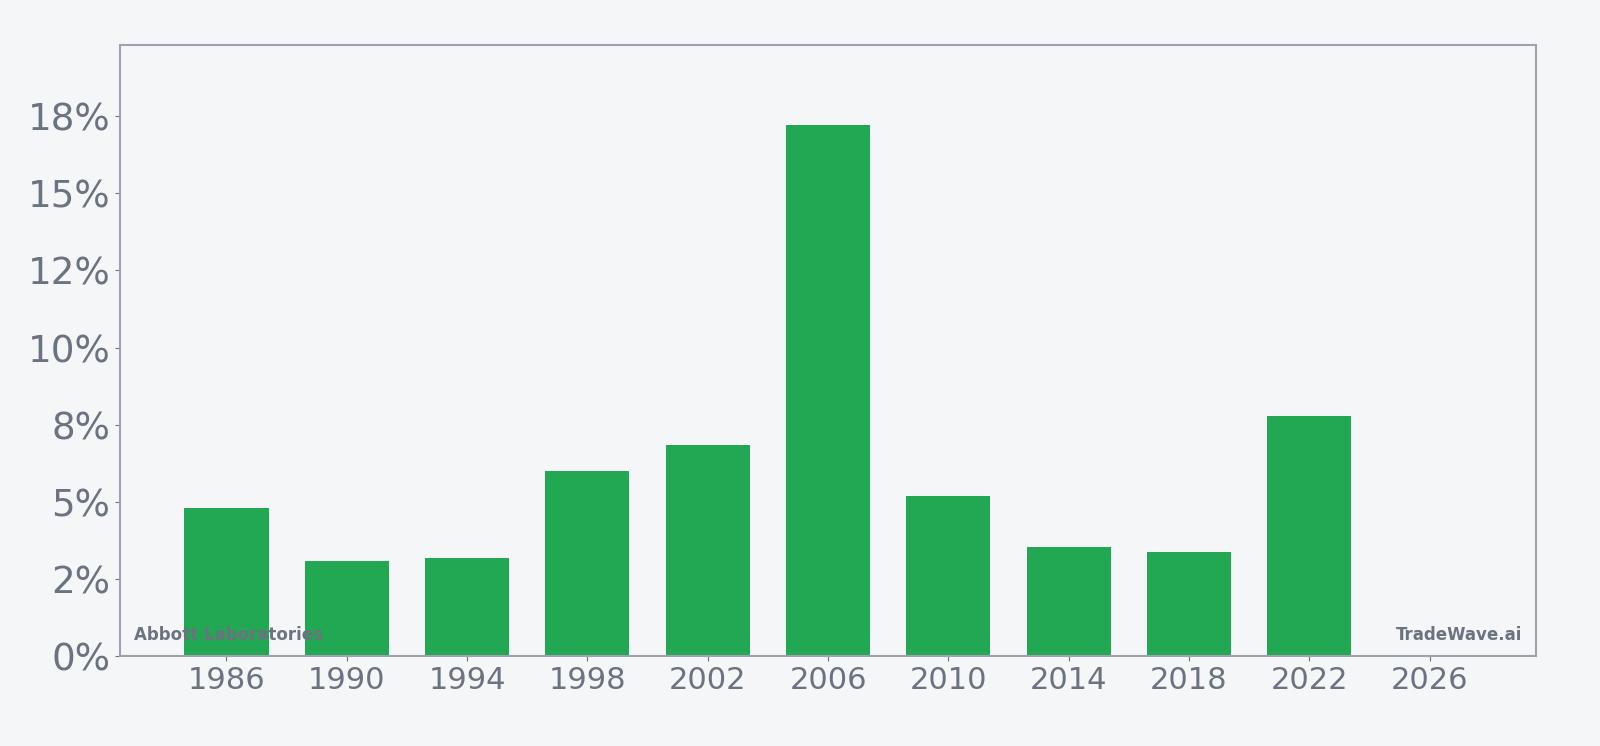
The per-year table shows how that plays out in individual cycles. The weakest net gain in the sample came in 1990, when Abbott still added 3.09% over the window, while 2006 stands out as the strongest year with a 17.22% advance from entry to exit. More recent history has been consistent rather than spectacular: 2018 delivered a 3.38% gain and 2022 posted a 7.78% rise, both in line with the long-run average behavior.
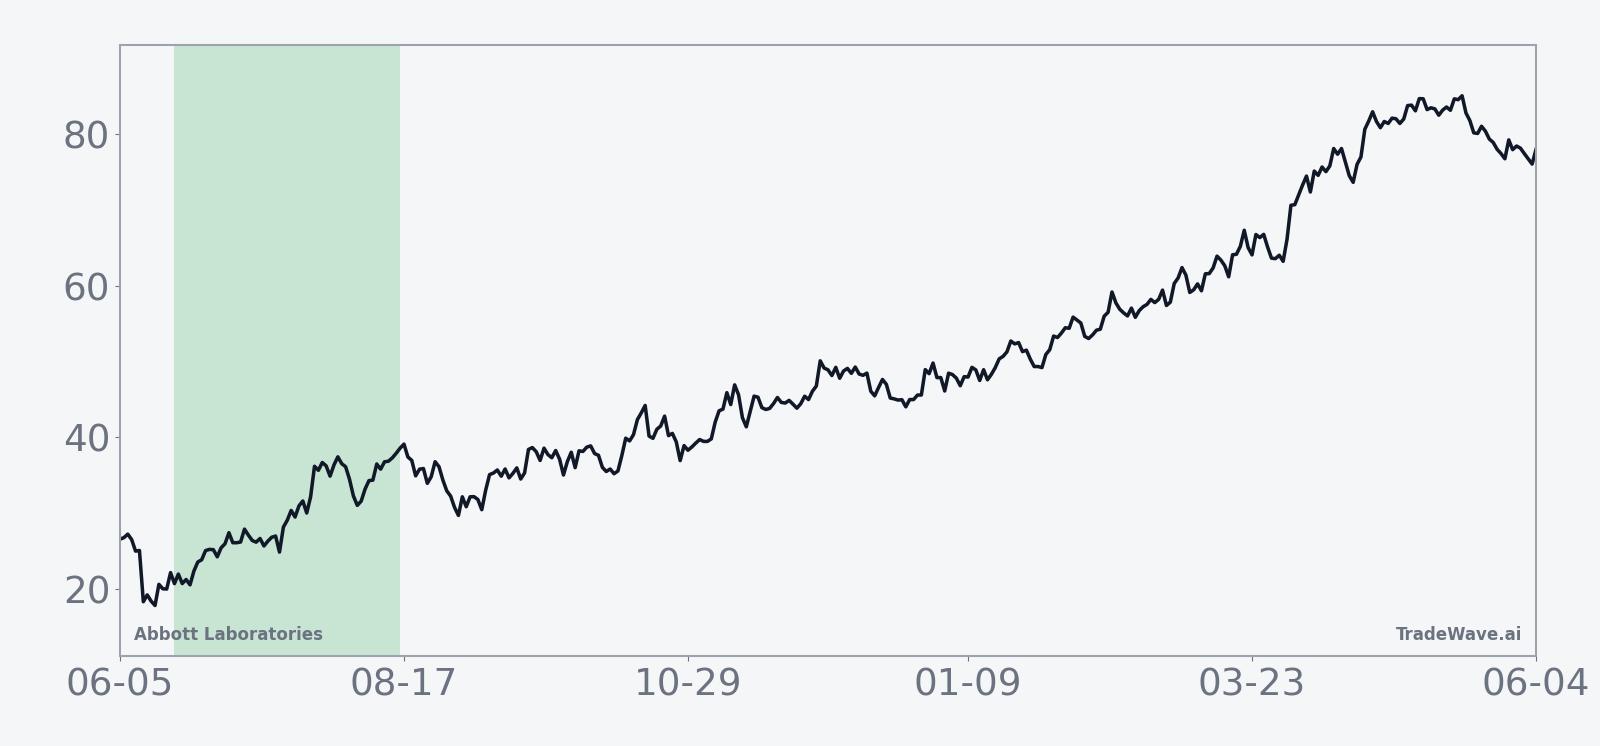
The historical seasonal trend chart shows a fairly steady upward slope rather than a front-loaded spike or back-end surge. Gains tend to accrue gradually across the 59 days, with only modest soft patches, which fits a picture of investors adding exposure to Abbott through the midterm-year summer rather than trading around a single event.
The next view layers in how far Abbott has typically run up or sold off inside the window before finishing higher.
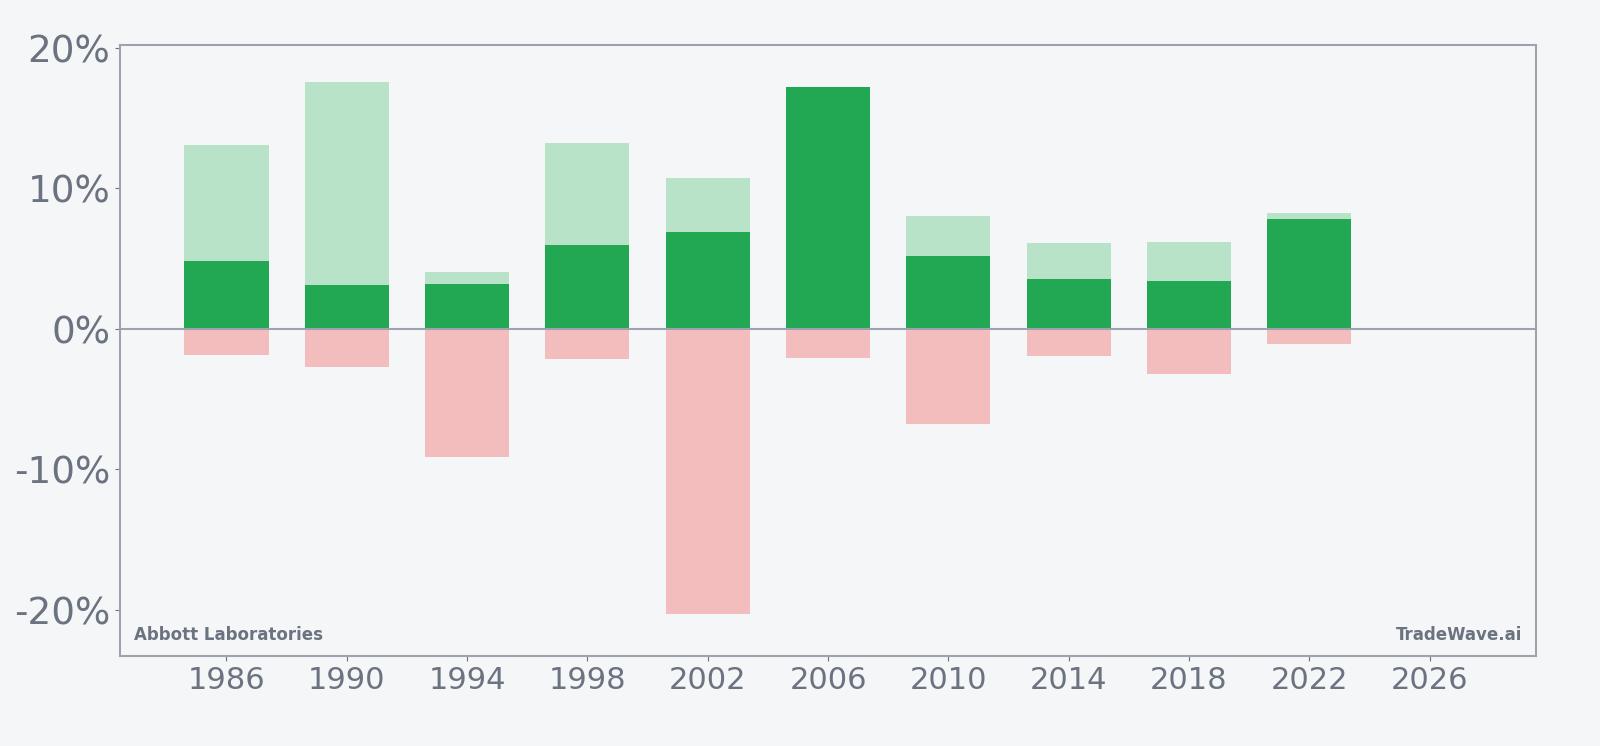
The stacked net, maximum favorable move and maximum adverse move bars highlight that even winning windows have carried real downside swings. In 2002, for example, Abbott finished the window up 6.85% but at one point was down as much as 20.3% from the entry before recovering. Other years, such as 2006 and 2022, saw maximum favorable moves in the high single to mid-teens with relatively shallow worst drawdowns, suggesting some cycles offered cleaner trends while others demanded more risk tolerance.
The Sharpe ratio of 1.29 underlines that, on an end-of-window basis, returns have been strong relative to volatility. At the same time, the TradeWave Ratio of 2.08 signals that price has typically traveled a meaningful distance in the long direction within the window, which can matter for traders who manage risk off intraperiod swings rather than just the final close.
History does not guarantee future results; adverse excursions can be large even in winning windows, and traders should be prepared for volatility inside the pattern.
Why does Abbott Laboratories (ABT) follow this seasonal pattern?
This midterm-year summer pattern may reflect a mix of earnings timing, healthcare policy headlines and institutional portfolio repositioning. One likely driver is that Abbott often reports midyear results and updates guidance around this stretch, which can reset expectations for its medical devices and diagnostics businesses. The midterm election year also tends to concentrate debate around reimbursement and regulation, and large investors may use this window to adjust healthcare exposure as policy visibility improves.
What is driving Abbott Laboratories (ABT) today?
Abbott shares last changed hands near $88.67, up about 0.5% on the day and roughly 17% higher year to date, with the stock trading between a 52-week low of $81.97 and a high around $133.55 on the current 12-month lookback.[1] That leaves the stock closer to the bottom of its range than the top, even after a solid one-month gain of 4.97% and with 20-day average volume running near 11.9 million shares, slightly above the latest daily turnover.[1]
In July 2025, Abbott reported adjusted profit of $1.26 per share for its second quarter, edging past analyst estimates but pairing the beat with a softer-than-expected profit forecast for the following quarter, which pressured the stock in early trading.[1][2][3] On the same day, executives flagged that U.S. tariffs were expected to add a few hundred million dollars in annual costs and outlined plans for a new cardiovascular manufacturing facility in Georgia by 2028 to help offset that pressure.[5][6] Later in October 2025, another earnings update showed that strength in medical devices and diabetes care was partly offset by weakness in diagnostics and nutrition, and shares again slipped in early trade as investors digested the mixed segment picture.[4]
The chart below situates the latest move in its recent multi-month context alongside a 60-day seasonal projection.
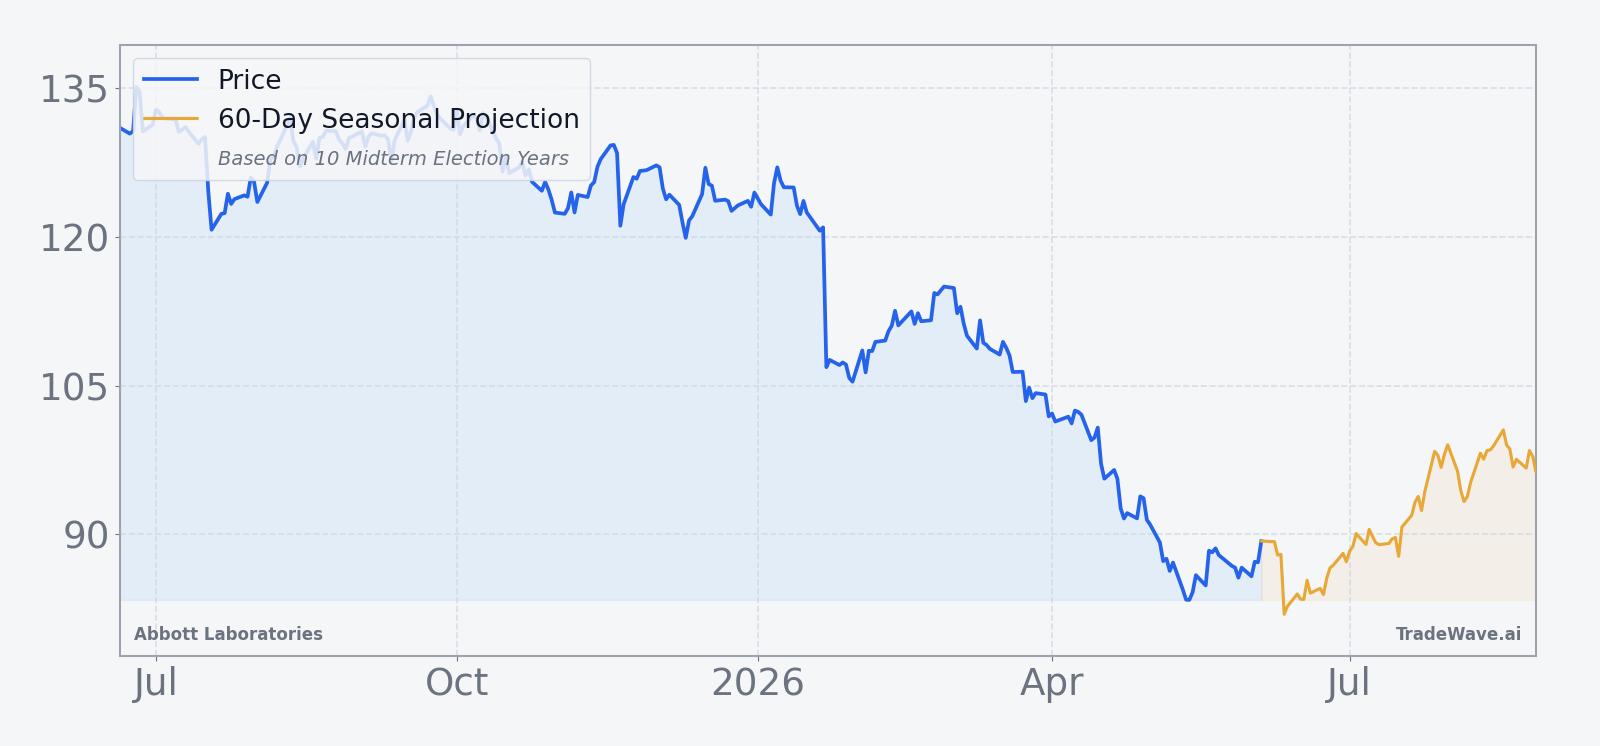
From a sector standpoint, Abbott sits at the intersection of medical devices, diagnostics and nutrition, with recent growth led by heart devices and continuous glucose monitors while diagnostics and nutrition have lagged in some quarters.[4] That mix leaves the stock sensitive both to procedure volumes and to broader macro themes such as tariffs and trade policy, which management has said could weigh on results but also justify more U.S.-based investment.[5][6] For traders watching the upcoming seasonal window, the key question is how that fundamental backdrop interacts with a historical pattern that has, so far, leaned consistently bullish for Abbott in midterm-year summers.
Sources
- Reuters, "Abbott beats quarterly profit estimates on medical devices demand," Jul 17, 2025.
- Reuters, "Abbott beats profit estimates on medical devices demand, shares fall on forecast," Jul 17, 2025.
- Reuters, "Abbott beats estimates on medical devices demand as forecast hits shares," Jul 17, 2025.
- Reuters, "Abbott revenue misses as diagnostics, nutrition weakness clouds medical devices lift," Oct 15, 2025.
- Reuters, "Abbott profit forecast falls short, ramps up US investing amid tariff pressure," Jul 17, 2025.
About this seasonal analysis
Seasonal pattern data is sourced from TradeWave.ai, which analyzes historical price behavior across annual calendar windows going back up to 30 years. Read the full data methodology or the book The 100-Year Pattern by Afshin Moshrefi (2026 edition). Past performance of seasonal patterns does not guarantee future results. This article is for informational purposes only and does not constitute investment advice.