Amphenol (APH) Has Rallied in 8 of 8 Midterm July Windows, Averaging 22.24% Gains
Amphenol is heading toward a long midterm-election-year seasonal window that has never been negative in the data, just as the stock trades close to its 52-week high.

What is the seasonal pattern for Amphenol (APH)?
Amphenol has risen in 8 of 8 midterm-election-year windows starting in mid-July, with an average gain of 22.24% in winning years.
- 8 for 8 in this window, with Amphenol averaging 22.24% gains across all winning years.
- The upcoming seasonal window begins Jul 11, 2026 and runs for 273 trading days, spanning the back half of the midterm election year into the following phase.
- Percent Profitable is 100%, with 8 winners and 0 losers in the historical sample.
- Average gains cluster in the high teens to mid-30% range, with a cumulative return of 389% across the eight midterm-year windows.
- Intraperiod swings have been meaningful, with some years seeing adverse moves larger than 20% before finishing higher.
- The pattern is long-biased, with a Sharpe ratio of 2.14 and a TradeWave Ratio of 2.3, pointing to strong upside relative to typical volatility.
According to historical data from TradeWave.ai, this midterm-election-year stretch has behaved very differently from an average year for Amphenol, and the next iteration is about to start.
How has Amphenol (APH) traded in past midterm-year windows starting in July?
Amphenol has risen in all eight midterm-election-year windows that start around Jul 11 and run for roughly nine months, averaging gains of 22.24% with no losing years. Today the stock closed at 158.68, up 3.17% on the session and sitting about 4.6% below its 52-week high of 166.38.[1] That combination of a strong historical seasonal trend and a price already near the top of its one-year range gives this upcoming Amphenol trading window unusual weight for investors watching the stock’s next leg.
Grouping the data by the presidential election cycle matters here because this pattern only looks at the last eight midterm election years, not every calendar year. Midterm years often bring policy uncertainty, shifting fiscal priorities and sector rotation, which can change how industrial and communications suppliers like Amphenol trade compared with election years or the year after.
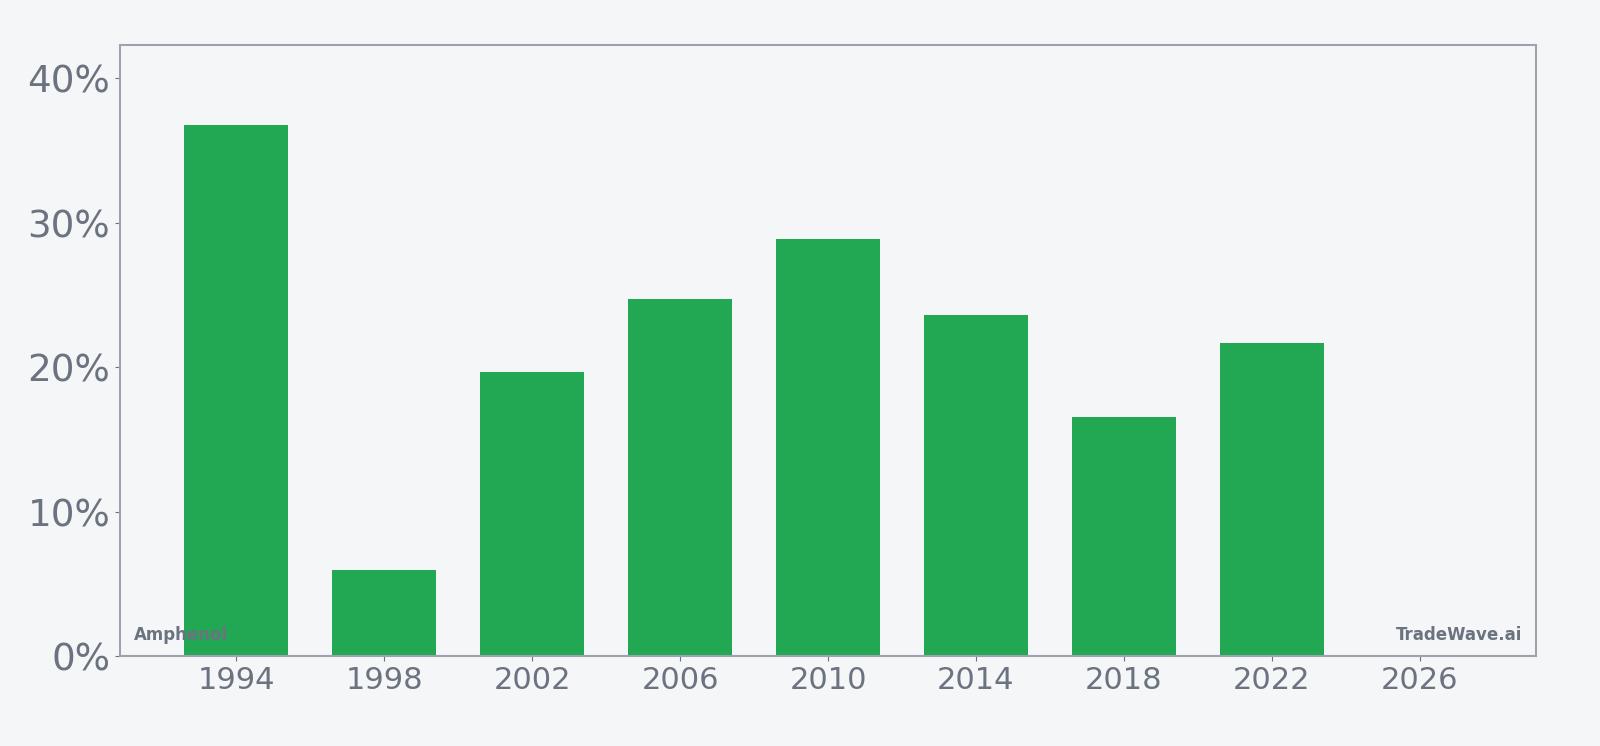
Across the eight midterm-election-year samples, the APH seasonal trend is firmly long-biased. Percent Profitable is 100%, with 8 winners and 0 losers, and the average gain of 22.24% lines up closely with the median profit of 22.67%, which suggests the wins are not being skewed by a single outlier year. The strongest year in the table is 1994, when the stock gained 36.78% during this window, while the softest outcome was 1998, which still finished up 5.96% despite a deep intraperiod drawdown.
Looking at intraperiod swings, the maximum favorable move in winning years has ranged from the high teens to more than 50%. In 1994, for example, Amphenol’s best point-to-peak move inside the window reached 52.75%, while the worst drawdown from entry was limited to 0.7%. By contrast, 1998 shows how bumpy the ride can be: the stock ultimately finished higher, but at one point it was down 28.47% before recovering. That mix of large maximum favorable excursion and sometimes large maximum adverse excursion is what traders mean when they talk about a “high-variance” seasonal window.
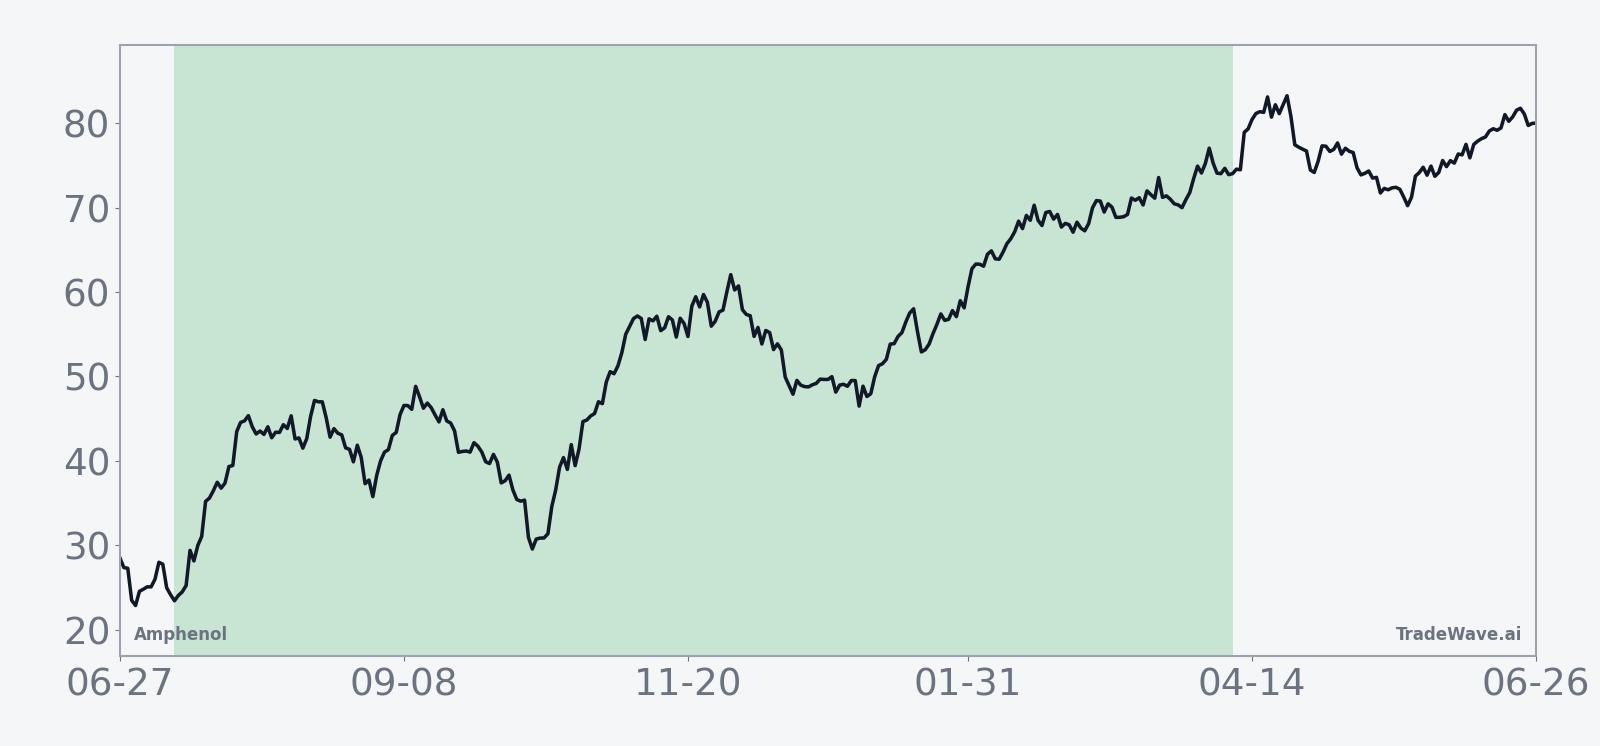
The historical seasonal average curve for this APH seasonal trend slopes higher for most of the 273-day span, with relatively steady gains rather than a single sharp spike. The typical pattern shows a constructive bias early in the window, some mid-period choppiness, and then another leg higher as the calendar moves closer to the following year, which lines up with the broader tendency for risk assets to firm up as markets transition from the midterm election year into the year before the presidential election.
The next chart combines yearly net results with the best and worst intraperiod swings to show how upside and downside have coexisted in this Amphenol trading window.
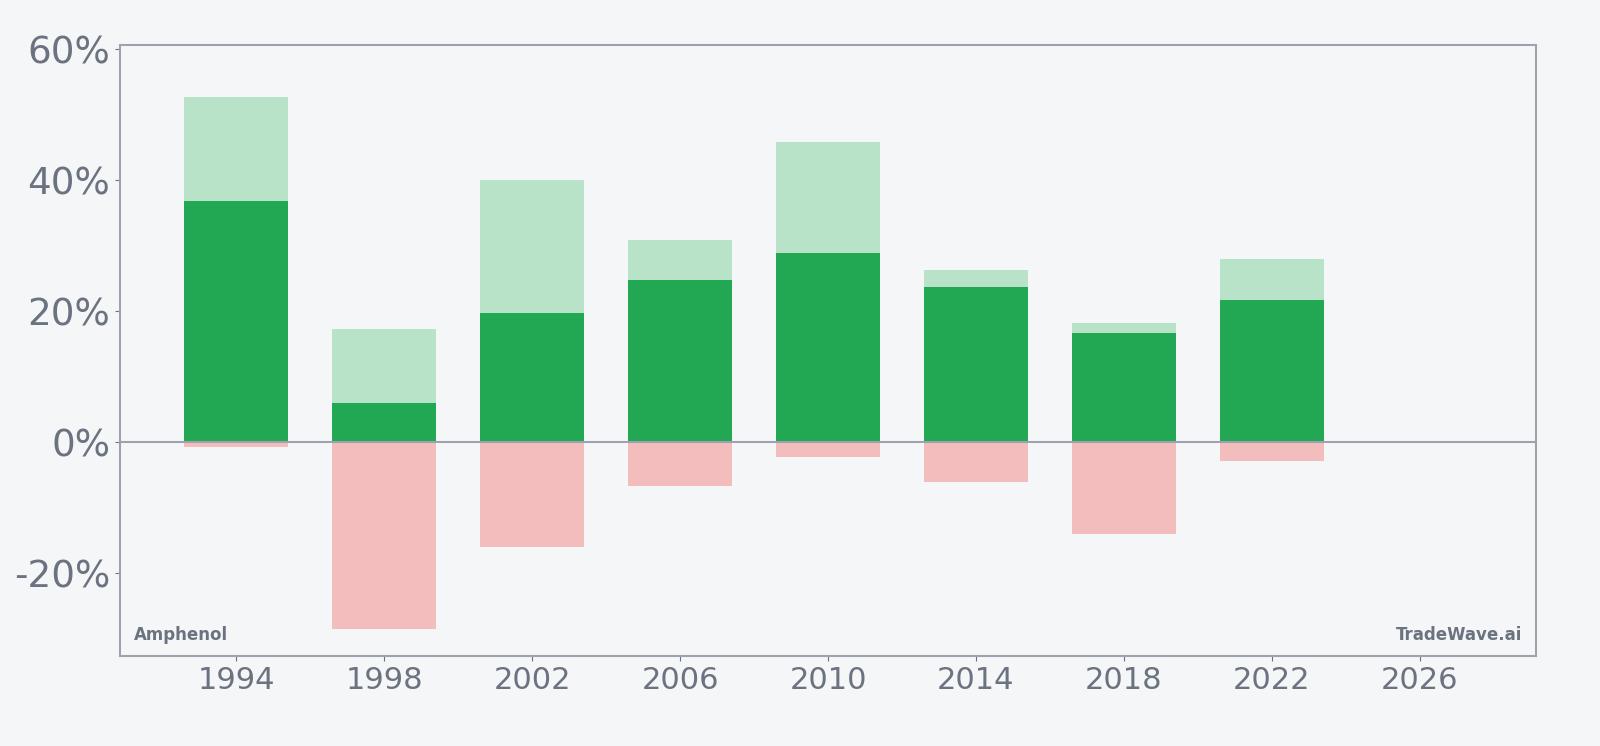
The stacked net / MFE / MAE view makes the trade-off clear: in every midterm-year sample, Amphenol ultimately finished the window higher, but several years saw double-digit drawdowns along the way. Large positive MFE values show that when the stock trends, it can trend hard in this period, while the MAE bars in years like 1998 and 2002 flag the kind of downside volatility that long holders have historically had to sit through to capture the full move. Add it up: 8 for 8 winning windows, but not without some sharp swings.
History does not guarantee future results; adverse excursions (MAE) can be large even in winning windows.
Why does Amphenol (APH) follow this seasonal pattern?
One likely driver is the way Amphenol’s earnings and capital spending cycles line up with the broader presidential election calendar. Midterm years often see delayed infrastructure and defense decisions in the first half, followed by catch-up orders and budget releases into year-end and the following year, which can benefit a connectivity and interconnect supplier. Analysts have also pointed to sector rotation into industrial and communications hardware as policy visibility improves after midterm votes, which may help explain why this specific Amphenol trading window has been so consistently positive across past cycles.[3]
What is driving Amphenol (APH) today?
Amphenol shares closed at 158.68, up 3.17% on the day, extending a strong one-month run of 26.87% and leaving the stock about 4.6% below its 52-week high of 166.38.[1] The move keeps APH well above its 50-day moving average of 140.79 and comes with trading volume of roughly 5.4 million shares, modestly below the recent 20-day average of about 10.9 million.[1] There is no fresh company-specific news on Jun 16, 2026, but prior coverage has tied the story to Amphenol’s push deeper into broadband connectivity and defense interconnects through acquisitions, as well as to AI-related demand for higher content per rack in data centers.[2][3]
The chart below situates the latest move in its recent multi-month context alongside a short-term seasonal projection.
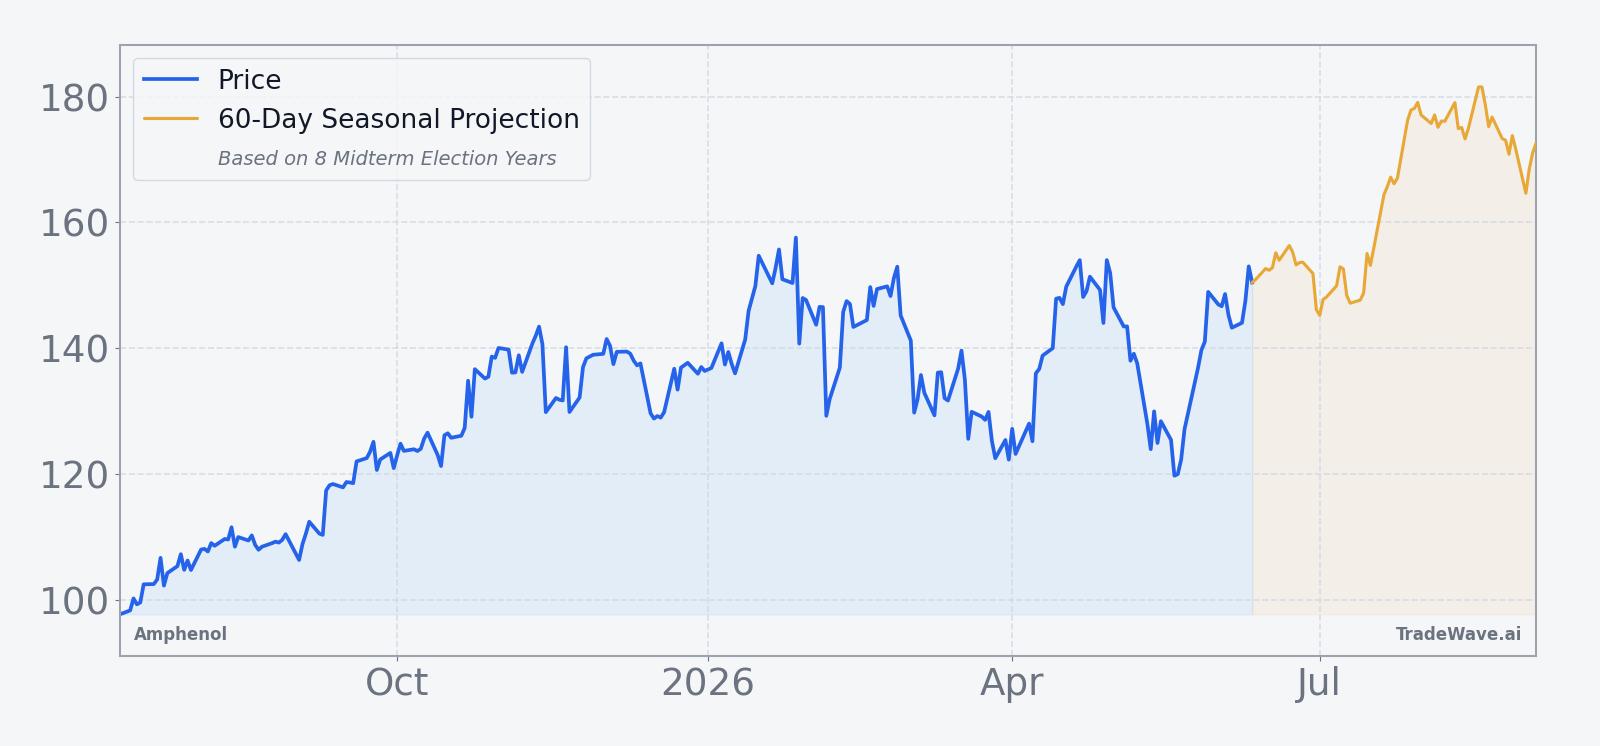
In Aug 2025, reports said Amphenol was in late-stage talks to acquire CommScope’s broadband connectivity and cable unit for about $10.5 billion including debt, a deal that would expand its footprint in fiber and broadband markets.[2] Later that month, The Wall Street Journal reported a separate agreement to buy Trexon for about $1 billion, adding defense-focused interconnect and cable assemblies with expected 2025 sales of around $290 million.[3] Those transactions, combined with analyst commentary about triple-digit AI revenue growth potential into 2026, have framed Amphenol as a beneficiary of both infrastructure build-out and data center spending, which helps explain why the stock is pressing toward the top of its range heading into this historically strong seasonal stretch.[3]
What should traders watch as this Amphenol seasonal window approaches?
First, the calendar: the next APH seasonal window tied to the midterm election year begins on Jul 11, 2026 and runs for 273 trading days, so the key test of this 8-for-8 pattern is only weeks away. Second, price levels: traders will be watching whether Amphenol can break through its 52-week high near 166.38 and hold above its 50-day moving average on any pullbacks, which would keep the stock aligned with the historical long-biased APH seasonal trend.[1] Third, macro and policy catalysts: as the midterm election year progresses, any shifts in infrastructure, broadband or defense spending plans could either reinforce or challenge the historical pattern that has favored Amphenol in this phase.[2][3] Finally, behavior inside the window will matter: if the stock again shows strong maximum favorable moves with contained drawdowns, it would echo prior cycles, while a deep and persistent adverse excursion would be an early sign that this midterm-year pattern is breaking.
Sources
- [1] EODHD, “Amphenol (APH) daily quote and 52-week statistics,” data as of Jun 16, 2026.
- [2] Seeking Alpha, “Amphenol set to acquire CommScope unit in $10.5B deal - report,” Aug 4, 2025.
- [3] The Wall Street Journal, “Amphenol to Buy Trexon From Audax Private Equity for $1 Billion,” Aug 18, 2025.
About this seasonal analysis
Seasonal pattern data is sourced from TradeWave.ai, which analyzes historical price behavior across annual calendar windows going back up to 30 years. Read the full data methodology or the book The 100-Year Pattern by Afshin Moshrefi (2026 edition). Past performance of seasonal patterns does not guarantee future results. This article is for informational purposes only and does not constitute investment advice.