CF Industries (CF) Has Dropped in 9 of the Past 10 Late-June 17-Day Windows
CF Industries is heading into a historically weak 17-day late-June trading window just as the stock sits on an 18% year-to-date gain, raising the stakes for fertilizer bulls.
What is the seasonal pattern for CF Industries (CF)?
CF Industries has fallen in 9 of 10 years during this late-June 17-day window, with an average gain of 5.02% in winning years.
- 9 for 10 in this window, with CF moving in the short direction and winning years averaging 5.02% moves.
- The upcoming 17-day window starts on Jun 19, 2026, and has historically favored short setups in CF Industries.
- Percent Profitable is 90%, with 9 winners and 1 loser across the past 10 years in this CF seasonal trend.
- Average outcome across all years is a 4% move in the trade direction, showing that losses have been relatively contained versus winners.
- Maximum favorable excursions have often been sizable, while adverse moves have at times reached double digits, underscoring meaningful intraperiod volatility.
- For traders, this CF Industries trading window has historically been a defined, short-biased stretch rather than a neutral summer lull.
According to historical data from TradeWave.ai, this late-June stretch has behaved very differently from an average month on the CF calendar, and the next iteration begins tomorrow.
How has CF Industries (CF) traded in this late-June seasonal window?
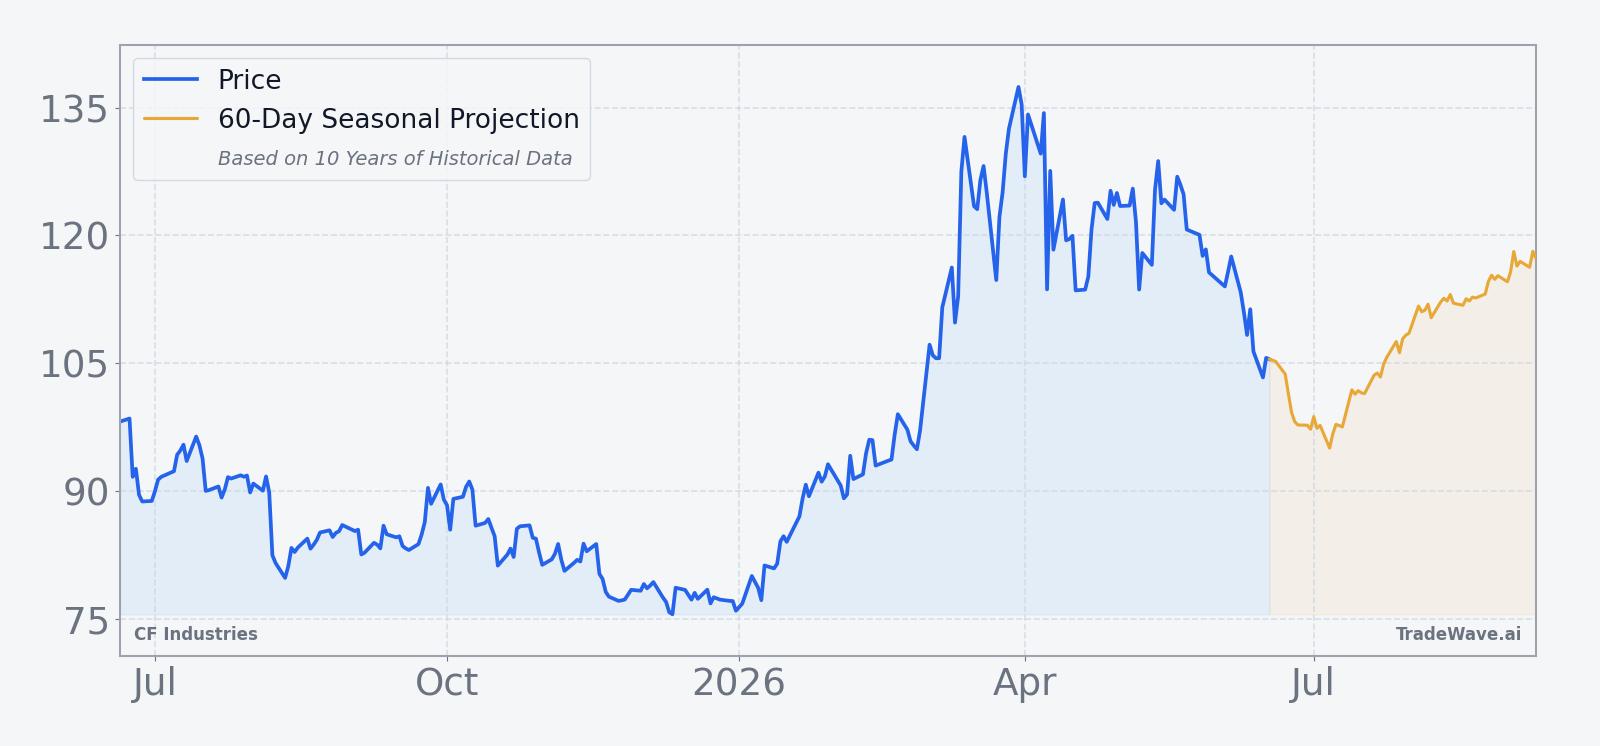
CF Industries has fallen in 9 of the past 10 years during this 17-day late-June window, with a short-side average move of 5.02% in winning years and a 4% average across all years. The next window begins on Jun 19, 2026, with the stock last changing hands around 105.85 after an 18% climb year to date, leaving it well below its 52-week high near 140.81 but comfortably above the 74.02 low. That combination of a strong year so far and a historically weak seasonal stretch has made this part of the calendar a recurring stress test for CF bulls.
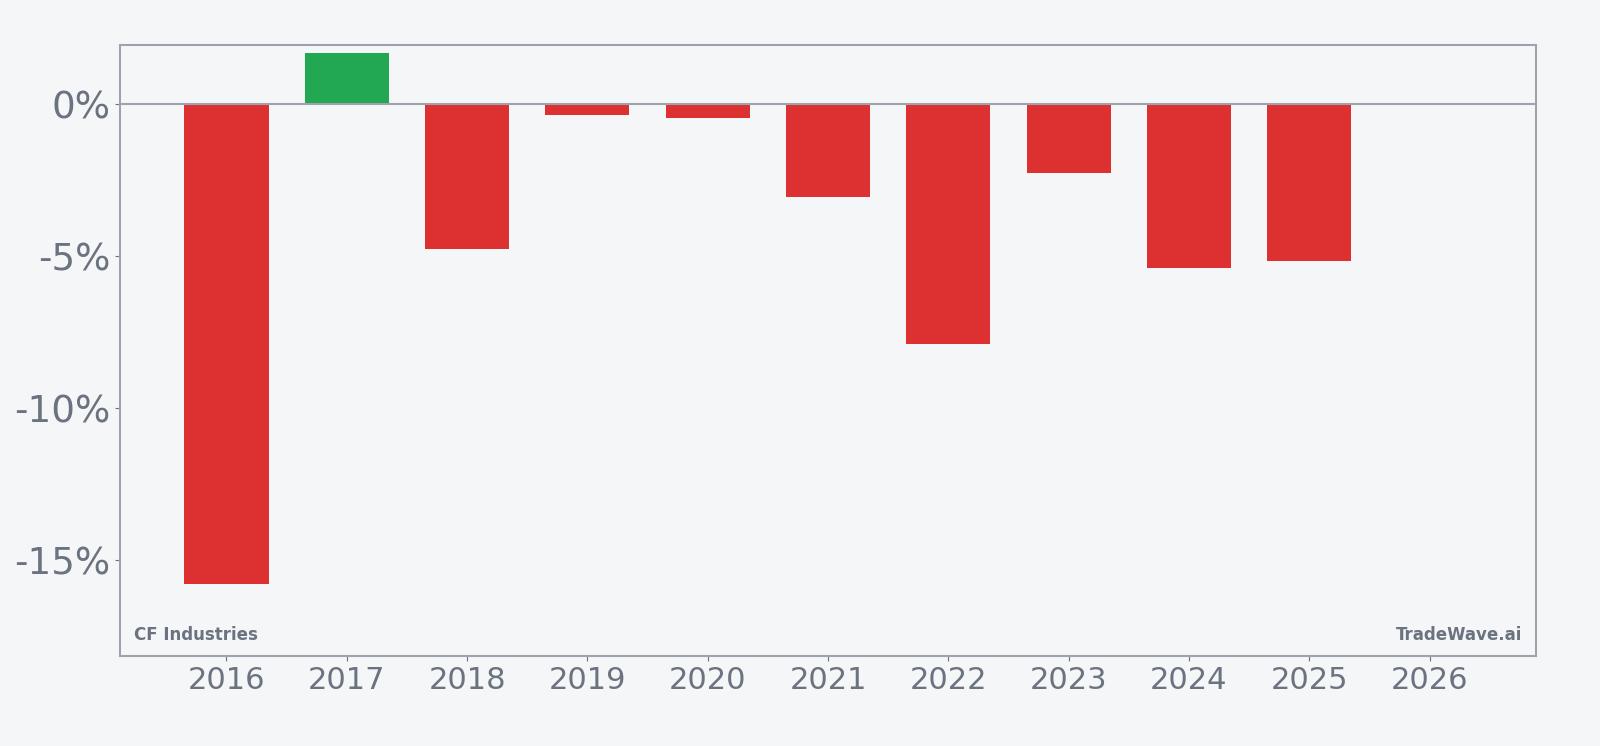
Because the trade direction is short, negative net returns in the per-year table mark the “good” years for this pattern. Nine of the ten years in the lookback delivered negative net returns between roughly 0.4% and 15.8%, while the lone losing year for the short setup saw CF rise about 1.7% during the window. That skew explains why the all-years average of 4% in the trade direction sits not far below the 5.02% average for winners.
The 10-year average seasonal trend for this CF Industries trading window shows pressure building early, with the typical path drifting lower rather than snapping sharply in a single day. That choppy grind is consistent with the pattern’s short bias, where many years saw modest but persistent downside rather than a one-off collapse.
A combined view of net returns and intraperiod swings shows how much room CF has historically given both shorts and dip buyers in this stretch.
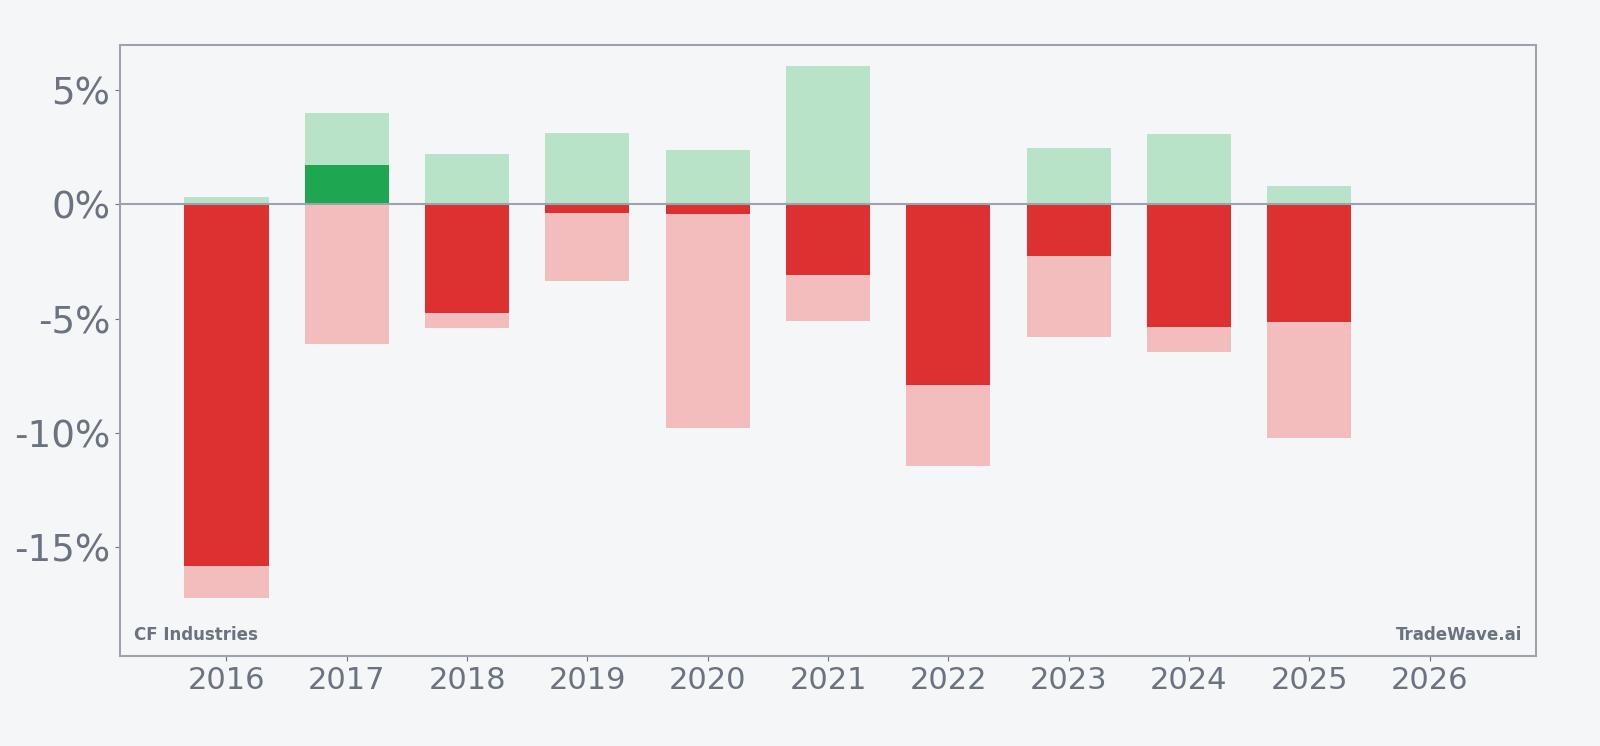
The maximum favorable excursions in winning years often reached several percentage points, while the worst drawdowns from entry sometimes pushed into double digits, as in 2016 and 2022. That mix of sizable peak run-ups in the trade direction and occasional deep adverse moves means this window has historically rewarded well-timed shorts but punished poor risk control. Add it up: 9 of 10 years have leaned with the short bias, and the typical move has been meaningful rather than noise.
History does not guarantee future results, and maximum adverse excursions can be large even in windows that ultimately finish in the trade direction.
Why does CF Industries (CF) follow this seasonal pattern?
For a fertilizer producer like CF Industries, one likely driver is the timing of crop-planting decisions and nitrogen demand, which can shift dealer orders and pricing power around midyear. Analysts have also pointed to portfolio rebalancing in basic materials and agriculture stocks as investors adjust exposure after spring planting and ahead of second-half guidance. This late-June CF seasonal pattern may reflect that combination of commodity demand seasonality and institutional sector rotation rather than any single recurring headline.
What is driving CF Industries (CF) today?
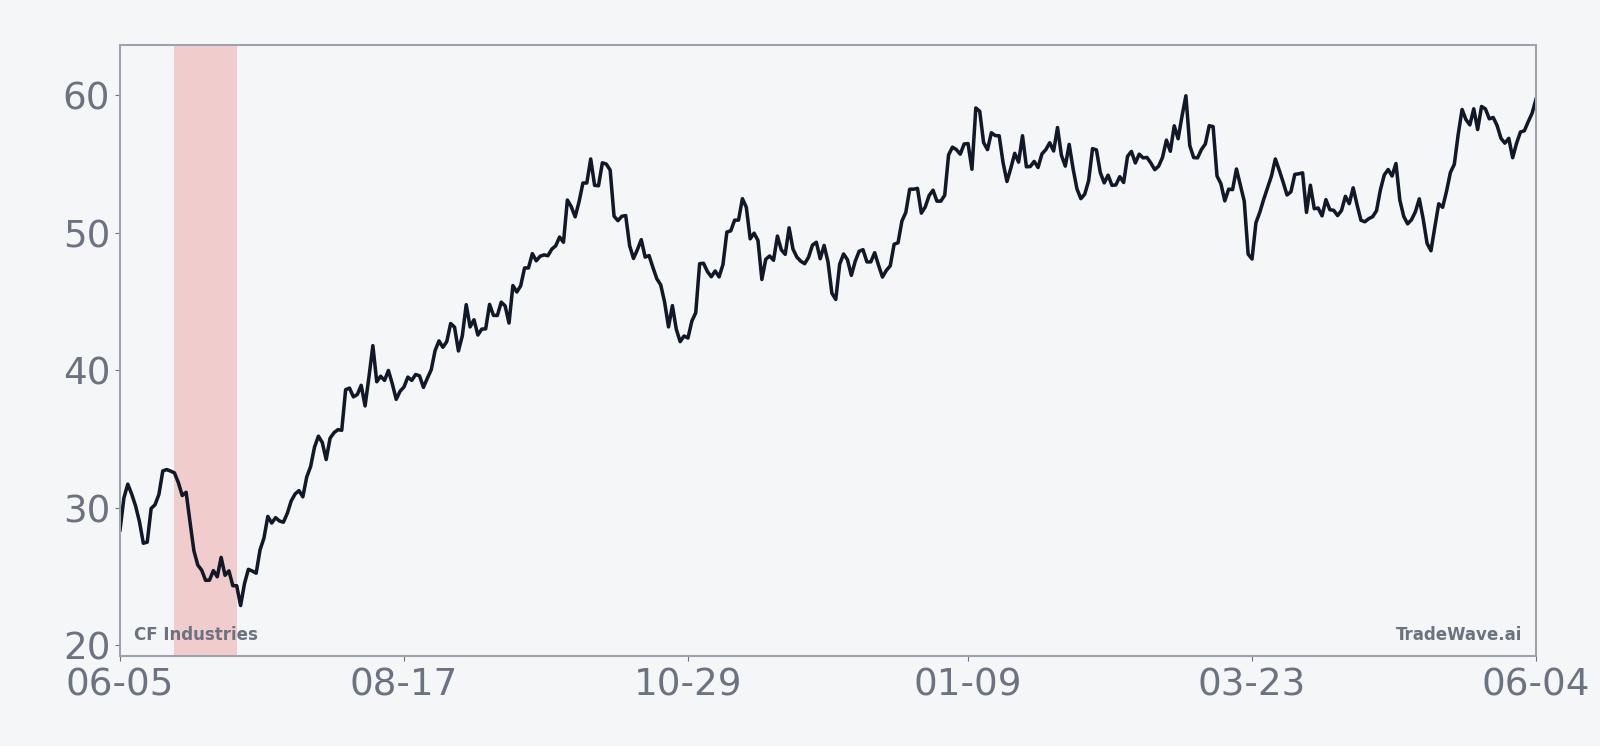
CF Industries last traded around 105.85, down about 0.3% on the day, after a one-month slide of roughly 17.21% that has chipped away at what is still an 18% gain for 2026. The stock remains well below its 52-week high near 140.81 and above its 74.02 low, with the 50-day moving average up around 118.42 and 20-day average volume near 2.80 million shares, suggesting the recent pullback has unfolded against a backdrop of still-solid liquidity.
In January 2026, CF was highlighted as “gaining altitude” on the back of strong agriculture-related commodity prices and a four-week winning streak, a move that helped set up its double-digit year-to-date advance.[1] Sector commentary around basic materials and agriculture has framed CF as a key beneficiary of firm nitrogen pricing and resilient farm economics, even as broader markets have rotated between growth and value themes.[1] With the stock now backing off its highs into a historically weak late-June seasonal window, traders are watching whether that earlier momentum can withstand a calendar stretch that has often favored the short side.
The chart below situates the latest pullback and the upcoming seasonal window against CF’s past year of trading.
What does the earnings backdrop look like for CF Industries (CF)?
There is no confirmed date yet for CF Industries’ next earnings release in the available data, and recent detailed results or guidance are not included in this snapshot. That leaves traders leaning more heavily on price action, sector tone and historical seasonality rather than near-term earnings catalysts when thinking about this late-June window. For a cyclical name tied to fertilizer pricing, any update on nitrogen demand, export flows or input costs in the next report could either reinforce or blunt the seasonal tendency if it lands inside or just after the 17-day stretch.
How does the macro and sector backdrop affect CF Industries (CF)?
CF sits squarely in the basic materials and agriculture complex, where commentary for 2026 has emphasized strength in agriculture-related names and commodities.[1] Higher crop prices and solid farm incomes tend to support fertilizer demand, which in turn can bolster CF’s margins and cash flow. That macro tailwind has been a key part of the story behind the stock’s 18% year-to-date gain, even as broader equity markets have wrestled with shifting expectations for interest rates and global growth.
Within the sector, CF is often treated as a liquid proxy for nitrogen fertilizer pricing and farmer sentiment. When agriculture commodities rally, investors frequently rotate into fertilizer producers, and CF has historically been one of the first tickers to catch that bid.[1] The seasonal pattern around late June therefore sits on top of a macro backdrop that is still constructive for the business, which makes the short-biased window more about timing and positioning than about a bearish call on the long-term fundamentals.
How are investors valuing CF Industries (CF) into this seasonal window?
Specific valuation markers such as forward earnings multiples or consensus price targets are not included in the current dataset, but the technical picture offers some clues about how investors are treating CF into this late-June stretch. The stock’s pullback below its 50-day moving average near 118.42, while still holding well above the 52-week low, suggests a market that has taken some profits after a strong run rather than one that has fully abandoned the agriculture trade. Average 20-day volume around 2.80 million shares points to active two-way interest, which can amplify the impact of a historically volatile seasonal window.
What should traders watch in CF Industries (CF) during this window?
First, watch how CF behaves as the 17-day window opens on Jun 19. A quick slide that pushes the stock further below the 50-day moving average would be consistent with the historical pattern, especially if it comes on rising volume. A firm or rising tape through the window, by contrast, would mark only the second time in a decade that the short-biased CF seasonal pattern has failed to play out.
Second, monitor key price levels. On the upside, the 50-day moving average near 118.42 is the first technical hurdle that would need to be reclaimed to signal that buyers are overpowering the seasonal tendency. On the downside, traders will be watching how CF behaves if it drifts toward the mid-90s, an area that roughly aligns with last year’s entry level in the pattern and has previously attracted dip buyers.
Third, keep an eye on agriculture commodity headlines and sector flows. Any renewed surge in crop prices or fertilizer benchmarks could offset the historical seasonality by pulling fresh capital into the group, while softer commodity prints might reinforce the short bias that has dominated this window in prior years.[1] For a stock that has already banked an 18% year-to-date gain, the way CF trades through this late-June stretch will offer a clean read on whether momentum or the calendar is in charge.
Sources
About this seasonal analysis
Seasonal pattern data is sourced from TradeWave.ai, which analyzes historical price behavior across annual calendar windows going back up to 30 years. Read the full data methodology or the book The 100-Year Pattern by Afshin Moshrefi (2026 edition). Past performance of seasonal patterns does not guarantee future results. This article is for informational purposes only and does not constitute investment advice.