10-for-10: DTE Energy (DTE) Has Rallied in Every 51-Day Midterm Summer Window Since 1986
DTE Energy is heading toward a historically strong 51-day midterm-year summer window even as shares trade just below recent highs and investors weigh massive AI data center power demand.
What is the seasonal pattern for DTE Energy (DTE)?
DTE Energy has risen in 10 of 10 midterm-year summer windows starting around Jul 2, with an average gain of 5.05% in winning years.
- 10 for 10 record in this 51-day midterm-year window, with average gains of 5.05% in winning years.
- Percent Profitable is 100%, with 10 winners and 0 losers across the last 10 midterm election years.
- The window runs from Jul 2 for 51 trading days, capturing the heart of the summer for this utility stock pattern.
- Annualized return across these windows is 4.99%, with a Sharpe ratio of 1.2 based on end-of-window outcomes.
- The TradeWave Ratio of 1.74 signals that price typically travels meaningfully in the long direction within the window.
- Individual years have seen net gains as high as 9.77%, but intraperiod drawdowns have occasionally been sharp before finishing higher.
According to historical data from TradeWave.ai, this midterm-year summer stretch has behaved very differently from an average month on the calendar for DTE Energy, and the next iteration is about to open again.
How has DTE Energy (DTE) traded in past midterm-year summer windows?
DTE Energy has risen in 10 of the last 10 midterm election years during the 51 trading days starting Jul 2, averaging a 5.05% gain across those winning windows. Shares last closed at 146.49, down 1.6% on the day and about 4.7% below the 52-week high of 153.72.[1] That puts the stock near the upper end of its one-year range as it approaches a slice of the calendar that has quietly delivered steady upside in prior cycles.
The pattern is grouped by the presidential election cycle, focusing only on midterm election years rather than a simple run of calendar years. That matters for utilities like DTE because midterm summers often sit between early-year policy noise and the more risk-on tone that can emerge as markets look ahead to the year before the presidential election.
Across the 10 midterm-year samples, DTE’s strongest window came in 1986 with a 9.77% net gain, while 1998 was the softest at 1.84%. In every case the trade direction was long, and even the weaker years still finished positive by the end of the 51 trading days. Average profit across all years is 5%, which lines up closely with the 5.05% average for winners because there were no losing windows in the sample.
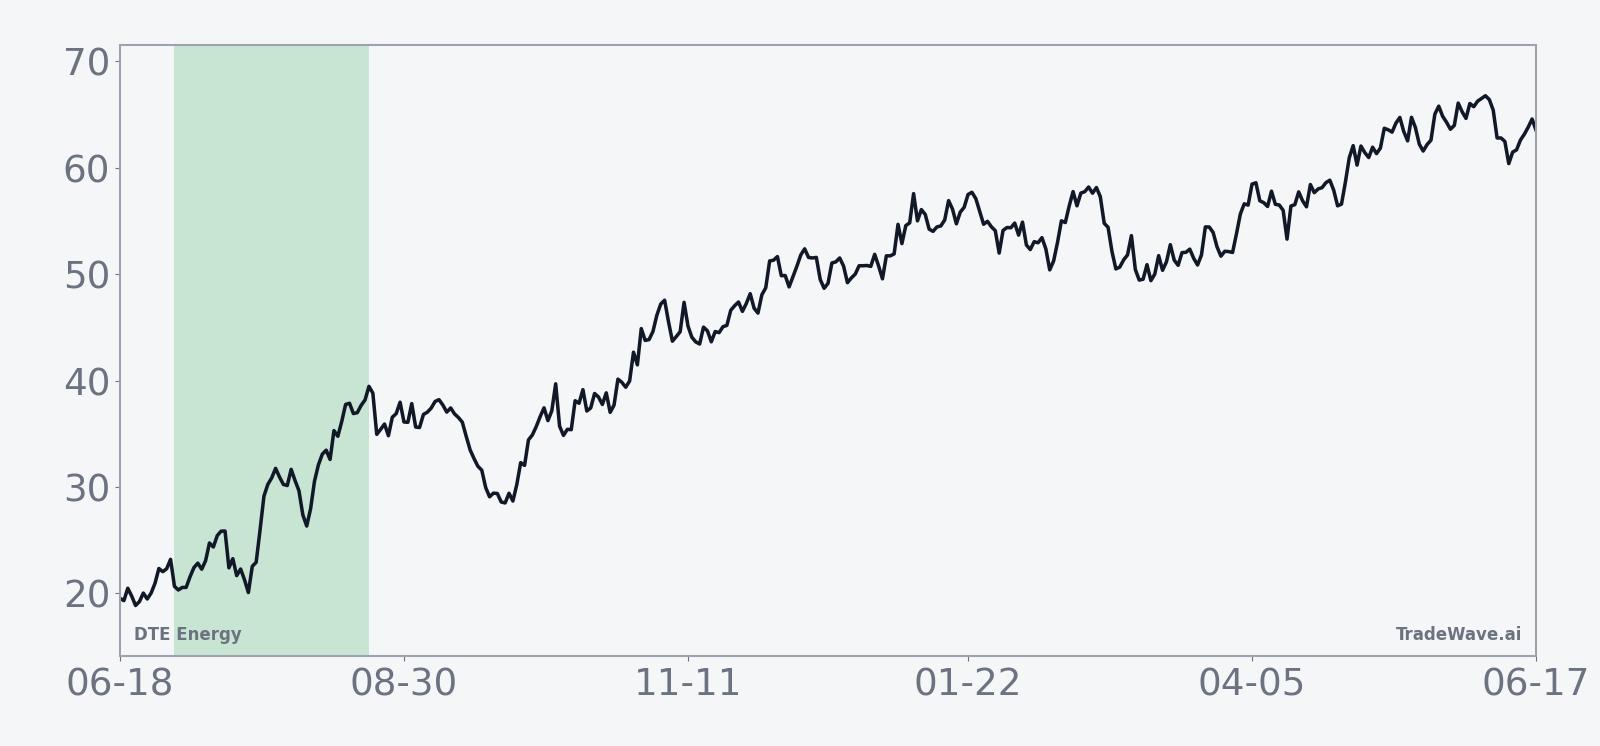
The historical seasonal trend line slopes higher through most of the window, with gains tending to build rather than spike and fade. That suggests a pattern where rallies often develop over several weeks instead of hinging on a single event day.
Intraperiod swings tell a more detailed story about how far DTE has typically run and how deep drawdowns have gone before those gains locked in.
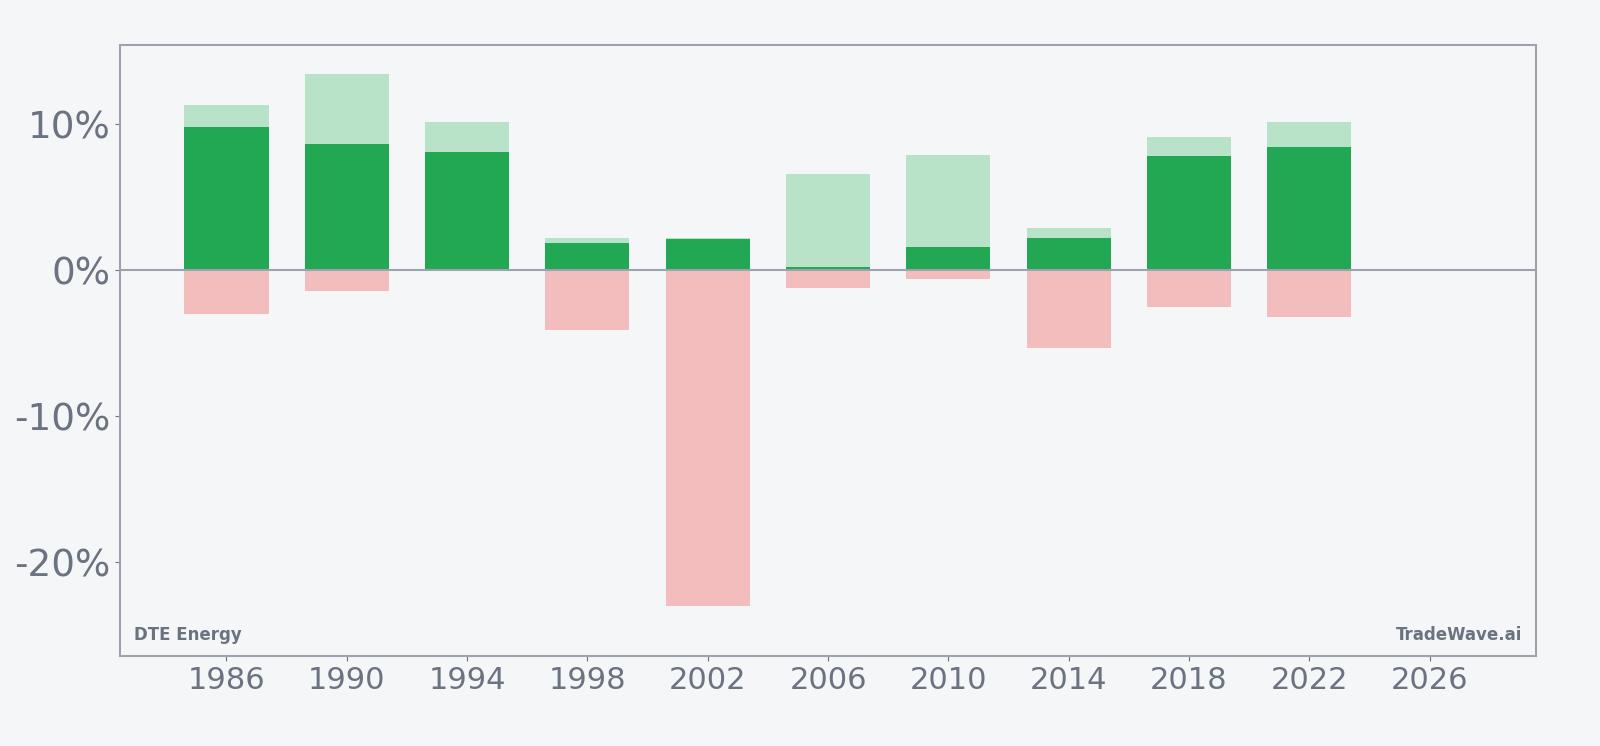
Maximum favorable moves have often stretched into the high single digits or low double digits, with several years posting peak run-ups above 10% before the window closed. At the same time, maximum adverse excursions have occasionally been sharp, including a roughly 23% intraperiod drawdown in 2002 before the stock still finished the window higher. That mix of strong upside potential and sometimes deep interim pullbacks is captured in the TradeWave Ratio of 1.74, which measures how far price typically travels in the trade direction within the window, and in a Sharpe ratio of 1.2 based on end-of-window outcomes.
History does not guarantee future results; even in a perfect 10-for-10 window, adverse excursions can be large and uncomfortable before the pattern resolves higher.
The key takeaway is simple: in the last 10 midterm election years, this specific 51-day summer stretch has been a clean sweep for DTE bulls, with every window finishing in the green.
Why does DTE Energy (DTE) follow this seasonal pattern?
This midterm-year summer pattern may reflect a mix of sector rotation and policy timing. Utilities often see steadier flows when investors look for defensive yield as Washington debates budgets and regulation in the middle of the presidential cycle, and those debates frequently intensify around midyear. For DTE specifically, the window also lines up with peak cooling demand in its service territory, which can support earnings expectations and keep the stock in favor during this part of the calendar.
What is driving DTE Energy (DTE) today?
DTE Energy last traded at 146.49, down 1.6% on the session, with the stock up 2.82% over the past month and sitting between a 52-week low of about 122.84 and a high of 153.72.[1] Trading volume of roughly 581,000 shares came in below the 20-day average of about 1.40 million, suggesting the pullback was more about light positioning than a rush for the exits.[1]
In July 2025, DTE reported adjusted earnings per share of $1.36 for the June quarter, slightly below one analyst estimate of $1.40, while reaffirming full-year 2025 profit guidance of $7.09 to $7.23 per share and noting that electric segment earnings rose year-on-year.[1] In the same period, company executives highlighted advanced talks to supply more than 3 gigawatts of power to Big Tech data centers, with some commentary pointing to as much as 7 gigawatts of potential new load that would require battery storage and possibly new gas-fired generation over time.[1][2] That AI-driven data center demand theme has since become a central macro story for regulated utilities, framing DTE as a potential beneficiary of long-duration infrastructure spending rather than a pure rate-sensitive bond proxy.[1]
Short interest has been modest, with one snapshot citing a value of 1.88% of float, but without clear evidence of a sustained build or squeeze dynamic around the stock.[2] That leaves the near-term tape driven more by rate expectations, sector flows and the evolving narrative around data center power demand than by aggressive positioning on either side.
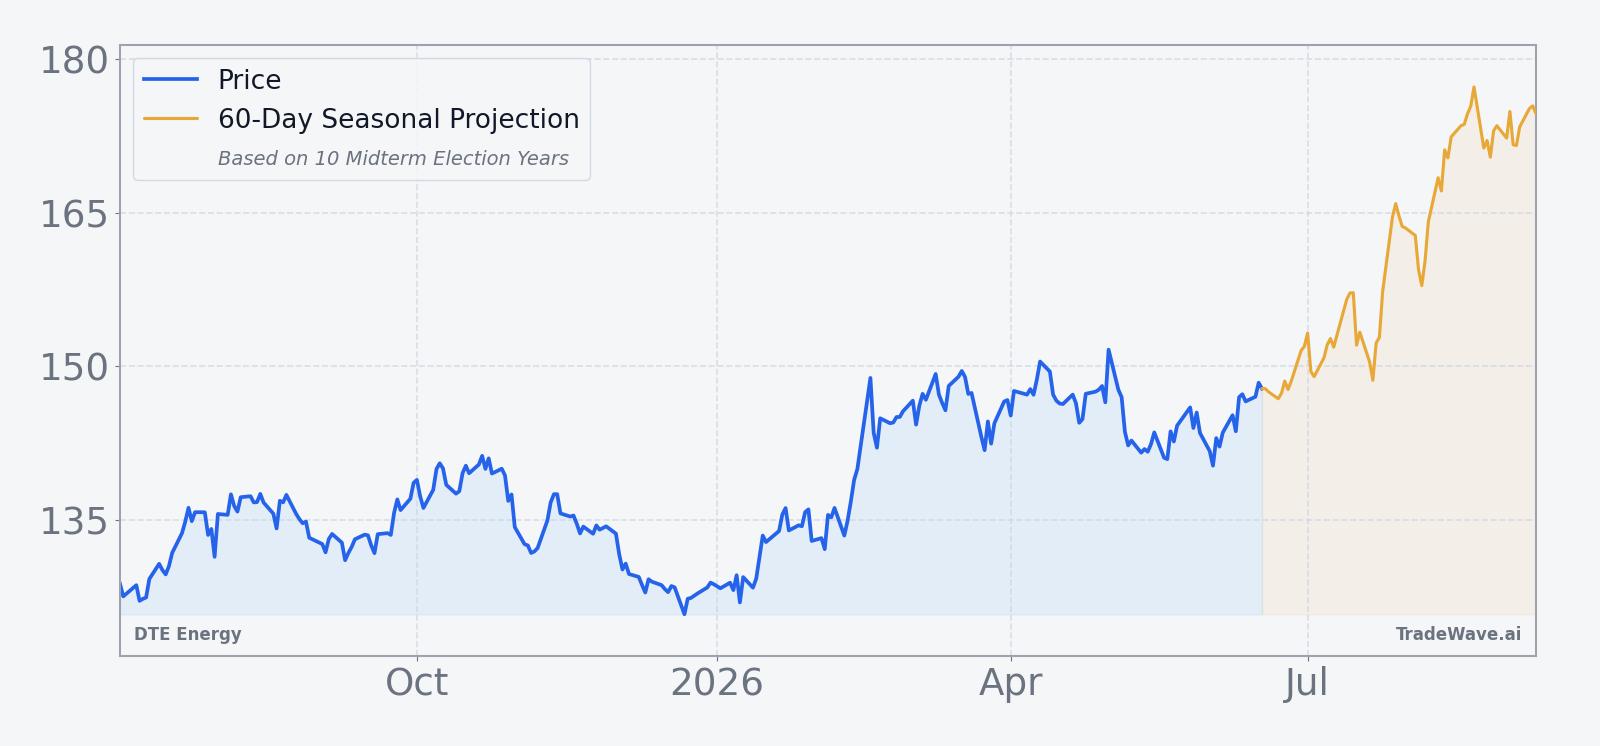
The chart below shows how that backdrop has played out in price terms over the past year, alongside a 60-day seasonal projection.
What should traders watch as this DTE Energy seasonal window approaches?
The first marker is timing: the 51-day window opens on Jul 2, so price action in the final two weeks of June will set the starting posture. A push back toward the 153.72 high before the window begins would mean the pattern is starting from strength, while a deeper pullback toward the mid-140s would echo several past years where DTE dipped early before grinding higher.[1]
Second, watch how the AI data center narrative evolves on the policy calendar. Any new disclosures on long-term power contracts, storage build-outs or regulatory approvals for new generation could intersect with this historically strong stretch and either reinforce or blunt the usual DTE seasonal trend.[1][2] For a regulated utility, clarity on cost recovery and rate treatment can matter as much as headline megawatt numbers.
Third, monitor intraperiod volatility once the window opens. In prior cycles, some of the best eventual gains came after sizable drawdowns, including that roughly 23% adverse move in 2002 before the stock still finished higher. Traders watching this DTE Energy trading window may focus on whether early dips stay within the historical MAE range or break below it, which would signal a departure from the usual pattern.
Finally, keep an eye on sector flows and rates. If utilities see renewed inflows as investors balance AI infrastructure enthusiasm with defensive yield, that could align with the bullish DTE seasonal trend. If instead higher yields pressure the group, a softer tape during a historically strong window would be an early sign that this midterm-year pattern is losing some of its punch.
Sources
About this seasonal analysis
Seasonal pattern data is sourced from TradeWave.ai, which analyzes historical price behavior across annual calendar windows going back up to 30 years. Read the full data methodology or the book The 100-Year Pattern by Afshin Moshrefi (2026 edition). Past performance of seasonal patterns does not guarantee future results. This article is for informational purposes only and does not constitute investment advice.