Altria (MO) Has Rallied in 9 of 10 Midterm Summers, Averaging 8.71% Gains in Winners
Altria is heading into a historically strong 58-day midterm-year seasonal window just as the stock trades near a 52-week high and investors weigh pricing power against shrinking cigarette volumes.

What is the seasonal pattern for Altria (MO)?
Altria has risen in 9 of 10 midterm-year summer windows during this 58-day stretch, with an average gain of 8.71% in winning years.
- 9 for 10 in this window, with winning years averaging 8.71% gains and only one small losing year.
- The upcoming 58-day window starts Jun 22, 2026 and covers the heart of the midterm-year summer for Altria.
- Percent Profitable stands at 90%, with 9 winners and 1 loser across the last 10 midterm election years.
- Including all years, the average outcome is an 8% gain, showing that losses have historically been shallow.
- Intraperiod swings have featured solid upside runs alongside manageable drawdowns, pointing to a bullish but active trading window.
- The pattern aligns with a long trade direction, reinforcing Altria’s tendency to grind higher in this part of the election cycle.
According to historical data from TradeWave.ai, this midterm-year summer stretch has behaved very differently from an average month on the calendar for Altria. The next section walks through how that pattern has played out in prior cycles and what it means for the upcoming 58-day window.
How has Altria (MO) traded in past midterm-year summer windows?
Altria has risen in 9 of the last 10 midterm election years during the 58 trading days starting Jun 22, with winning years averaging 8.71% gains. Today the stock closed at $69.86, leaving it about 3.5% below its 52-week high of $72.38 and well above the 52-week low near $49.87. That combination of a strong historical summer pattern and a price sitting close to the top of its one-year range gives this upcoming window unusual weight for investors watching the MO seasonal trend.
Because this pattern is grouped by the presidential election cycle, it reflects how Altria has behaved specifically in the year before the presidential election when policy debate and regulatory noise often pick up. Pattern phase equals the last 10 midterm election years, while the calendar phase is the current midterm election year, so the upcoming window sits at the handoff into the historically more supportive pre-election environment for many defensive, cash-generative stocks.
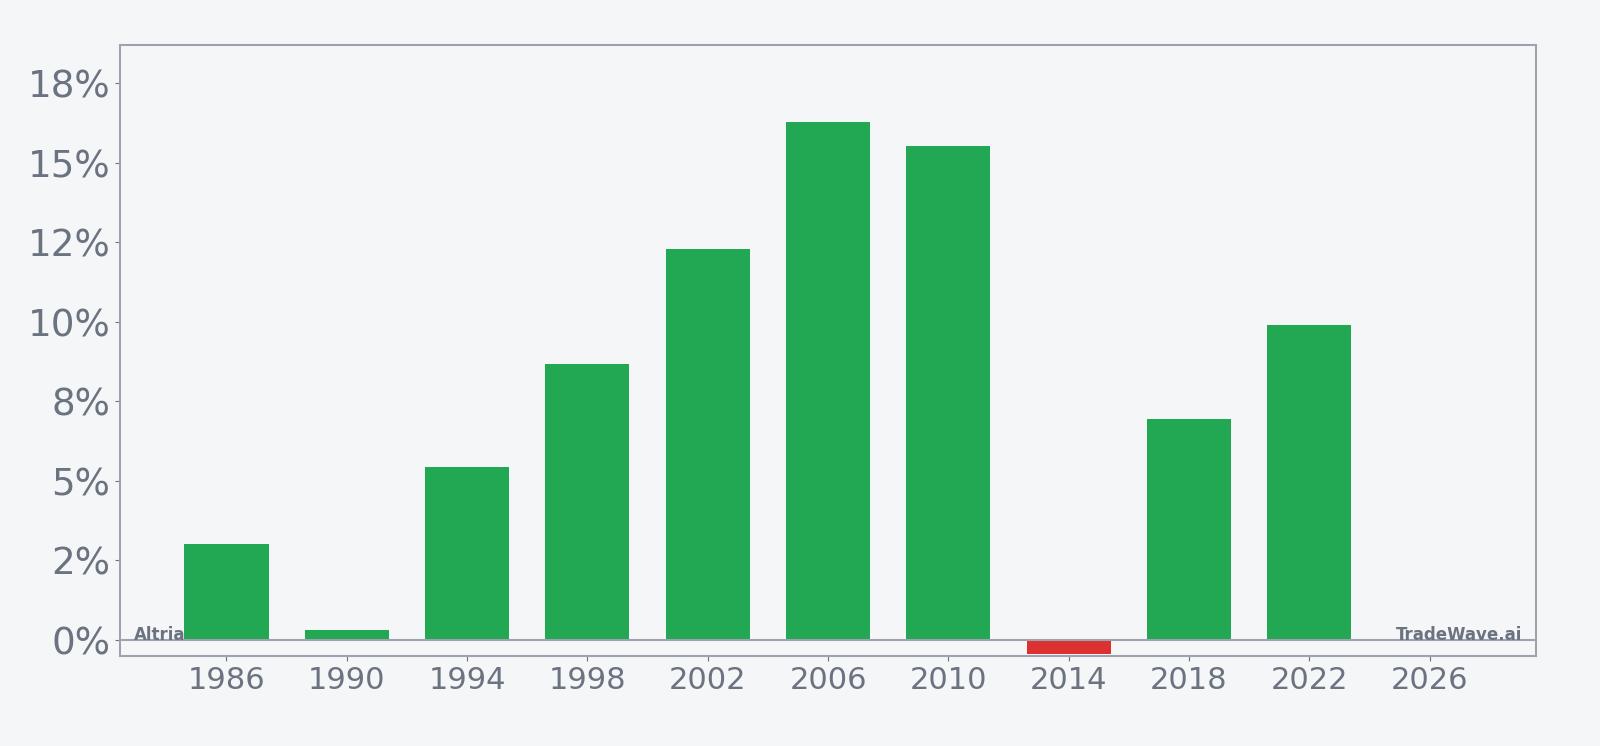
Across those 10 midterm-year samples, the long trade direction has been rewarded far more often than not. Percent Profitable is 90%, with 9 winners and just 1 loser, and the all-years average outcome of 8% shows that the lone down year did not meaningfully dent the overall profile. The weakest instance was 2014, when the stock slipped only 0.45% over the window, while stronger years such as 2006 and 2010 posted double-digit gains of 16.27% and 15.52% respectively.
The gap between Avg Profit of 8.71% in winning years and Avg Profit - All of 8% tells the same story in a different way. When this Altria trading window has worked, it has tended to deliver mid- to high-single-digit gains, and the one losing year was shallow enough that it barely pulled down the long-run average. That is unusual consistency for a single 58-day slice of the calendar.
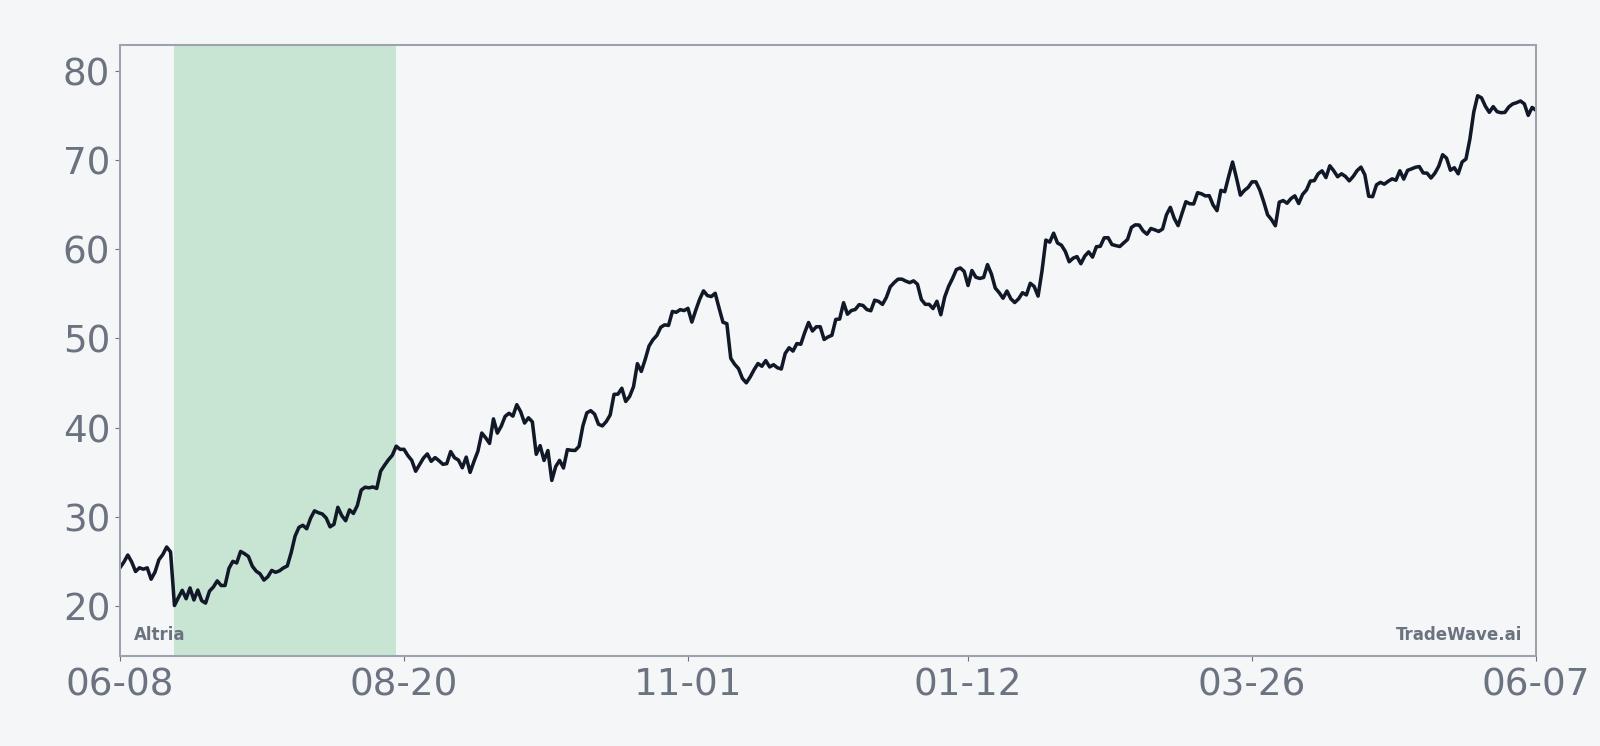
The historical seasonal average trend line slopes higher through most of the window, with gains tending to build rather than spike and fade. In several years, including 2006, 2010 and 2022, the maximum favorable move came late in the window, which fits a pattern of steady accumulation in a high-yield defensive name as the midterm year gives way to the year before the presidential election.
Year-by-year bars that combine net results with peak run-ups and worst drawdowns show how much room Altria has historically had to move inside this window.
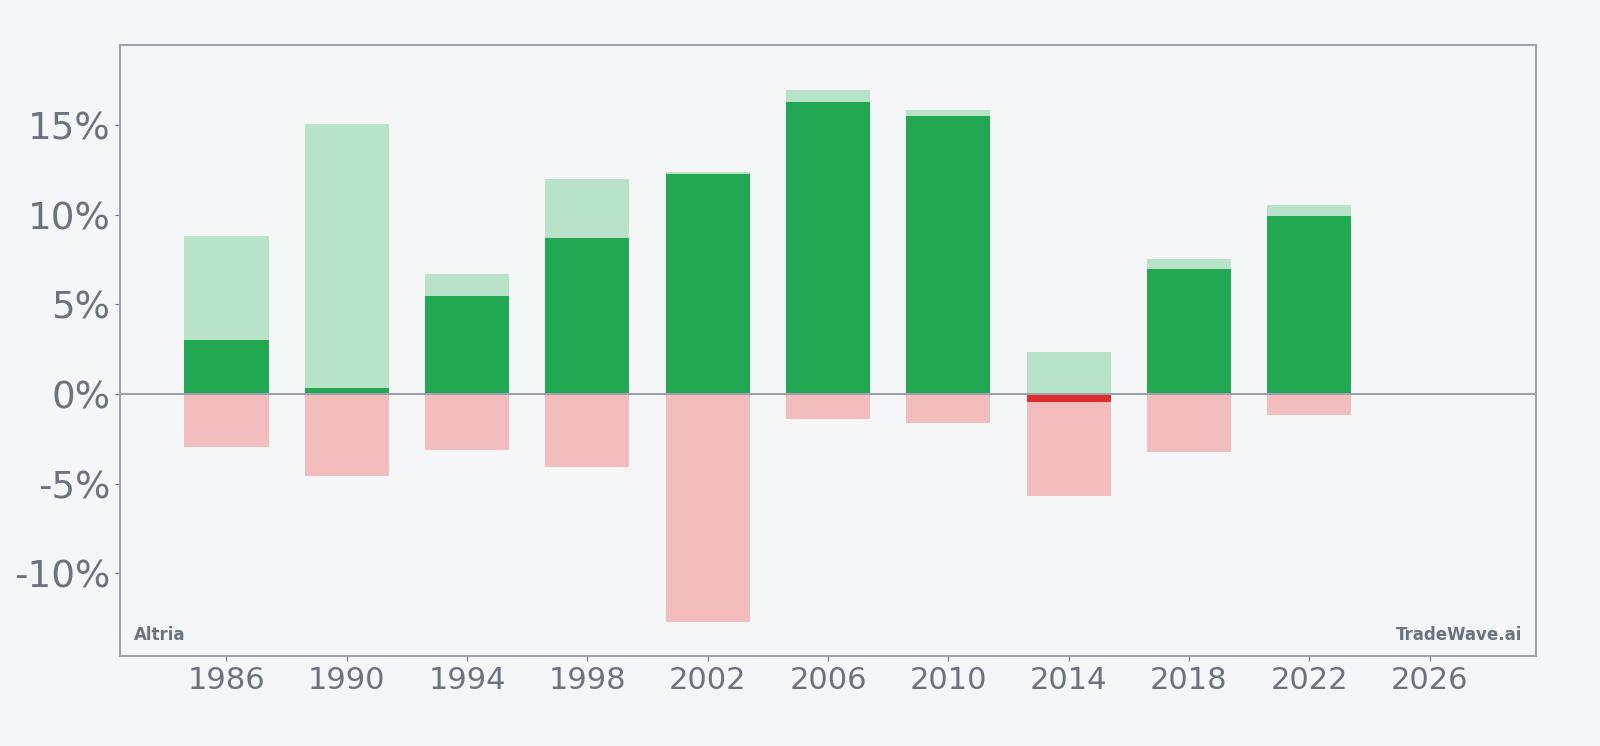
The maximum favorable excursions in winning years have often run into the low- to mid-teens, while maximum adverse excursions have generally stayed in the low single digits, apart from 2002 when the worst drawdown reached about 12.72% before the trade finished higher. That mix of solid upside potential and usually contained downside is reflected in a TradeWave Ratio of 2.23 and a Sharpe ratio of 1.22, which together point to a historically attractive risk-reward profile for long exposure in this specific Altria seasonal window.
History does not guarantee future results, and even in winning windows the worst intraperiod drawdown (MAE) can be large enough to challenge risk limits before gains materialize.
Why does Altria (MO) follow this seasonal pattern?
One likely driver is the way the presidential election cycle shapes risk appetite for high-yield, defensive stocks like Altria. As midterm-year uncertainty peaks and investors look ahead to the year before the presidential election, portfolio managers often rotate toward stable cash generators, which can favor this 58-day summer stretch. The pattern may also reflect how Altria’s earnings calendar and dividend expectations cluster around midyear, encouraging incremental buying as investors position for income and policy headlines at the same time.
What is driving Altria (MO) today?
Altria shares inched higher on Wednesday, closing at $69.86, up 0.38% on the day, with intraday trading between $69.44 and $70.88. The stock sits about 3.5% below its 52-week high of $72.38 and well above its 50-day moving average of $67.75, after a one-month pullback of roughly 1.92% on lighter volume than the 20-day average of about 7.8 million shares. That leaves MO consolidating near the top of its one-year range as traders digest a strong first quarter and look ahead to the next leg of the tobacco sector’s smoke-free transition.
On Apr 30, 2026, Altria reported that first-quarter sales rose as higher cigarette prices offset lower shipment volumes, with profit of $2.18 billion, or $1.30 per share, underscoring the company’s pricing power even as the core smokable segment shrinks.[1] Management has paired that with guidance calling for 2.5% to 5.5% EPS growth in 2026 and a mid-single-digit earnings compound annual growth rate through 2028, supported by progressive dividend increases and ongoing cost discipline.[1] The backdrop is still challenging: cigarette shipment volumes continue to decline, and the company faces competition from illicit e-vapor products and pressure on consumer spending, which keeps the debate alive over whether MO is a value play or a yield trap in a structurally shrinking category.[1][2]
Sector commentary has highlighted Altria’s push into smoke-free products, including oral nicotine pouches and energy-focused offerings, though these lines still contribute only a small share of revenue compared with Marlboro cigarettes.[2] That leaves the stock trading as a classic cash-flow and dividend story, with investors weighing the durability of pricing power against regulatory risk and the pace of the smoke-free transition. In this context, the upcoming midterm-year seasonal window is less about predicting a breakout and more about understanding when the stock has historically been rewarded for those defensive traits.
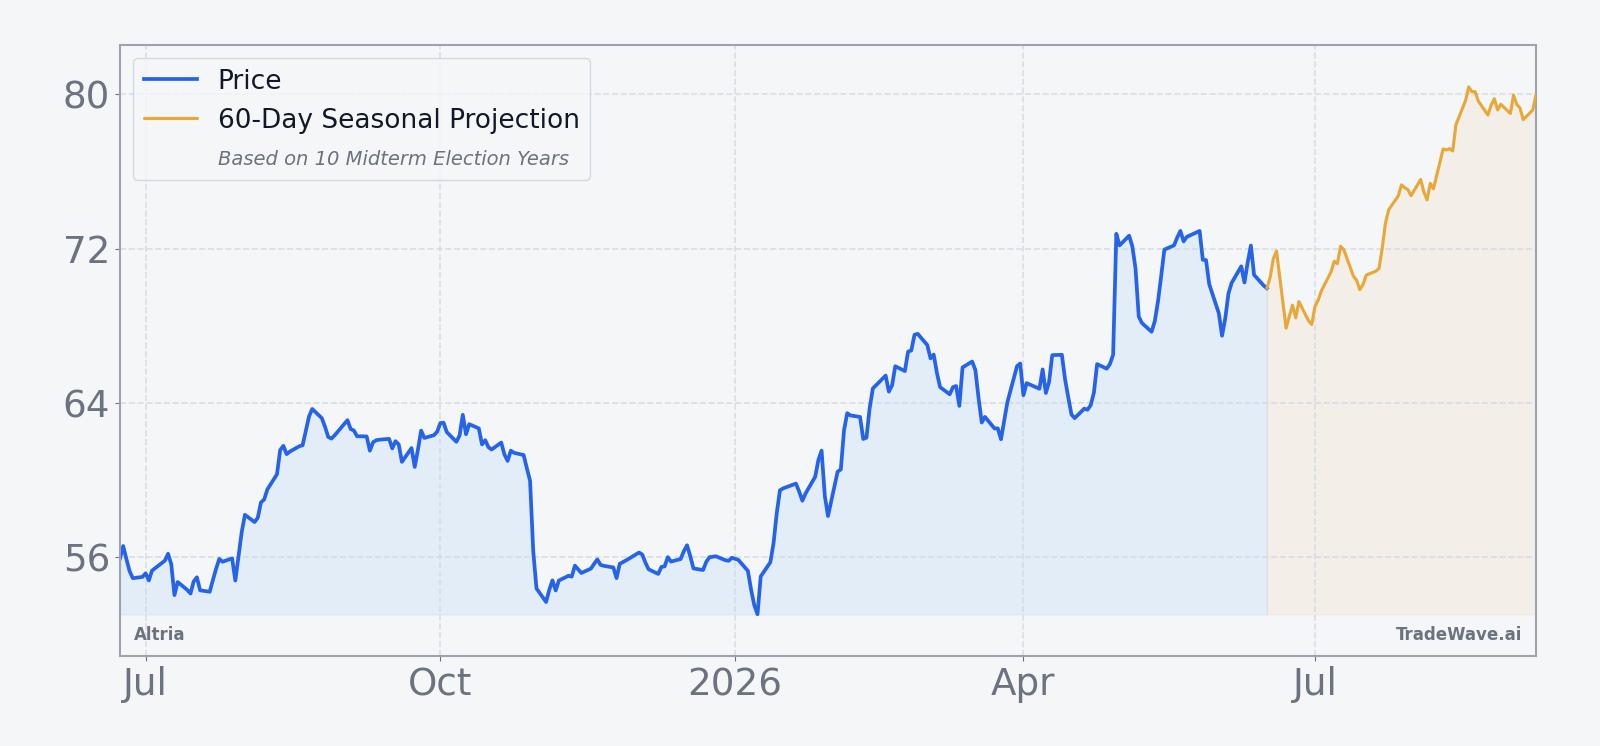
The chart below situates the latest move in its recent multi-month context alongside a 60-day seasonal projection.
What should traders watch in this Altria seasonal window?
First, the calendar: the 58-day window beginning Jun 22 runs through late August, overlapping a period when policy debate and regulatory chatter around tobacco and nicotine products often intensify in midterm election years. Historically, Altria has tended to grind higher through this stretch, so traders will be watching whether the stock can hold above its 50-day moving average and challenge the 52-week high near $72.38 as the window unfolds.
Second, earnings and guidance updates will matter for how closely this cycle tracks the historical pattern. Any signs that pricing can continue to offset volume declines, or that smoke-free products are gaining traction faster than expected, would fit the profile of prior winning years in this Altria trading window.[1][2] Conversely, a break below recent support with no obvious company-specific shock would be an early sign that this midterm-year pattern is deviating from script.
Finally, traders should keep an eye on volume and volatility relative to the historical profile. Past midterm-year windows have delivered solid maximum favorable moves with generally contained drawdowns, but the 2002 sample shows that intraperiod downside can still be sharp before a trade finishes higher. If this summer’s tape features rising volume on up days and muted selling pressure on pullbacks, it would echo the stronger historical years; a surge in downside volume or regulatory headlines that hit the whole sector would argue for more caution even inside a historically bullish seasonal window.[1][2]
Sources
- [1] The Wall Street Journal, "Altria Sales Rise, Boosted by Higher Cigarette Prices" (Apr 30, 2026).
- [2] Forbes, "Is Altria Stock A Value Play Or A Yield Trap At $60?" (Jan 30, 2026).
- [3] Seeking Alpha, "Altria aims for 'progressive' dividend rate growth" (Jan 29, 2026).
- [4] The Wall Street Journal, "Altria Stock at 6-Year High After Outlook Lift" (Jul 30, 2025).
About this seasonal analysis
Seasonal pattern data is sourced from TradeWave.ai, which analyzes historical price behavior across annual calendar windows going back up to 30 years. Read the full data methodology or the book The 100-Year Pattern by Afshin Moshrefi (2026 edition). Past performance of seasonal patterns does not guarantee future results. This article is for informational purposes only and does not constitute investment advice.