IBM Near Record Highs After Perfect Midterm Summer Rally Streak
IBM is trading near record territory after a sharp June surge, just as a 46-day midterm-year summer window that has never produced a loss comes back onto the calendar.

What is the seasonal pattern for IBM (IBM)?
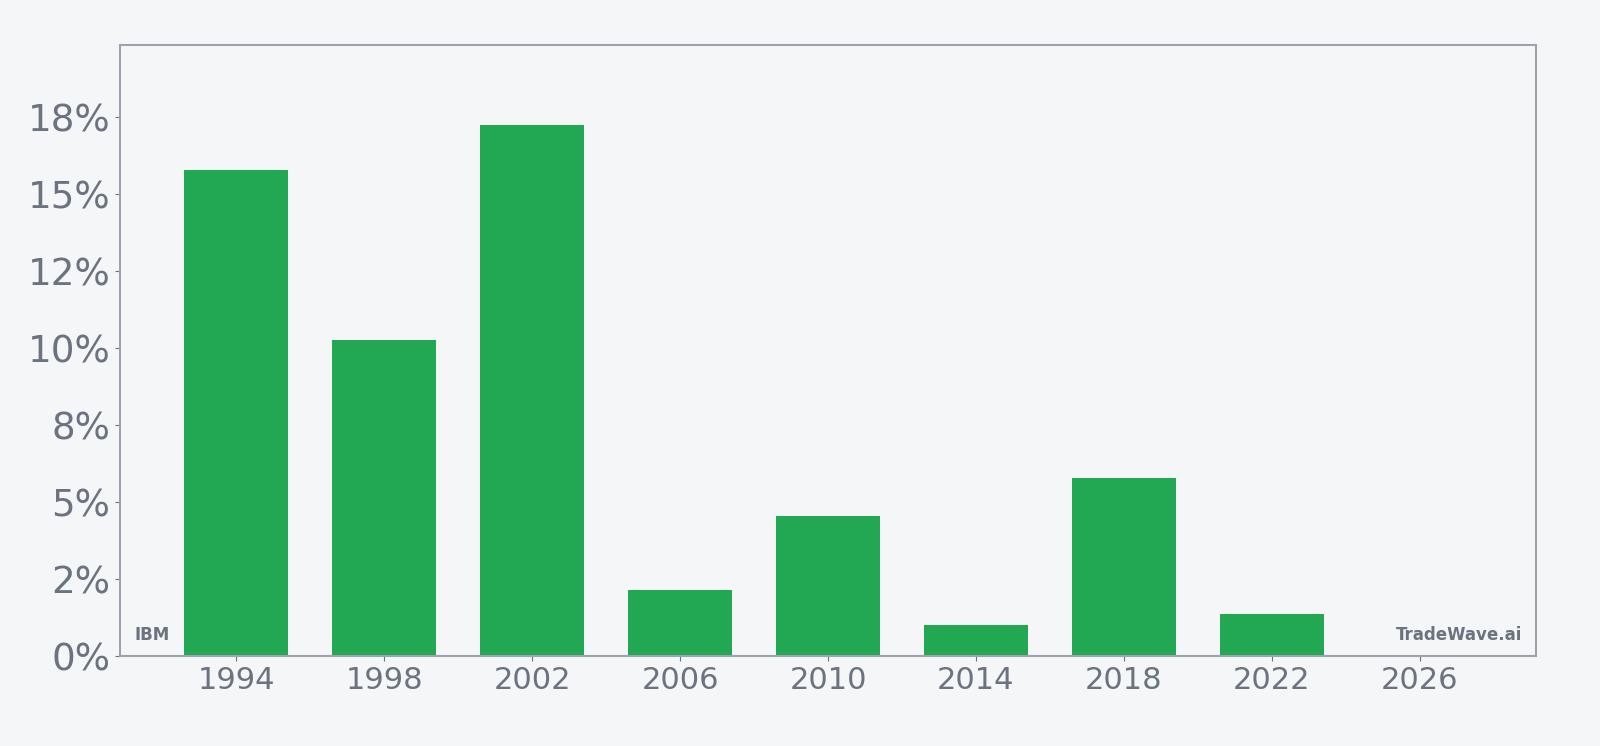
IBM has risen in 8 of 8 midterm-year summer windows starting around Jul 3 since 1994, with an average gain of 7.27% in winning years.
- 8 for 8 in this window, with average winner gains of 7.27% across the last eight midterm election years.
- The upcoming 46-day trading window begins Jul 3, 2026 and has historically been a bullish IBM seasonal trend.
- Percent Profitable is 100%, with 8 winners and 0 losers in the historical sample.
- Cumulative return across those eight windows totals 73%, with a median gain of 5.17%.
- The TradeWave Ratio of 1.3 suggests IBM typically travels meaningfully in the long direction during this IBM trading window.
- Intraperiod swings have included adverse moves as deep as about 9% in some years, underscoring real drawdown risk even in a perfect win record.
According to historical data from TradeWave.ai, this midterm-year summer stretch has behaved very differently from an average month on the calendar for IBM, and the next iteration is about to start.
How has IBM (IBM) traded in past midterm-year summer windows?
IBM has risen in 8 of 8 comparable midterm election years during this 46-day summer window, averaging 7.27% gains and delivering a 73% cumulative return across the sample. The next instance begins on Jul 3, 2026, with the stock last changing hands at about $270.81, roughly 18.5% below its 52-week high of $332.46 and well above its 52-week low of $212.34.[9] That combination of a clean historical win streak and a stock that has already run hard into the window is what has seasonal traders paying attention.
Because this pattern is grouped by the presidential election cycle, it only looks at IBM’s behavior in the last eight midterm election years, not every single year since 1994. That matters in 2026, which is itself a midterm election year, since policy uncertainty, spending debates and regulatory noise often cluster in these middle years of the cycle and can shape how large-cap tech and enterprise software names trade.
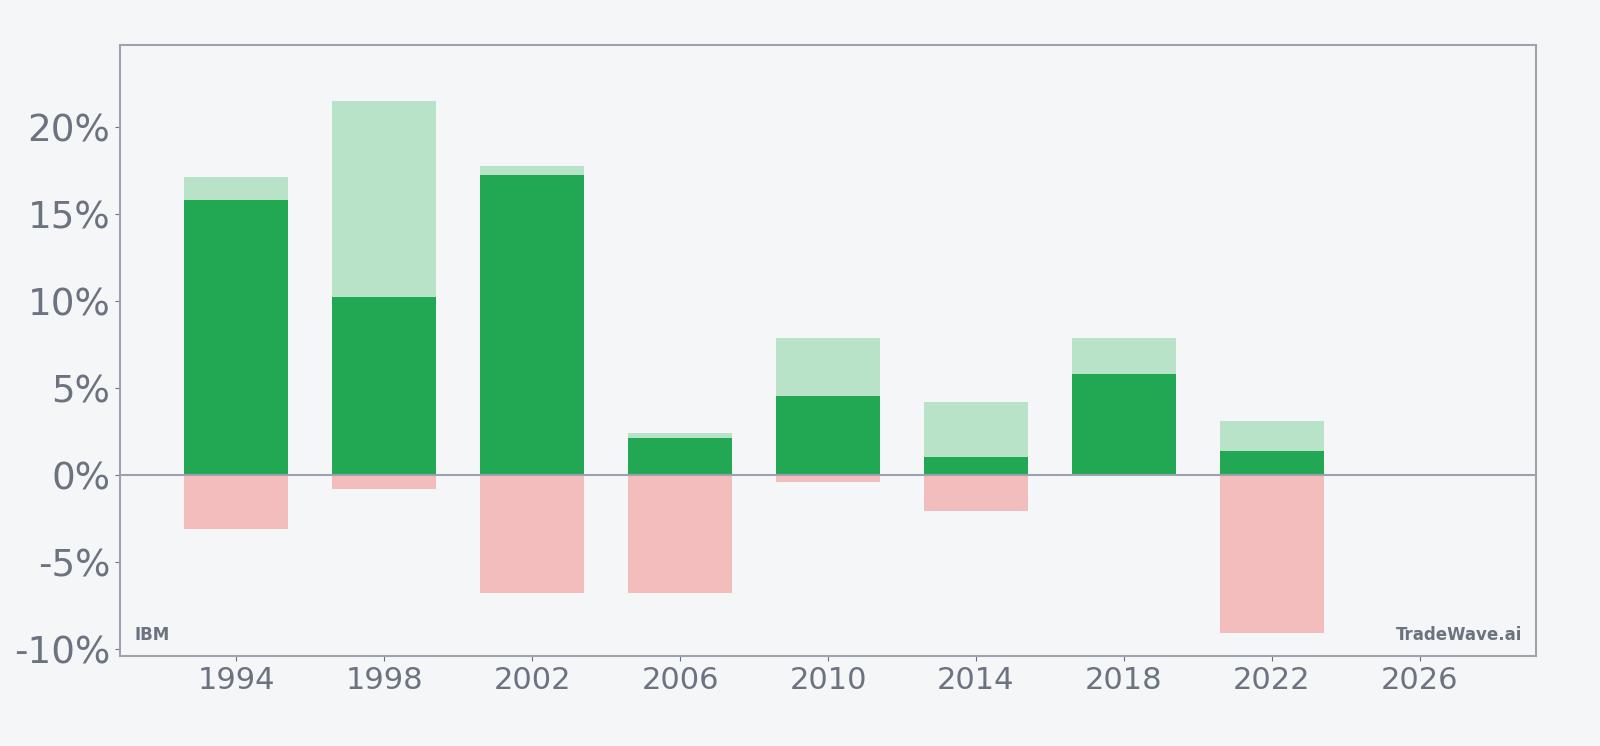
A second view layers in both the best and worst intraperiod swings for each year.
Across the eight historical windows, the average winner gain of 7.27% sits on top of a median outcome of 5.17%, which tells you the distribution has a few strong years but not just one outlier. The best net return came in 2002, when IBM gained 17.25% during the window, while the softest year was 2014 with a 1.03% rise. Even in those weaker years, the stock still finished higher by the end of the 46 trading days.
The maximum favorable move, or peak run-up from the entry price, has reached as high as 21.5% in 1998 and 17.76% in 2002. That shows how explosive this IBM seasonal pattern can be when it lines up with a strong tape. On the downside, the maximum adverse move, or worst drawdown from entry, has been as deep as about 9.08% in 2022 and around 6.8% in both 2002 and 2006, a reminder that even winning windows can feel uncomfortable along the way.
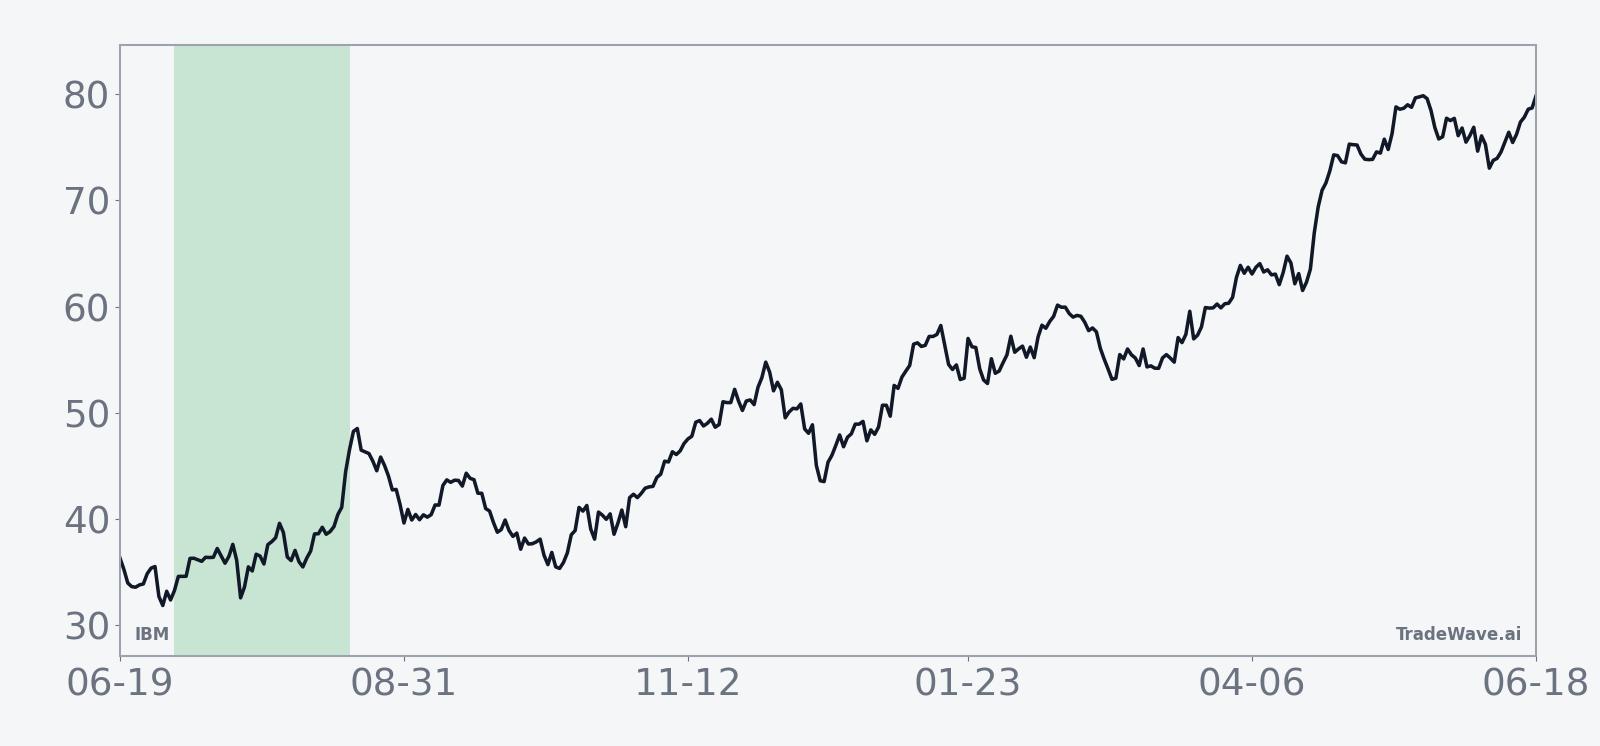
The historical trend curve for this IBM trading window tilts upward fairly steadily rather than spiking only at the end. In several years, including 1994, 1998 and 2010, the stock started to grind higher early in the window and then added incremental gains into the back half. That pattern of early follow-through has made this slice of the calendar attractive for long-only investors who are comfortable with mid-single-digit drawdowns.
Looking at the per-year bars, there is no losing year in the sample, but the size of the swings varies. Some cycles, like 2014 and 2022, delivered low-single-digit net gains with modest maximum favorable moves and noticeable adverse dips. Others, like 1998 and 2002, saw IBM rally double digits while still enduring several percentage points of downside at some point in the 46 days. The Sharpe ratio of 1.05 reflects that the risk-adjusted profile has been solid rather than spectacular, but the 100% hit rate stands out.
History does not guarantee future results; adverse excursions can be large even in winning windows, and a perfect past record does not mean the next iteration will follow the same script.
Why does IBM (IBM) follow this seasonal pattern?
One likely driver is the way IBM’s earnings calendar and guidance cadence line up with midyear, when investors reassess full-year revenue and free-cash-flow targets. Analysts have also pointed to institutional portfolio repositioning around midterm election years, when policy risk and spending priorities become clearer and can favor enterprise software and hybrid-cloud names.[2] This mid-summer stretch may also capture sector rotation into more defensive tech like IBM as investors balance AI enthusiasm with cash-flow stability.
What is driving IBM (IBM) today?
IBM shares closed at $270.56 on Jun 17, up 0.69% on the day, extending a roughly 22.53% one-month surge that has carried the stock to within about 18.5% of its 52-week high and far above its 52-week low.[9] The latest leg of the move followed a volatile first-quarter earnings season in April, when IBM beat on revenue and adjusted EPS but left its 2026 outlook unchanged, a stance that initially sent the stock lower as investors looked for a more aggressive forecast.[3][7]
In April, IBM reported first-quarter 2026 adjusted EPS of $1.91 versus expectations of $1.81 on revenue of $15.9 billion against estimates around $15.7 billion, but the company reiterated guidance for more than 5% constant-currency revenue growth rather than raising it.[3][7] That conservative tone echoed earlier commentary from Oct 2025, when IBM lifted its 2025 revenue outlook to “more than” 5% growth and highlighted a growing AI book of business, yet still saw its stock slip as investors debated how durable the software acceleration would be.[4]
The tone around the name shifted sharply on Jun 1, 2026, when IBM shares jumped about 15% in a single session after a video involving former President Donald Trump resurfaced and a bullish Barclays forecast cut against broader “SaaSpocalypse” fears in software.[9][10] Barclays initiated IBM with an overweight rating and a $350 price target, arguing that the company’s hybrid-cloud, AI and quantum computing exposure left it better positioned than many high-multiple SaaS peers.[10] That call landed just as traders were digesting news that IBM stands to receive roughly $1 billion in U.S. Commerce Department grants for quantum computing, a potential long-term catalyst that sparked heavy options activity with call buyers outnumbering puts by roughly 8 to 1.[8][10]
Macro themes are also working in IBM’s favor. Across multiple reports, analysts have framed IBM as a way to play enterprise AI demand and hybrid cloud without paying the premium multiples attached to some pure-play AI names, citing the Anthropic partnership and WatsonX as key drivers of software and consulting growth.[2][5] At the same time, the prospect of government-backed quantum investment gives IBM a differentiated long-duration story that sits alongside its more mature infrastructure and services businesses.[8][10]
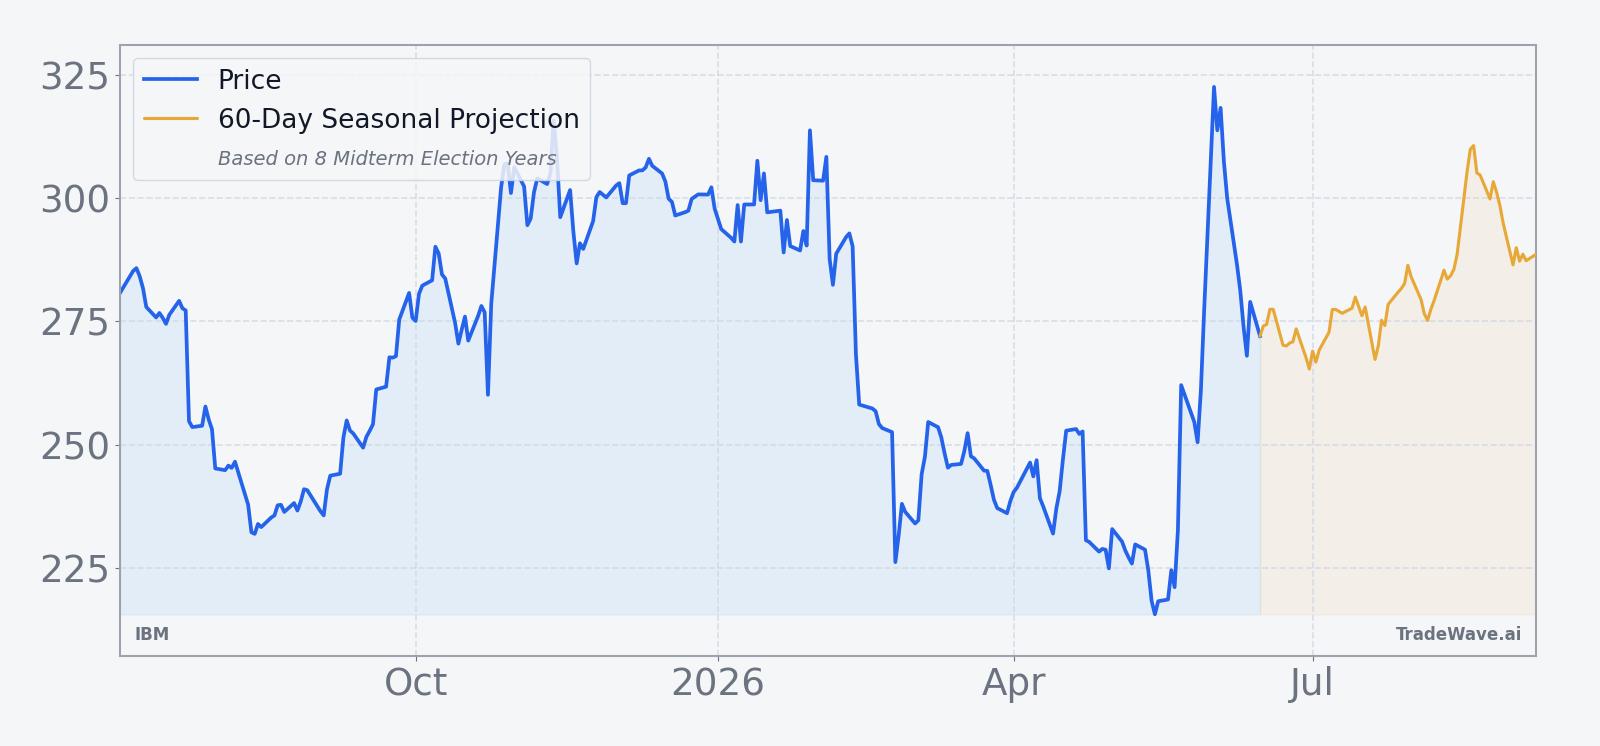
The chart below situates the latest move in its recent multi-month context and overlays the upcoming seasonal projection.
What should traders watch as IBM enters this seasonal window?
First, the calendar. The 46-day IBM seasonal window tied to midterm election years starts on Jul 3 and runs deep into August, a period that often sees thinner liquidity and sharper single-name moves. If IBM follows its historical seasonality, strength early in the window followed by a steady grind higher would be consistent with prior cycles, while a quick break below recent support would mark a clear departure from the pattern.
Second, the policy and macro backdrop. As the midterm election year progresses, investors will be watching for signals on federal tech spending, AI regulation and quantum funding, all of which intersect directly with IBM’s strategic priorities.[5][8] Any shift in tone from Washington on AI or quantum could either reinforce or undercut the historical midterm-year tailwind that this IBM seasonal trend has shown.
Third, options and positioning. The early-June session that saw almost 200,000 options contracts trade, with calls outpacing puts roughly 8 to 1, signaled aggressive bullish positioning tied to the quantum grant and the Barclays call.[8][10] If that call-heavy skew persists or builds as the seasonal window opens, it would suggest traders are leaning into both the historical pattern and the new fundamental story; if it fades or flips toward puts, it would hint that fast money is fading the rally even as the calendar turns into a historically strong stretch.
Finally, price levels. With IBM still well below its 52-week high but far above its 52-week low, how the stock behaves around recent breakout zones during this 46-day window will be key. A pattern of buying dips within the window would rhyme with the last eight midterm election years, while sustained selling pressure or a failure to hold recent gains would be the clearest sign that this time might look different from the backtest.
Sources
- CNBC, "IBM is trying to rebound after results disappointed initially" (Oct 23, 2025)
- MarketWatch, "IBM’s stock is sliding. Here’s why these analysts see an opportunity to buy." (Jul 24, 2025)
- Yahoo Finance, "IBM Stock Tumbles. Solid Quarter Can't Offset Tepid Forecast" (Apr 23, 2026)
- CNBC, "IBM tops third-quarter estimates and lifts guidance, but stock drops" (Oct 22, 2025)
- Forbes, "What’s Happening With IBM Stock?" (Oct 7, 2025)
- MarketWatch, "Why is IBM’s stock down after an earnings beat? Here’s one quibble." (Jul 23, 2025)
- Barron's, "IBM Earnings Beat Estimates. The Stock Is Still Falling." (Apr 22, 2026)
- Yahoo Finance, "IBM shares surge 15% after Trump video resurfaces" (Jun 1, 2026)
- Business Insider, "IBM stock shoots higher after bullish Barclays forecast hits back at SaaSpocalypse fears" (Jun 1, 2026)
- Forbes, "IBM Stock Isn't Dying. It's On Sale" (Feb 24, 2026)
About this seasonal analysis
Seasonal pattern data is sourced from TradeWave.ai, which analyzes historical price behavior across annual calendar windows going back up to 30 years. Read the full data methodology or the book The 100-Year Pattern by Afshin Moshrefi (2026 edition). Past performance of seasonal patterns does not guarantee future results. This article is for informational purposes only and does not constitute investment advice.