Amgen (AMGN) Has Rallied in 10 of 10 Midterm Summers, Averaging 7.18% Gains in 26 Days
Amgen is heading toward a historically strong 26-day summer trading window even as the stock trades below its 52-week high and investors focus on its obesity-drug pipeline.

What is the seasonal pattern for Amgen (AMGN)?
Amgen has risen in 10 of 10 midterm-year summer windows starting Jul 1, with an average gain of 7.18% in winning years.
- 10 for 10 in this window, with Amgen averaging 7.18% gains across all winning years over the last 10 midterm election cycles.
- The upcoming 26-day trading window begins Jul 1 and has historically favored long positions in Amgen during midterm election years.
- Percent Profitable is 100%, with 10 winners and 0 losers in this specific Amgen seasonal trend.
- Median gain in the window is 5.27%, pointing to a solid central tendency rather than a pattern driven only by outliers.
- The TradeWave Ratio of 1.42 suggests Amgen typically travels meaningfully in the trade direction within the window, not just at the close.
- Even with the strong record, individual years have seen sizable intraperiod drawdowns, reminding traders that volatility can be part of this biotech seasonal outlook.
According to historical data from TradeWave.ai, Amgen’s midterm-year summer behavior has followed a distinct pattern that differs from its average year-round trading. The next section looks at how that pattern has played out and what the upcoming window could mean for traders watching AMGN.
How has Amgen (AMGN) traded in this midterm-year summer window?
Amgen has posted gains in every one of the last 10 midterm election years during the 26-day window that starts on Jul 1, averaging a 7.18% advance for long positions. Shares finished Tuesday at 347.80, down 0.8% on the day and about 9.8% below their 52-week high near 385.45.[4]
Because this pattern is grouped by the presidential election cycle, it reflects how Amgen has behaved in the middle year of the four-year White House rhythm, not just in random Jul windows. Midterm election years often bring policy noise and healthcare headlines, and this Amgen trading window sits in the mid part of that year, when positioning around regulation and drug pricing can be especially active.
Historically, the trade direction for this setup is long. Percent Profitable is 100%, with 10 winners and 0 losers, and the median gain of 5.27% shows that the AMGN seasonal trend has been consistently positive rather than driven by a single blockbuster year. Average profit of 7.18% across all years lines up with that story of steady upside.
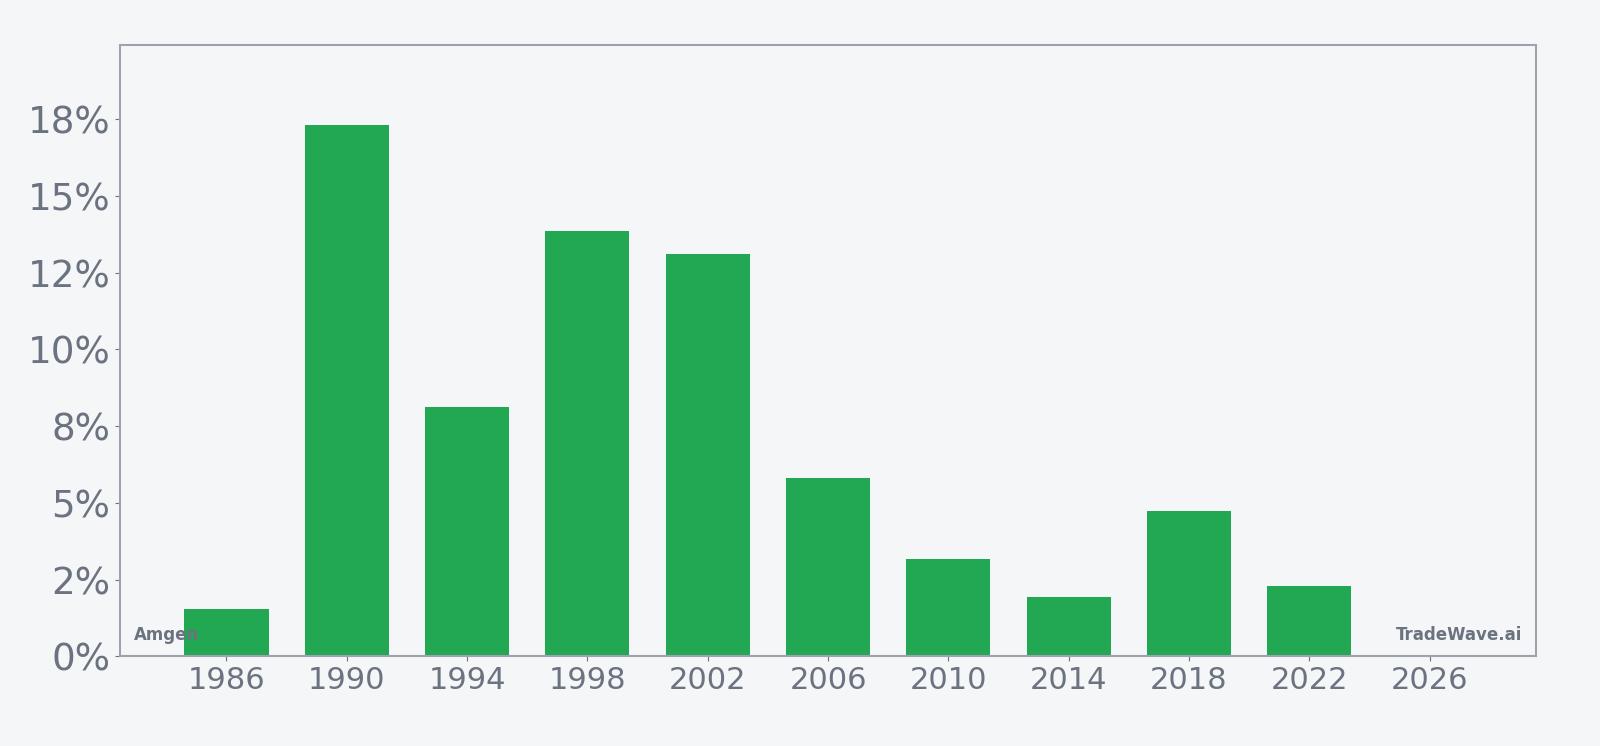
The per-year table shows how that has played out. In 1990, Amgen gained 17.32% in the window, with a maximum favorable move of 17.96% and only a shallow 0.64% intraperiod dip from entry. By contrast, 2002 delivered a 13.09% net gain but came with a worst drawdown of 20.31% before finishing higher, a reminder that even winning years can feel rough in the middle.
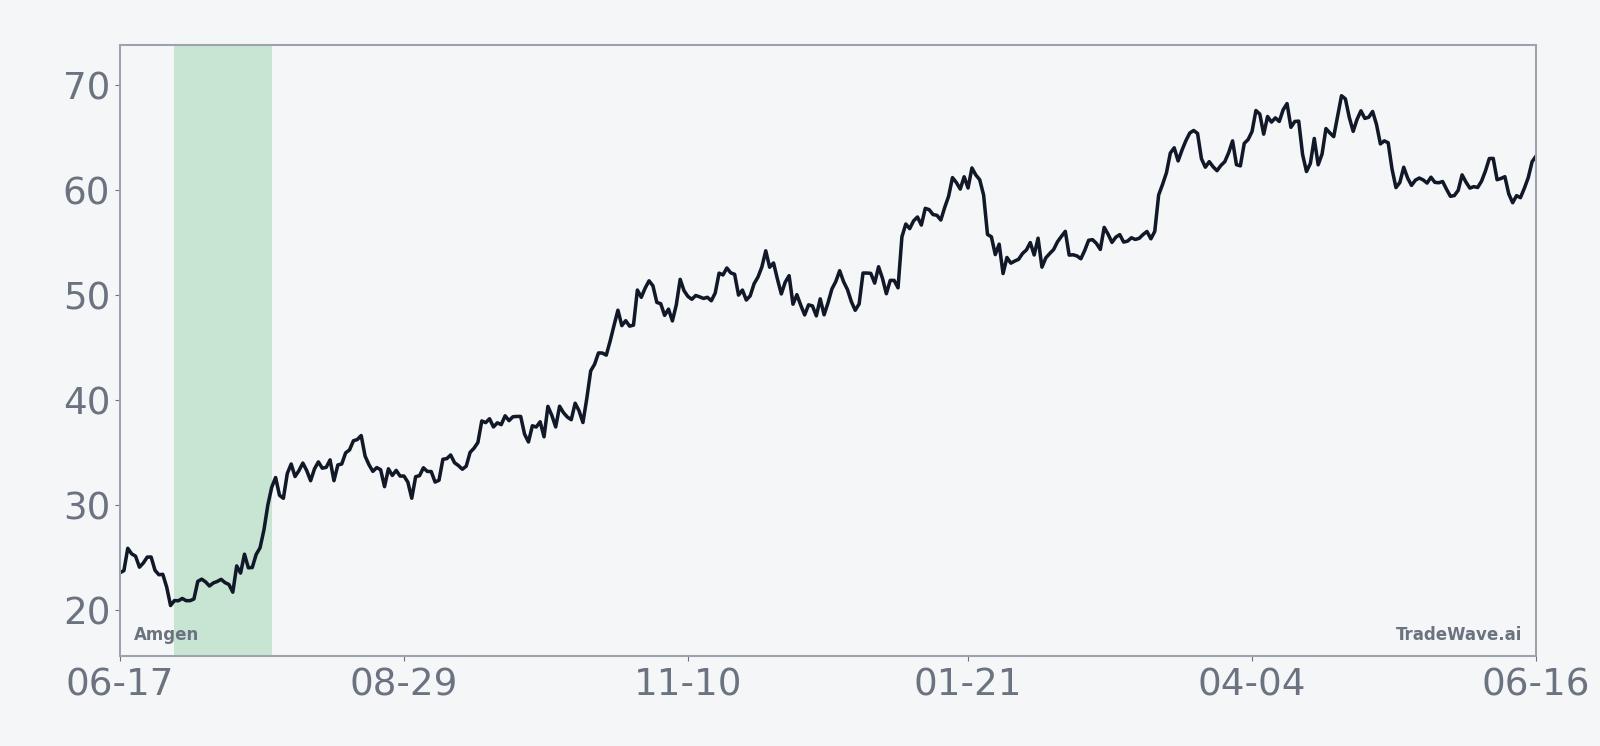
The historical seasonal average trend suggests gains tend to build gradually through the window rather than in a single spike. The curve slopes higher with only modest mid-window dips, which fits a pattern where buyers lean in over several weeks instead of chasing a one-day move.
A closer look at yearly net returns alongside best and worst intraperiod swings shows how upside and downside have coexisted in this Amgen trading window.
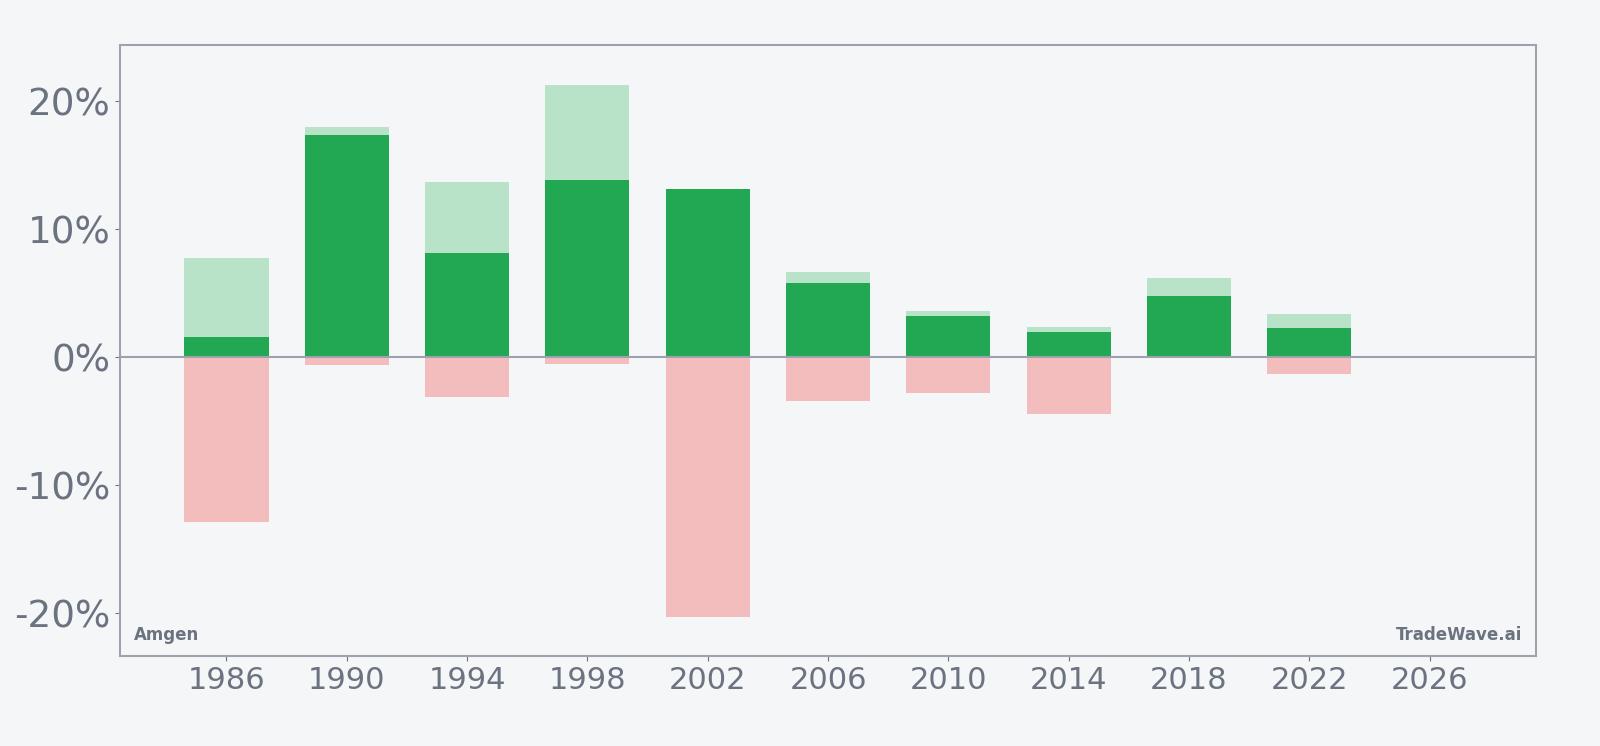
The combined net, maximum favorable move and maximum adverse move bars show a clear pattern: Amgen has usually pushed higher at some point in the window, but the path has not always been smooth. Years like 1986 and 2002 saw double-digit worst drawdowns even as they finished positive, while others such as 1990 and 1998 delivered strong rallies with relatively contained downside.
History does not guarantee future results; adverse excursions can be large even in winning windows, and traders should treat this seasonal pattern as context rather than a forecast.
Why does Amgen (AMGN) follow this seasonal pattern?
One likely driver is the way midterm-year policy debates and healthcare headlines cluster around the summer, which can focus attention on large-cap biotech names like Amgen. Analysts have also pointed to institutional portfolio repositioning in the sector as investors balance defensive cash flows against regulatory risk in the middle of the election cycle.[1] This pattern may also reflect how Amgen’s earnings and R&D updates, including obesity-drug developments, often shape sentiment heading into the back half of the year.[2][3]
What is driving Amgen (AMGN) today?
Amgen closed at 347.80 on Tuesday, down 0.8% on the session, after trading between 345.87 and 353.66, with volume of about 2.1 million shares against a 20-day average near 2.8 million.[4] The stock is roughly 9.8% below its 52-week high around 385.45 and well above its 52-week low near 252.43, leaving it in the upper half of its one-year range with a 50-day moving average around 337.61 providing nearby support.[4]
Fundamentally, the story is still anchored in earnings growth and the obesity-drug race. In Aug 2025, Amgen reported quarterly revenue of about $9.18 billion, up 9% year over year, and raised its 2025 outlook as it highlighted progress on its experimental weight-loss drug MariTide.[1][3] In Feb 2026, the company followed with fourth-quarter results that beat Wall Street estimates and issued 2026 guidance calling for adjusted EPS of $21.60 to $23.00 on revenue of $37 billion to $38.4 billion, reinforcing the view that obesity treatments could be a major long-term growth driver.[2][4]
Those updates landed against a broader backdrop where analysts have framed obesity drugs as a potential $150 billion market in coming years, with Amgen competing alongside other big pharma names for share.[1] At the same time, the company is spending heavily on R&D while some legacy products face biosimilar competition, a mix that keeps investors focused on execution and margin discipline as the next leg of the obesity-drug cycle unfolds.[1][2]
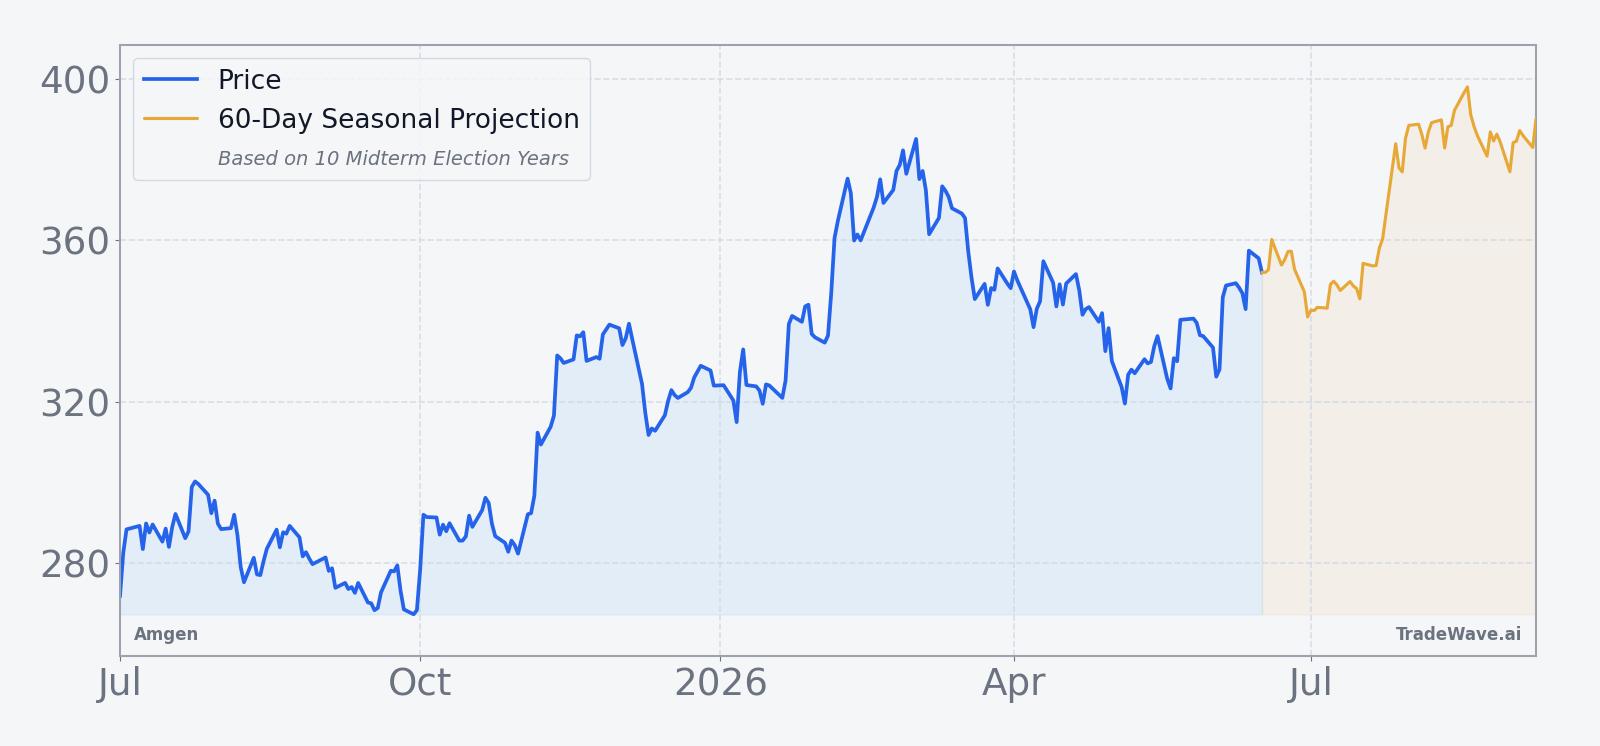
The chart below situates the latest move in its recent multi-month context and overlays a 60-day seasonal projection.
What should traders watch as this Amgen seasonal window approaches?
First, the calendar: the 26-day window begins on Jul 1, so price action in the back half of June will set the starting tone. A drift toward the 50-day moving average near 337.61 would frame the window as a test of medium-term support, while a push back toward the 52-week high around 385.45 would mean the pattern is starting from a stronger base.[4]
Second, watch how Amgen trades relative to the broader biotech and large-cap pharma group. If sector risk appetite improves into July, the historical seasonality could align with a broader bid for defensive growth names tied to obesity drugs and cardiovascular risk reduction.[1] If macro or policy headlines hit healthcare, the same window could feature more of the sharp intraperiod drawdowns that have shown up in past years even when the final result was positive.
Third, keep an eye on any updates around MariTide and the company’s 2026 guidance corridor. While the key mid-stage MariTide data are expected later in 2025, incremental commentary on trial progress, regulatory interactions or competitive dynamics could influence how investors lean into or fade the historical AMGN seasonal trend.[1][2]
Finally, behavior inside the window itself will matter. A pattern where Amgen grinds higher with only shallow pullbacks would echo the smoother years like 1990 and 1998, while a choppy tape with deep intraday or multi-day dips would look more like 1986 or 2002. Either way, traders will be watching whether this midterm-year summer window can extend its 10-for-10 record or whether the next iteration breaks the streak.
Sources
- [1] Reuters, “Amgen profit rises, weight-loss data expected in 4th quarter,” Aug 5, 2025.
- [2] Reuters, “Amgen Q4 results beat Street estimates, company says patients need weight-loss options,” Feb 3, 2026.
- [3] The Wall Street Journal, “Amgen Posts Higher Profit, Revenue On Sales Growth Among Products,” Aug 5, 2025.
- [4] Forbes, “Why Amgen Stock Is Paying Off Big For Long-Term Investors,” Feb 4, 2026.
About this seasonal analysis
Seasonal pattern data is sourced from TradeWave.ai, which analyzes historical price behavior across annual calendar windows going back up to 30 years. Read the full data methodology or the book The 100-Year Pattern by Afshin Moshrefi (2026 edition). Past performance of seasonal patterns does not guarantee future results. This article is for informational purposes only and does not constitute investment advice.