Kroger (KR) Has Rallied in 9 of 10 Midterm Summers, Averaging 7% Gains Over 53 Days
Kroger is heading toward a historically strong 53-day midterm-year seasonal window just as the stock cools from its highs, creating a fresh test of the grocer’s defensive reputation.
What is the seasonal pattern for Kroger (KR)?
Kroger has risen in 9 of 10 years during this midterm-year early-summer window, with an average gain of 7.57% in winning years.
- 9 for 10 in this window, with winning years averaging 7.57% gains over the 53-day stretch.
- Percent Profitable is 90%, with 9 winners and just 1 loser across the last 10 midterm election years.
- The all-years average return, including the lone losing year, is still a solid 7%, pointing to a bullish KR seasonal trend.
- The upcoming window begins Jun 26 and runs 53 trading days, covering much of the summer grocery season.
- Intraperiod swings have been meaningful, with some years showing double-digit drawdowns even when the final result was positive.
- For a defensive grocer, this Kroger trading window has historically combined steady upside with pockets of volatility.
According to historical data from TradeWave.ai, this midterm-year early-summer stretch has behaved very differently from an average month on the calendar for Kroger, and the next iteration is about to open again.
How has Kroger (KR) traded in this midterm-year summer window?
Kroger has rallied in 9 of the last 10 midterm election years during this 53-day window, with winning years averaging 7.57% gains and an all-years average of 7%. The next window begins on Jun 26, with shares last changing hands at about $64 and up roughly 16% year to date, even as the stock trades about 15.9% below its 52-week high of $75.78.[4]
Because this pattern is grouped by the presidential election cycle, it reflects how Kroger has behaved in the last 10 midterm election years rather than in 10 consecutive calendar years. Midterm years often bring policy noise around healthcare, food assistance and tariffs, which can shift flows into or out of defensive consumer staples, so a consistent upside bias in this slice of the calendar stands out for a grocer that already benefits when shoppers trade down.
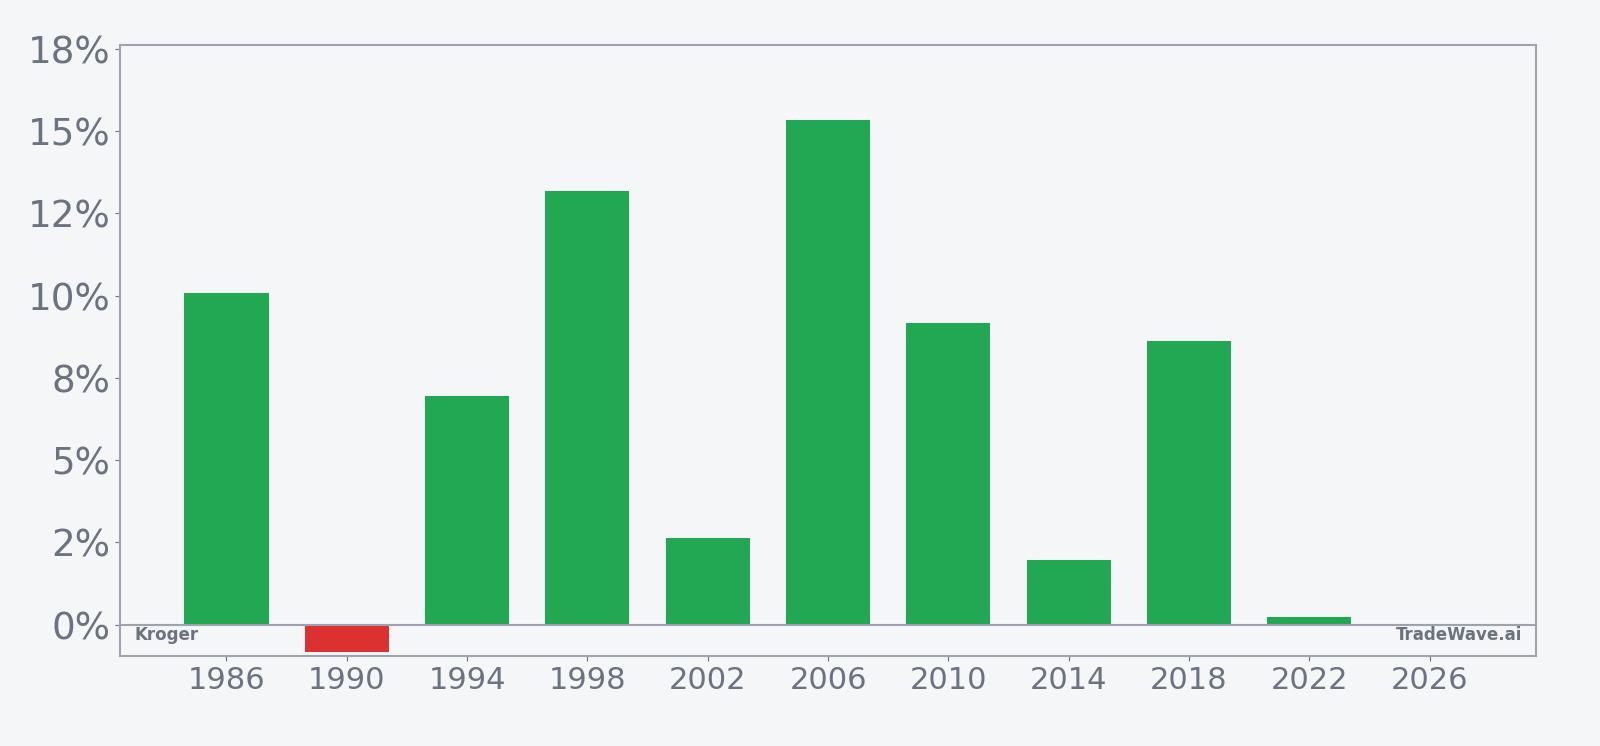
The historical seasonal average trend for this window tilts steadily higher rather than spiking in a single burst. In many of the stronger years, gains built gradually across the full 53 days, which fits a pattern of investors leaning into defensive retail as midyear macro and policy headlines accumulate.
Per-year results show that the long trade direction has been rewarded far more often than not. The strongest year in the sample was 2006, when Kroger gained 15.32% in the window, while 1998 and 2010 also delivered double-digit or near double-digit advances. The lone losing year, 1990, saw a modest 0.84% decline, which is small compared with the typical winning move.
Intraperiod swings have been meaningful even in good years. In 1986, for example, Kroger finished the window up 10.08% but experienced a worst drawdown of 11.92% from the entry point before recovering, while the best run-up reached 12.87%. That combination of double-digit maximum favorable move and double-digit maximum adverse move is a reminder that the path has not been smooth, even when the final outcome favored the long side.
The TradeWave Ratio of 1.85 suggests that, historically, price has often traveled a fair distance in the trade direction within the window, independent of where it closed. Combined with a Sharpe ratio of 1.11 based on end-of-window outcomes, the pattern has delivered a relatively attractive risk-adjusted profile for a single-stock seasonal setup, especially given the defensive nature of the underlying business.
Looking across the cumulative return chart for this window, the gains stack up rather than cancel out. Add it up: an 89% cumulative return across the 10 midterm-year windows, which is a sizable contribution for a stock that many investors treat as a slow-and-steady grocery play.
Yearly net and peak moves highlight how upside potential and drawdowns have coexisted in this window.
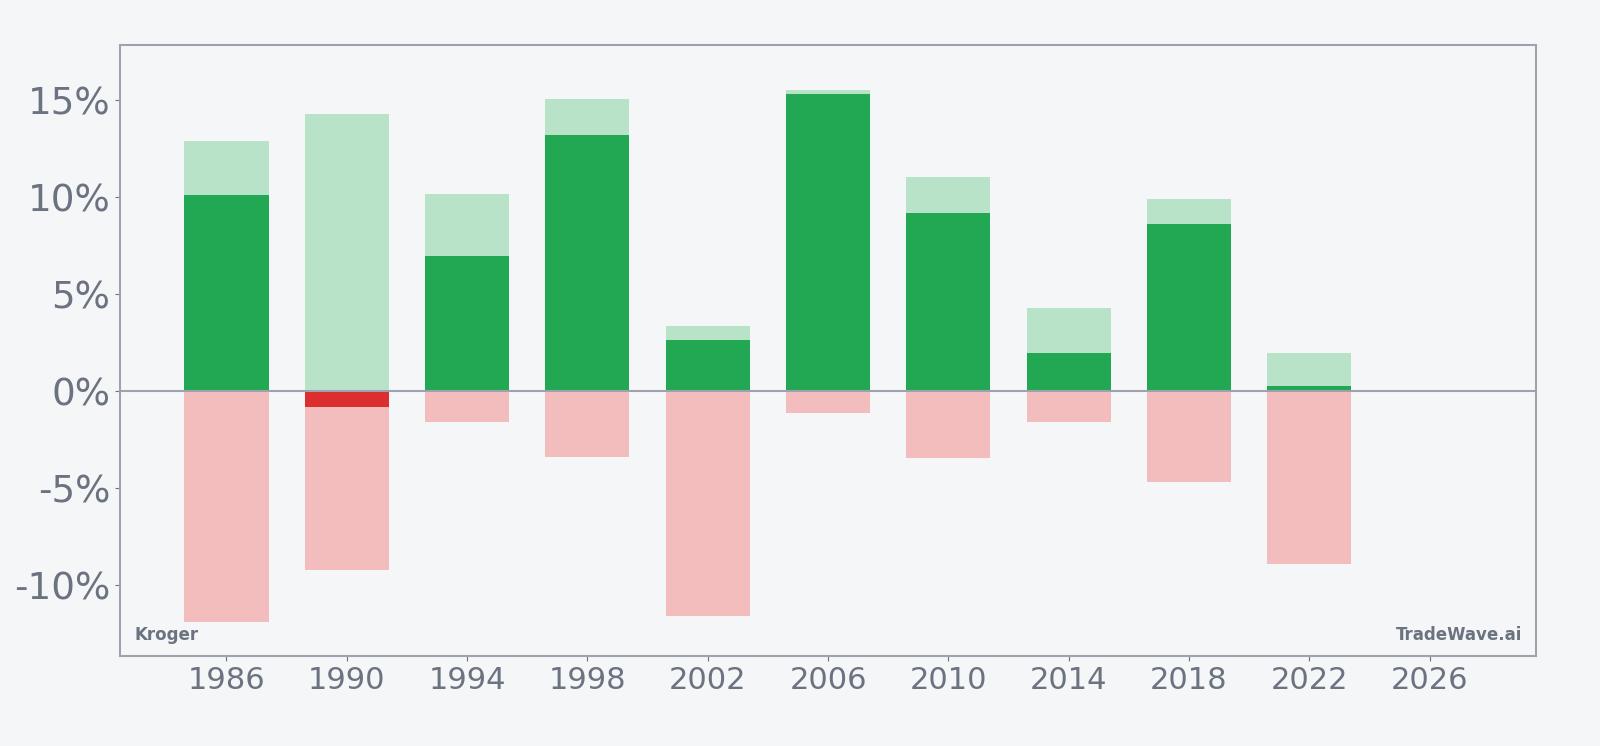
The combined net, maximum favorable move and maximum adverse move bars show a clear pattern: in most years, Kroger has enjoyed solid upside runs within the window, but several cycles also featured mid-window pullbacks of 8% to 12% before finishing higher. For traders, that history points to a window where dips have often occurred inside an overall bullish seasonal backdrop.
History does not guarantee future results; adverse excursions (MAE) can be large even in winning windows.
Why does Kroger (KR) follow this seasonal pattern?
This midterm-year early-summer pattern may reflect a mix of consumer spending cycles and policy-driven positioning. One likely driver is that late June through August captures peak at-home food demand as families shift routines, while investors often rotate toward defensive staples when midyear macro and election headlines heat up. Analysts have also pointed to recurring earnings timing and guidance updates around this part of the year, which can reinforce a positive bias if management leans conservative earlier in the calendar.
What is driving Kroger (KR) today?
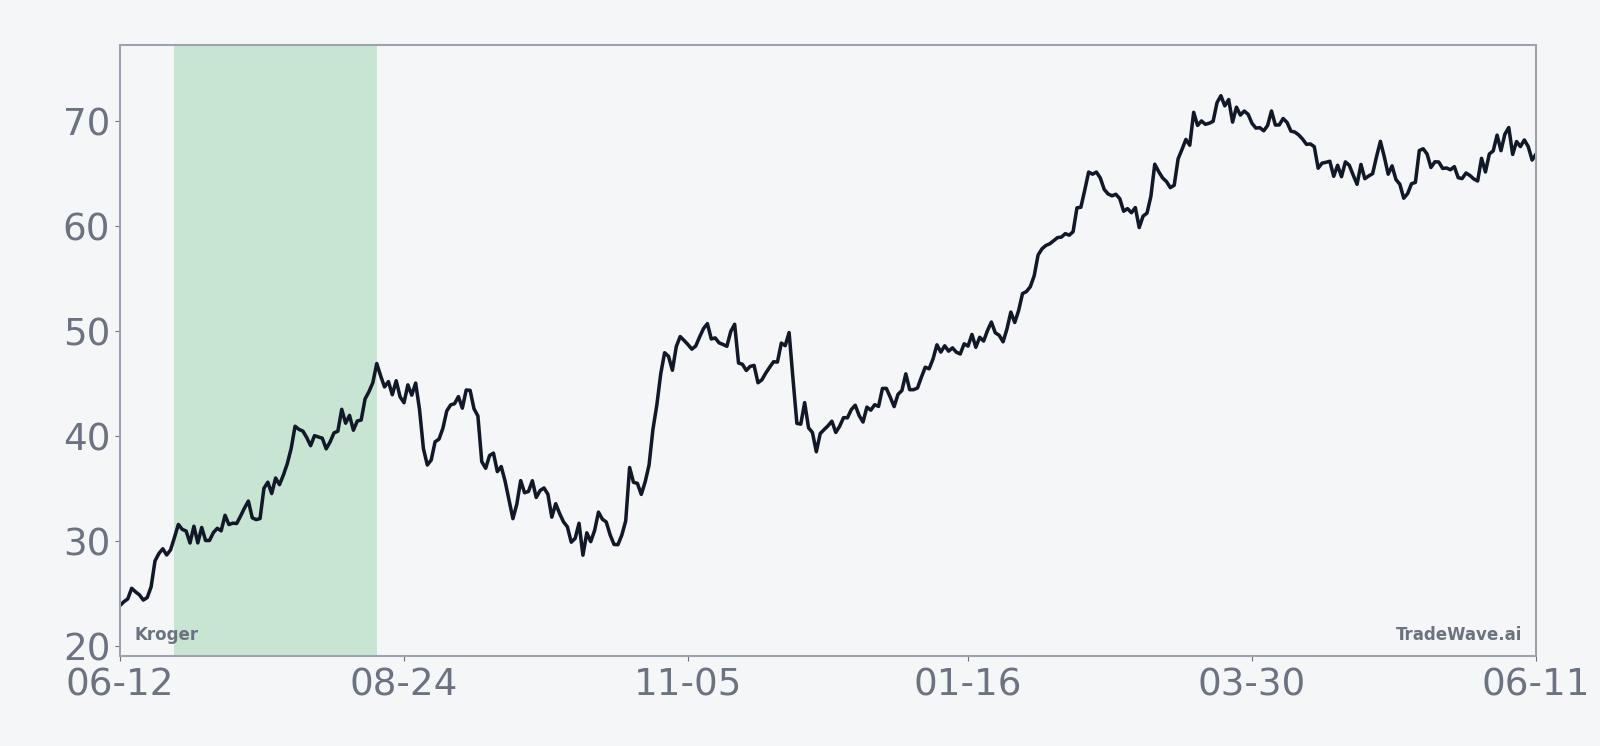
Kroger shares last closed at $63.54, down 0.81% on the day, leaving the stock up about 16% year to date but still roughly 15.9% below its 52-week high and about 10.7% above its 52-week low, with 20-day average volume near 7.6 million shares.[4] The move comes after a stretch in which investors have focused on Kroger’s workforce investments and valuation gap versus peers, as well as the company’s use of a shelf registration to maintain financial flexibility.[4][5] In March 2026, Reuters reported that Kroger’s new CEO kept forecasts soft while doubling down on a strategy of reinvesting savings into lower prices and better service, reinforcing the grocer’s positioning as a value destination for cost-conscious shoppers.[6]
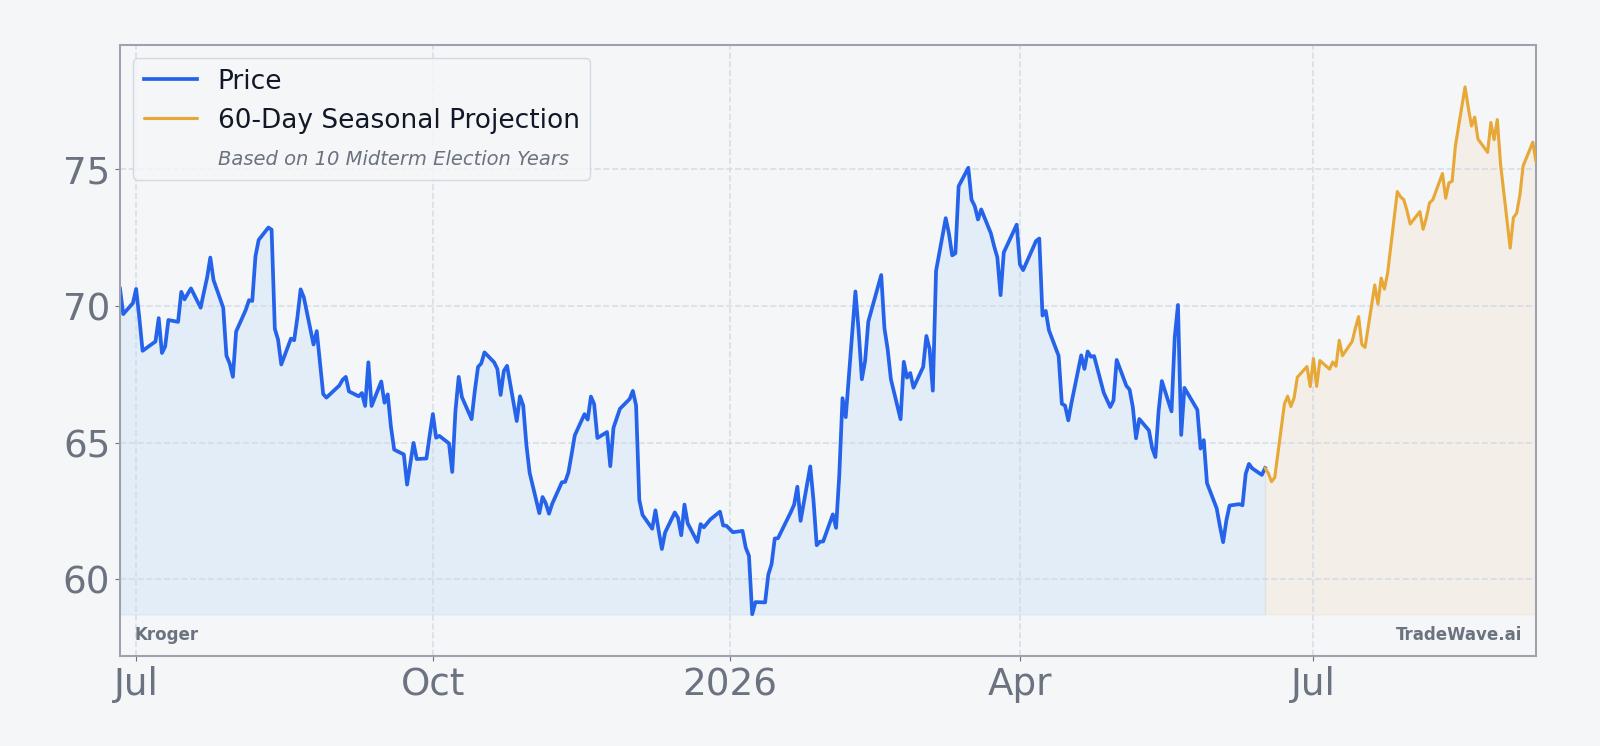
The chart below situates the latest move in its recent multi-month context alongside a 60-day seasonal projection.
What should traders watch as this Kroger seasonal window opens?
First, the calendar: the 53-day window starts on Jun 26 and runs deep into the summer, so price action in the final week of June will set the entry tone. A firm base above the recent lows near the 52-week low band would align with the historical pattern of gains building from relatively subdued levels, while a sharp break lower would test how durable the midterm-year seasonal tailwind really is.
Second, watch how Kroger trades around macro headlines on tariffs, food inflation and consumer spending. Past midterm years have often featured noisy policy debates that pushed investors toward or away from defensive retailers, and a repeat of that behavior could either reinforce or blunt the historical seasonality. If the stock shrugs off negative macro news and grinds higher through July and August, that would look a lot like prior winning years in this window.
Third, monitor volume and participation. The historical pattern has included sizable intraperiod drawdowns even in winning years, so spikes in volume on down days could signal that short-term traders are leaning into those dips, while light volume pullbacks might suggest a more orderly consolidation inside a bullish seasonal regime. A sustained pickup in buying interest on up days would be one sign that the long-biased pattern is tracking to form.
Finally, keep an eye on how Kroger trades relative to other consumer staples and big-box peers. If the stock begins to outperform its sector into July while broader markets chop around, that would echo the defensive rotation dynamic that often shows up in midterm election years. If instead Kroger lags even as the seasonal window progresses, it would be an early signal that this cycle may diverge from the 9-for-10 historical record.
Sources
- CNBC, "Kroger's shares rise as grocer says shoppers seek lower prices, cook more at home" (Jun 20, 2025).
- Reuters, "Kroger raises annual sales forecast as grocery demand stays strong" (Sep 11, 2025).
- Reuters, "Kroger lifts annual sales target on resilient demand for groceries" (Jun 20, 2025).
- Simply Wall St via Yahoo Finance, "Kroger Workforce Push And Valuation Gap Draw Investor Attention" (Apr 22, 2026).
- Simply Wall St via Yahoo Finance, "How Kroger’s New Shelf Registration and Workforce Push Could Shape Kroger (KR) Investors’ Outlook" (Apr 24, 2026).
- Reuters, "Kroger keeps forecasts soft as new CEO bets on growth by keeping prices down" (Mar 05, 2026).
About this seasonal analysis
Seasonal pattern data is sourced from TradeWave.ai, which analyzes historical price behavior across annual calendar windows going back up to 30 years. Read the full data methodology or the book The 100-Year Pattern by Afshin Moshrefi (2026 edition). Past performance of seasonal patterns does not guarantee future results. This article is for informational purposes only and does not constitute investment advice.