HP Inc. (HPQ) Profit Cut on Tariffs as a Historically Weak Mid-June Stretch Nears
HP Inc. is heading into a mid-June trading window that has historically favored short positions, just as the stock trades lower for the year and investors digest tariff-hit guidance.

What is the seasonal pattern for HP Inc. (HPQ)?
HP Inc. has fallen in 9 of the last 10 midterm-year June windows during this 13-day stretch, with an average gain of 4.83% in winning short years.
- 9 for 10 in this window, with winning short years averaging 4.83% gains for the short side.
- Seasonal direction is bearish for HPQ, with a 13-day window starting Jun 20 that has historically rewarded short exposure.
- Percent Profitable is 90%, with 9 winners and 1 loser across the last 10 midterm election years.
- Average outcome across all years is a 4% move in favor of the short, showing the lone losing year has not erased the pattern.
- Intraperiod swings have included double-digit adverse moves in some years, so drawdowns can be sharp even when the window finishes profitable for shorts.
- The pattern sits in the midterm election year phase, where policy and tariff headlines have often amplified volatility for hardware names like HP Inc.
According to historical data from TradeWave.ai, this mid-June stretch has behaved very differently from an average month for HP Inc., and the next iteration is approaching quickly.
How has HP Inc. (HPQ) traded in this mid-June window?
HP Inc. has delivered profitable short-side results in 9 of the last 10 midterm election years during the 13 trading days starting Jun 20, with average winning trades gaining 4.83% for bears. Today the stock closed at 24.24, down 4.0% on the session and roughly 11.9% below its 52-week high of 27.41, leaving it already 16% lower year to date.[1]
Because this pattern is grouped by the presidential election cycle, it only looks at midterm election years, not every calendar year. That matters for HPQ because midterm years often bring heavier policy noise, from tariffs to spending debates, which can hit hardware and PC demand expectations in a concentrated way.
Historically, the trade direction for this window is short. In 9 of 10 midterm-year samples, HPQ finished the 13-day stretch lower, which is a winning outcome for a short setup. The single losing year for shorts saw the stock edge higher into the close of the window, trimming the all-years average move to 4% in favor of the short side rather than matching the 4.83% average of the winners.
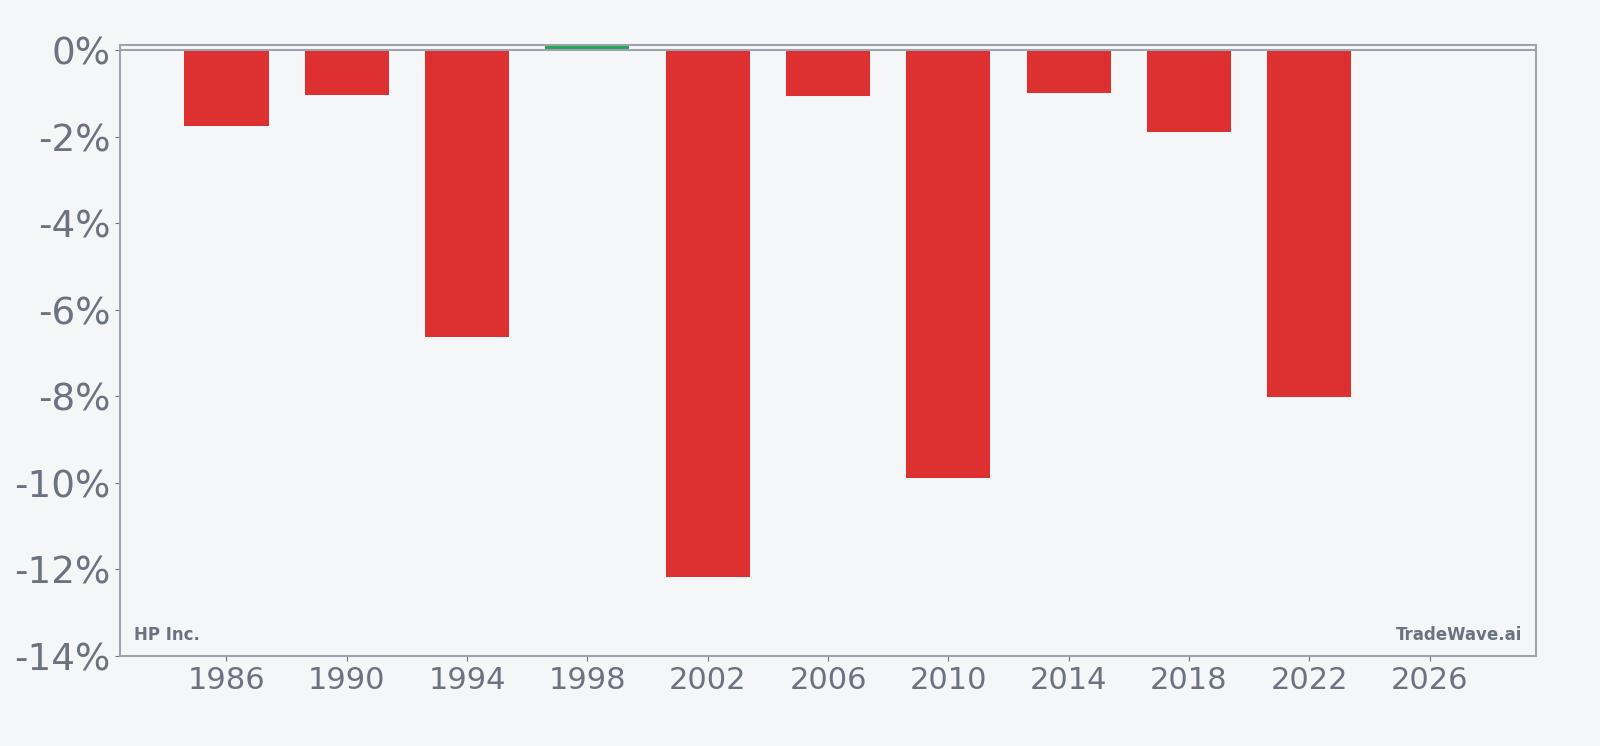
The per-year table shows how that plays out in practice. Years like 2002 and 2010 stand out, with net returns of -12.19% and -9.89% respectively, meaning HPQ dropped sharply during the window and shorts benefited. Even the milder winning years, such as 1994 at -6.64% and 2018 at -1.89%, still leaned in favor of the bearish seasonal bias.
Intraperiod swings have been meaningful. Maximum favorable moves for shorts, which are the best point-to-trough drops during the window, reached as much as -15.92% in 2002 and -10.94% in 2010. At the same time, maximum adverse moves, which are the worst drawdowns against a short position, have occasionally been steep, with years like 1986 showing a 2.04% rally against shorts before the stock ultimately finished lower.
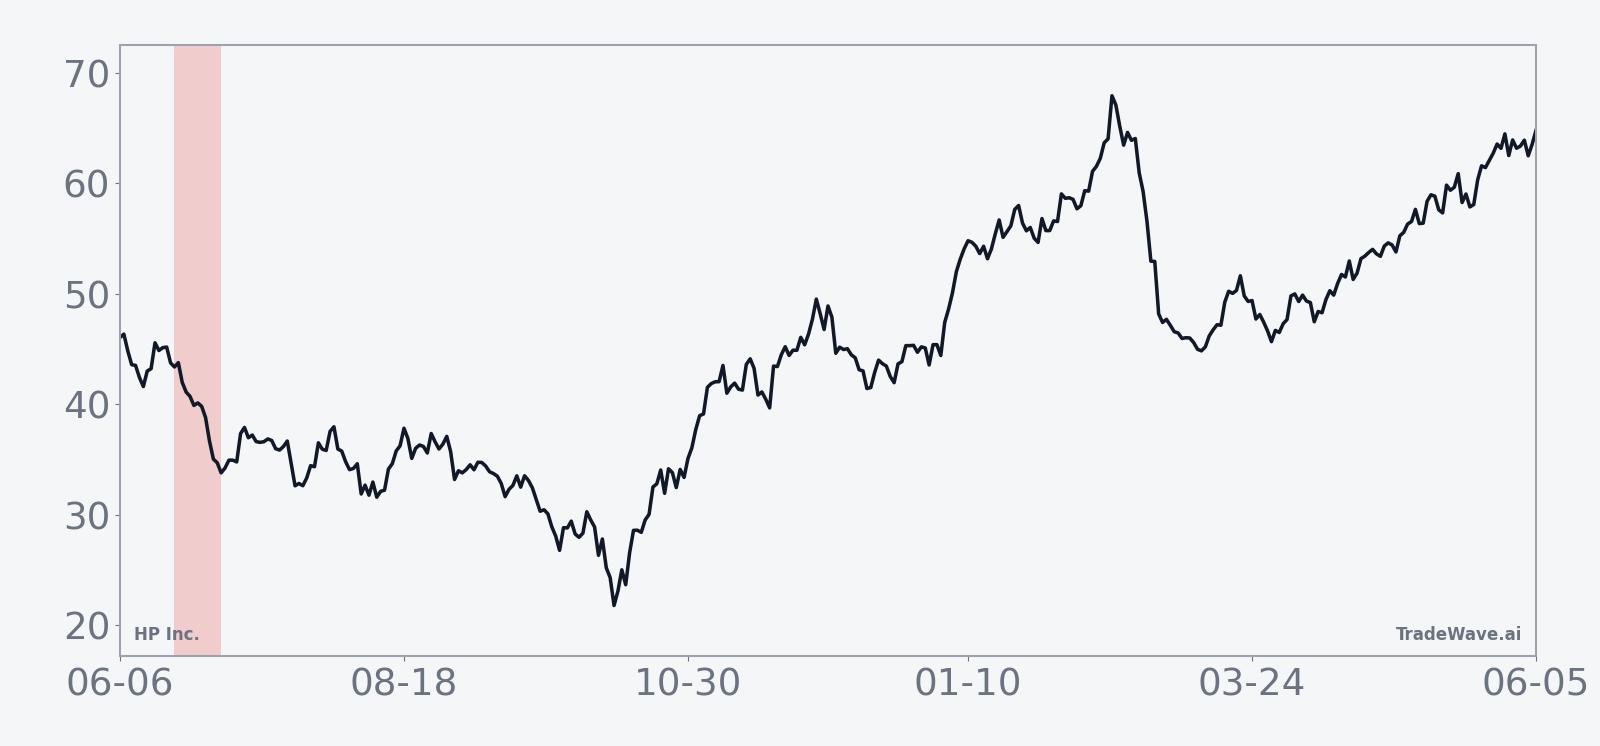
The historical seasonal trend chart shows that, on average, most of the downside for HPQ in this window has tended to accrue in the middle of the 13-day stretch rather than right at the start. The path often begins with a modest drift, then sees a more decisive leg lower before stabilizing into the end of the window.
A combined view of net returns with best and worst intraperiod swings highlights how far HPQ has tended to move in both directions during this window.
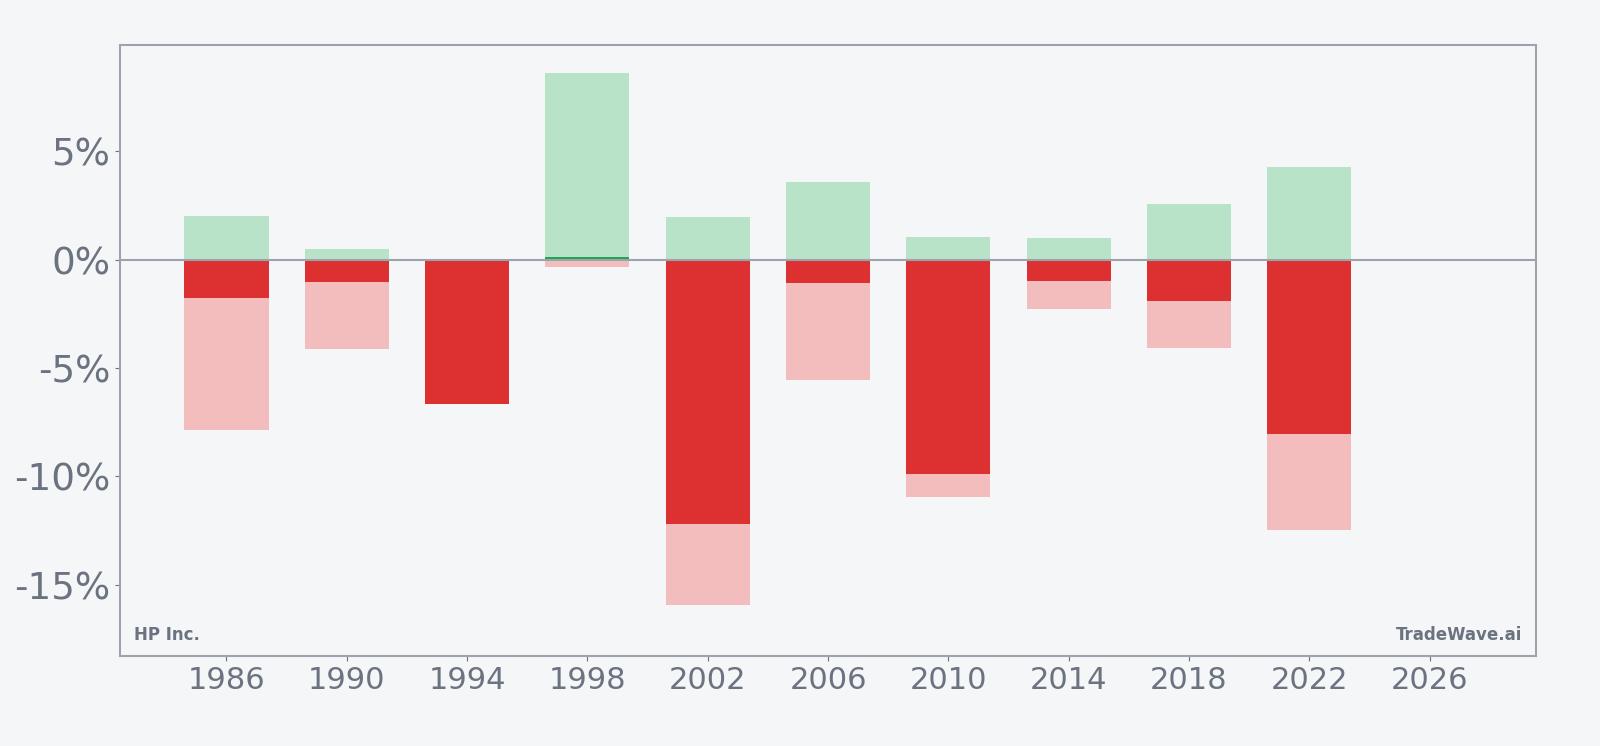
The stacked net, maximum favorable excursion, and maximum adverse excursion bars make the volatility profile clear. In strong years for the pattern, HPQ has often seen sizeable intraperiod drops that extend beyond the final close, while even the weaker years show that rallies against the short have usually been contained to a few percentage points. The TradeWave Ratio of 1.42 suggests that, on average, price has traveled meaningfully in the trade direction within the window, even when the final close did not capture the full swing.
History does not guarantee future results; adverse excursions (MAE) can be large even in winning windows.
Why does HP Inc. (HPQ) follow this seasonal pattern?
One likely driver is the way HP Inc.’s fiscal calendar and guidance cadence line up with the midyear policy and tariff news flow. Analysts have pointed to tariff costs and supply-chain shifts as recurring themes for the company, which can cluster around midyear updates and investor days.[1] This pattern may also reflect broader sector rotation in midterm election years, when investors often rebalance away from cyclical hardware exposure as Washington debates trade and spending policy.
What is driving HP Inc. (HPQ) today?
HPQ finished Tuesday at 24.24, down 1.01 points or 4.0%, on volume of about 25.3 million shares, well above its 20-day average of roughly 17.9 million.[1] The stock is still up 23.63% over the past month but remains 16% lower year to date, trading below its 50-day moving average of 20.09 yet also below the 52-week high of 27.41, which leaves room on both sides for the upcoming mid-June seasonal window.[1]
Fundamentally, investors are still working through the fallout from HP’s fiscal second-quarter report on May 28, 2025, when the company cut its full-year profit forecast as tariffs weighed on margins and the stock dropped sharply after hours.[1] Revenue beat expectations at $13.22 billion, but adjusted earnings per share missed, and management guided fiscal 2025 adjusted EPS to $3.00 to $3.30, down from a prior range of $3.45 to $3.75, citing higher tariff costs and a slower recovery in printing.[1] The company has been shifting its supply chain toward Vietnam, Thailand, India, Mexico, and the United States to blunt tariff exposure, but those moves take time and can pressure near-term profitability.
In April 2026, HPQ also traded higher on a report that it and Dell were part of acquisition speculation, a reminder that corporate activity can quickly change the narrative around legacy PC and printing names.[12] That kind of headline risk sits on top of the existing tariff and demand story, adding another layer of potential volatility as the stock approaches a historically weak seasonal stretch for longs.
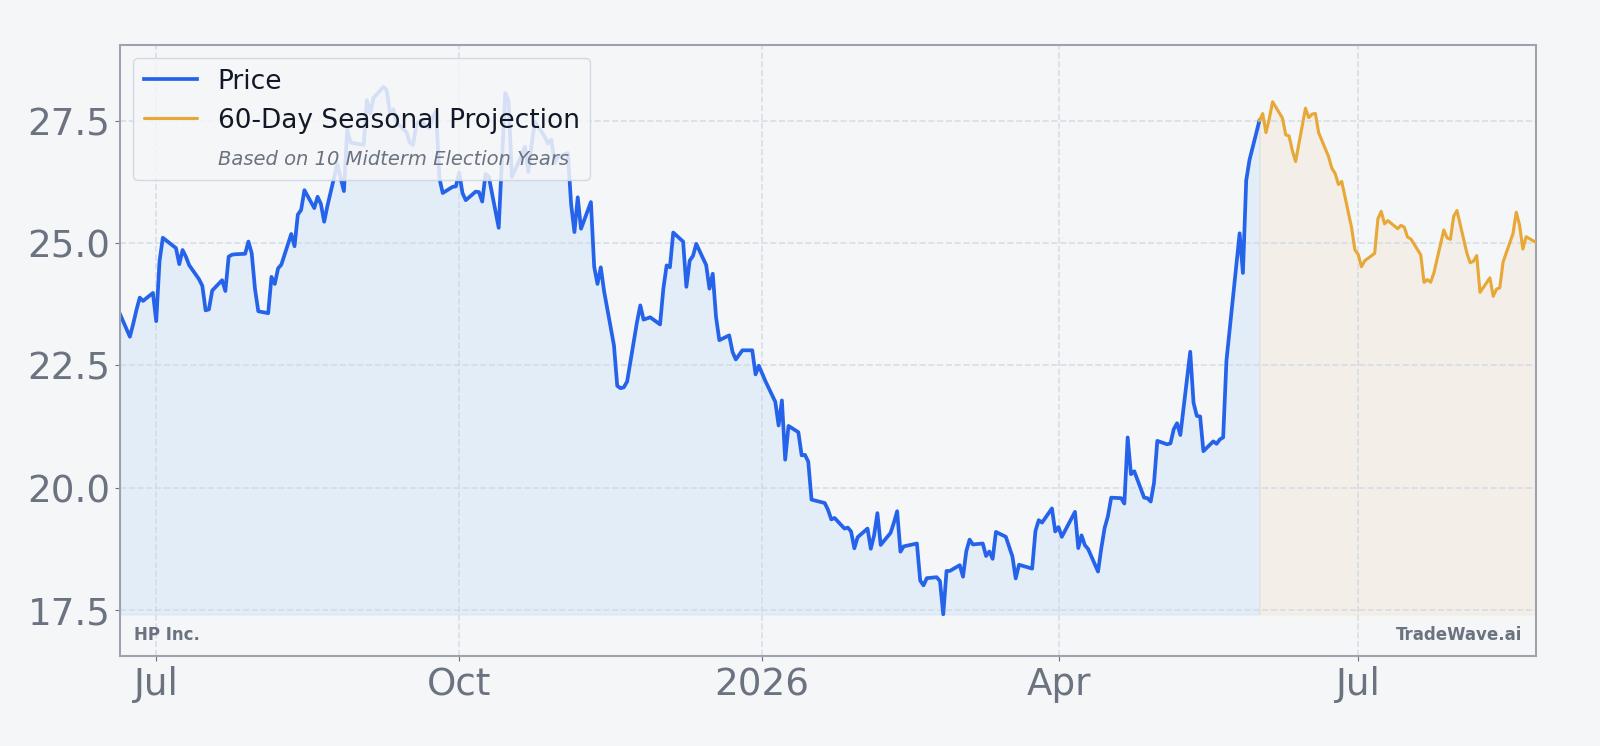
The chart below situates the latest move in its recent multi-month context and overlays a short-term seasonal projection.
What should traders watch as the mid-June window approaches?
First, the calendar. The 13-day mid-June window tied to the last 10 midterm election years begins on Jun 20, so any sharp move into that date will shape how much room is left for the historical pattern to play out. A fresh rally back toward the 27 area would leave more downside potential if the usual midterm-year weakness reappears, while a deeper slide from here could compress the opportunity.
Second, levels. On the upside, the 52-week high near 27.41 is the obvious reference point, while on the downside, traders will be watching how HPQ behaves around the 20 level, which sits close to the 50-day moving average and has been an important pivot in recent months.[1] Sustained trading below that band during the window would be more consistent with the historical short-side bias, while a squeeze back above it would look more like the lone losing year in the sample.
Third, macro and policy headlines. Any fresh tariff announcements, supply-chain updates, or signs of PC and printer demand softening could reinforce the midterm-year seasonal pattern that has historically favored shorts in this window.[1] Conversely, a clean run of macro data and calmer trade rhetoric could blunt the usual downside and produce a more muted or even contrarian outcome.
Finally, volatility itself. The historical record shows that maximum adverse moves against shorts have sometimes been large inside this window, even in years that finished profitable for the pattern. Traders watching HPQ into late June will want to track not just direction but the size and speed of intraday swings, since a repeat of past behavior would mean quick, two-sided moves before the prevailing trend asserts itself.
Sources
About this seasonal analysis
Seasonal pattern data is sourced from TradeWave.ai, which analyzes historical price behavior across annual calendar windows going back up to 30 years. Read the full data methodology or the book The 100-Year Pattern by Afshin Moshrefi (2026 edition). Past performance of seasonal patterns does not guarantee future results. This article is for informational purposes only and does not constitute investment advice.