10-for-10 Midterm Streak: Merck & Co. (MRK) Has Averaged 18.86% Gains From This 200-Day Window
Merck & Co. is heading into a 200-day midterm-election-year stretch that has never been negative in the last 10 cycles, just as shares trade near a 52-week high and investors weigh guidance, drug pricing and pipeline moves.

What is the seasonal pattern for Merck & Co. (MRK)?
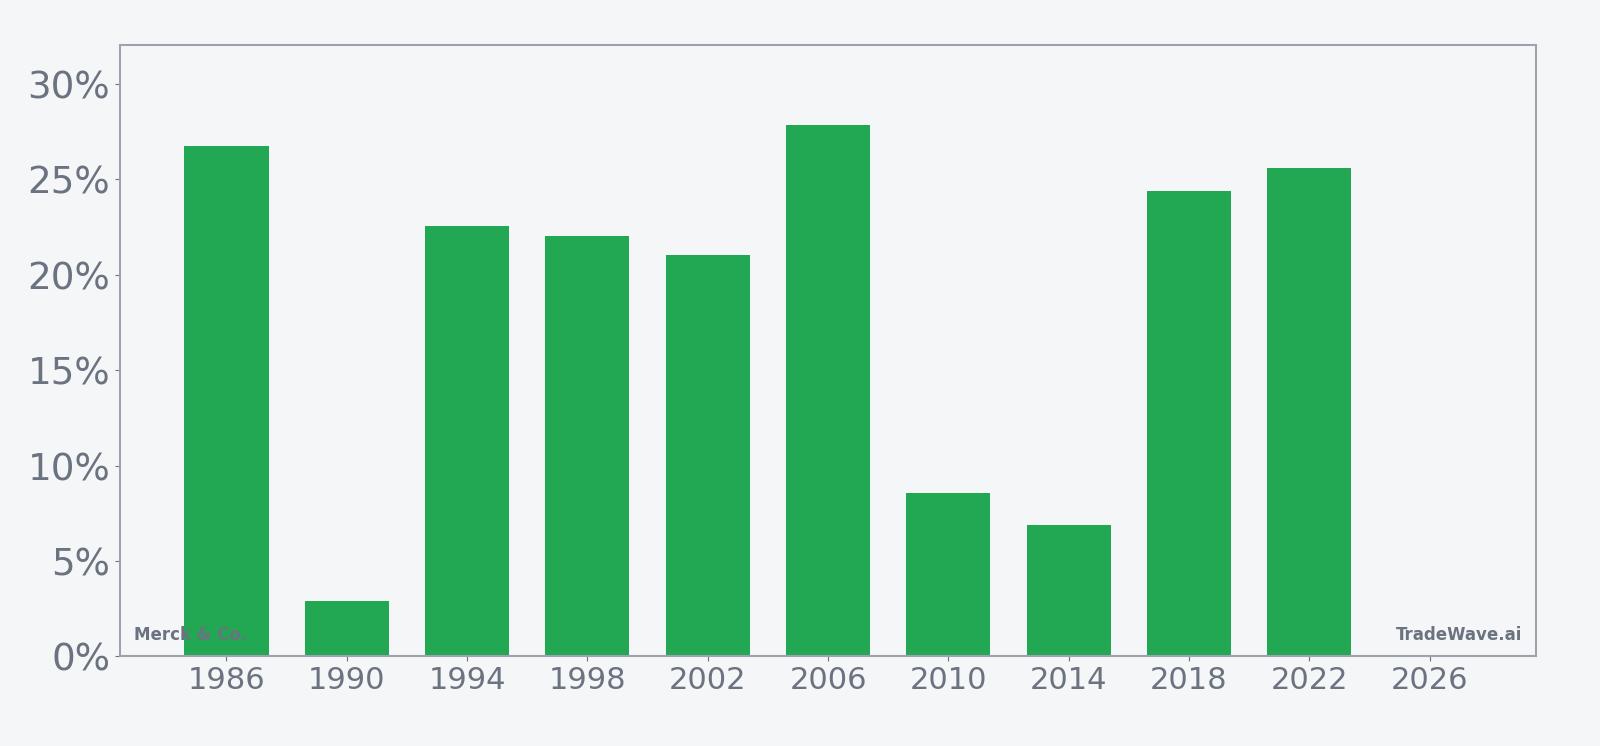
Merck & Co. has risen in 10 of 10 midterm-election-year windows starting around Jun 22, with an average gain of 18.86% in winning years.
- 10 for 10 in this window, with average gains of 18.86% across all winning years.
- Seasonal window begins Jun 22 and runs for 200 trading days, covering the back half of the midterm year into the pre-election year.
- Percent Profitable is 100%, with 10 winners and 0 losers in the last 10 midterm-election-year cycles.
- Median outcome is a 22.28% gain, pointing to a strong bullish seasonal tendency for long trades.
- Historical best intraperiod rallies have topped 30%, but adverse moves inside the window have at times exceeded 20% before recovering.
- TradeWave Ratio of 2.05 and a Sharpe ratio of 1.83 signal a historically strong, risk-adjusted seasonal edge for longs.
According to historical data from TradeWave.ai, this midterm-election-year stretch has behaved very differently from an average calendar period for Merck & Co., and the next iteration is about to open.
How has Merck & Co. (MRK) traded in past midterm-year windows starting in June?
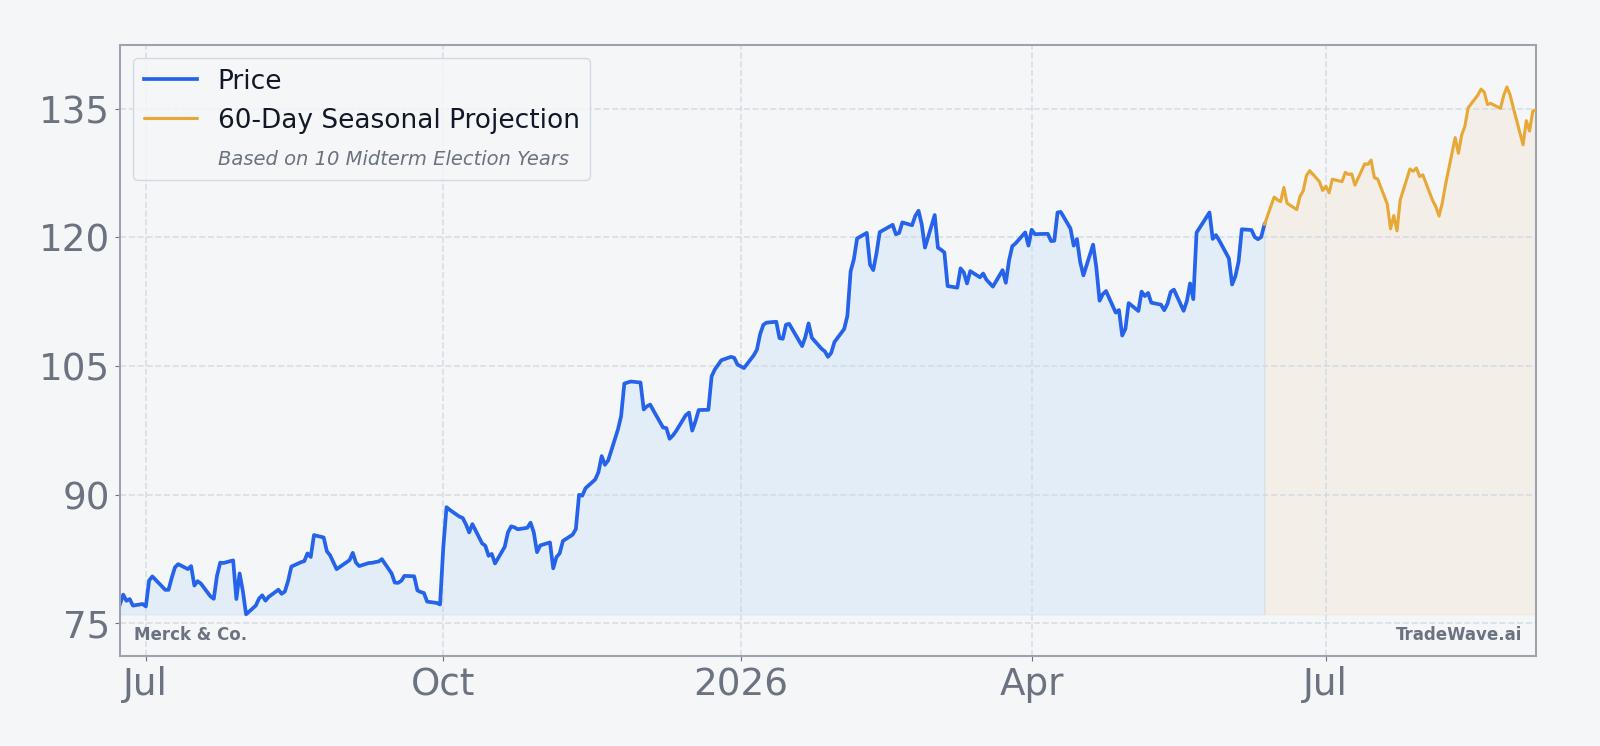
In the last 10 midterm election years, Merck & Co. has never posted a losing result in the 200-trading-day window that begins around Jun 22, with every cycle finishing higher and average gains near 19%. Shares closed Monday at $119.52, down 1.1% on the day but still up 5.6% year to date and about 3.6% below their 52-week high of $124.00.[3]
The pattern is grouped by the presidential election cycle, focusing on the last 10 midterm election years rather than consecutive calendar years. That matters because drug pricing debates, Medicare negotiations and regulatory scrutiny often follow a repeatable rhythm across administrations, shaping how large pharmaceutical stocks trade around the mid-cycle policy phase.
Across those 10 midterm-election-year slices, the trade direction is long and the record is clean: 10 winners, 0 losers, for a Percent Profitable reading of 100%. Average profit across all years is 18.86%, with a median outcome of 22.28%, and cumulative gains across the sample add up to 447% for this specific Merck & Co. trading window. In other words, the MRK seasonal trend in this phase has historically favored patient long exposure rather than short-term mean reversion.
The per-year table shows how that played out in individual cycles. The weakest year in the sample was 1990, when the stock still finished the window up 2.9%, while the strongest years such as 2006 and 2022 delivered net returns of 27.88% and 25.62% respectively. Those stronger cycles also saw sizeable peak run-ups, with maximum favorable moves above 30% in several cases, underscoring how powerful the upside has been when the pattern has clicked.
The historical seasonal average suggests gains tend to build steadily rather than in a single burst. The curve slopes higher through much of the 200-day span, with only modest pauses, which lines up with the long bias and the absence of losing years. That profile fits a backdrop where large-cap pharma often benefits from defensive flows as midterm-year policy noise peaks and then fades into the pre-election year.
A closer look at yearly net returns and intraperiod swings shows how upside and drawdowns have coexisted inside this bullish window.
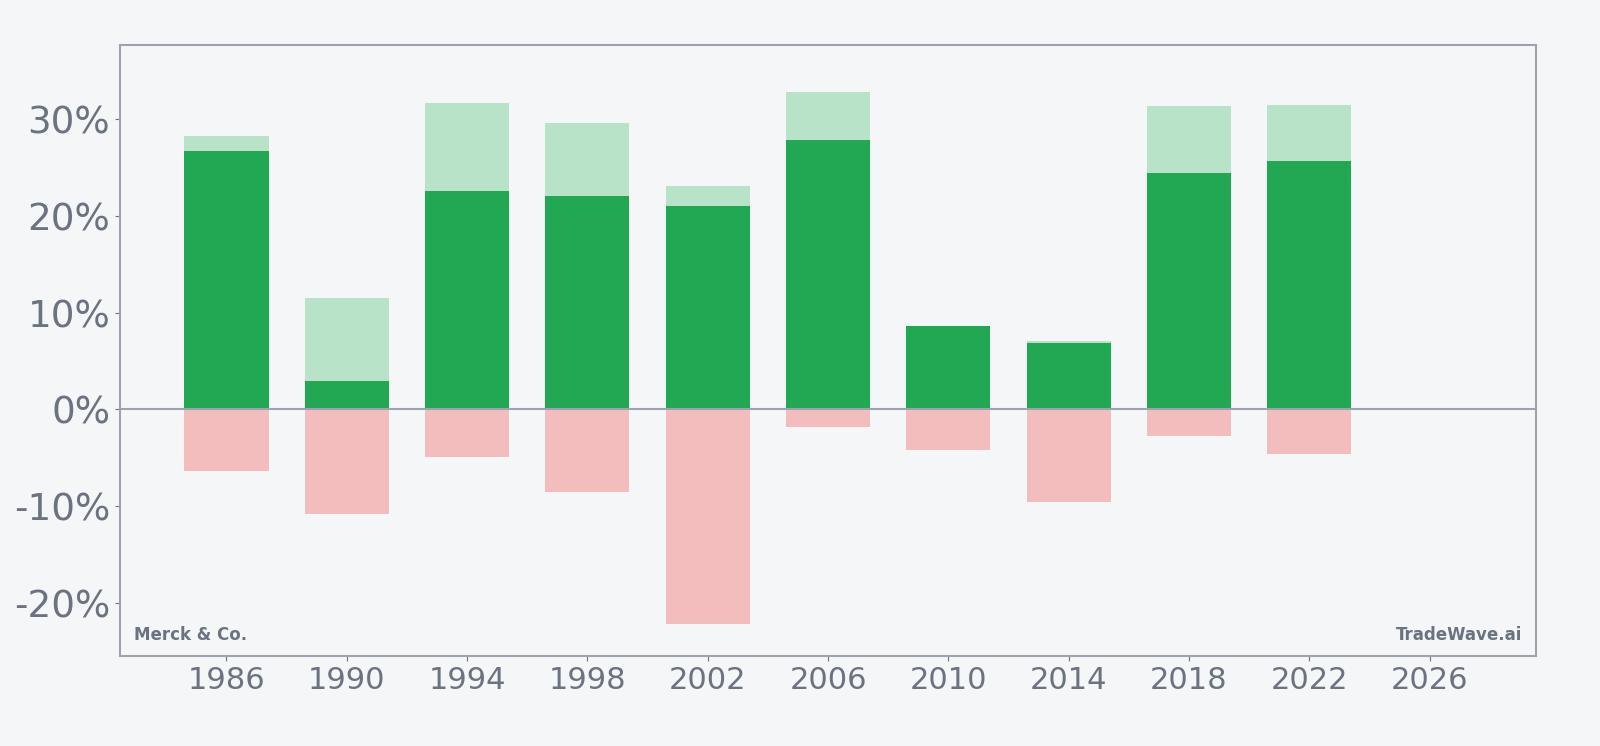
The stacked net/MFE/MAE bars highlight that even winning years have not been smooth. In 2002, for example, Merck & Co. finished the window up 21.06% but endured a worst intraperiod drawdown of about 22.22% before recovering, while several other years saw adverse moves in the mid-to-high single digits. At the same time, maximum favorable excursions often pushed into the high 20s or low 30s, which is consistent with a TradeWave Ratio of 2.05 and a Sharpe ratio of 1.83 that both point to strong, but sometimes bumpy, upside.
History does not guarantee future results; adverse excursions can be large even in winning windows, and traders should be prepared for volatility inside the pattern.
The single most important takeaway is simple: this 200-day midterm-election-year window has been 10 for 10 on the long side for Merck & Co., with typical gains in the high teens and occasional deep drawdowns along the way.
Why does Merck & Co. (MRK) follow this seasonal pattern?
One likely driver is the way the presidential election cycle shapes healthcare policy debates, with midterm years often front-loading uncertainty on drug pricing and regulation before clarity improves into the pre-election year. Analysts have also pointed to institutional portfolio repositioning around that policy calendar, which can favor defensive, cash-generative pharma names like Merck & Co. in the back half of the midterm year. The pattern may also reflect how Merck’s earnings and trial news tend to cluster in this stretch, reinforcing a bias toward steady accumulation rather than aggressive selling.
What is driving Merck & Co. (MRK) today?
Merck & Co. closed Monday at $119.52, down 1.1% on the session but still up 5.6% so far in 2026 and trading just under 4% below its 52-week high, with volume slightly above its 20-day average of about 10 million shares.[3] The stock has been supported by a solid first-quarter earnings beat and a guidance update on Apr 30, when the company reported $16.29 billion in revenue versus $15.82 billion expected and narrowed its 2026 sales outlook to $65.8 billion to $67.0 billion while raising adjusted EPS guidance to $5.04 to $5.16 per share.[3]
That earnings print followed a February update in which Merck projected 2026 sales below some analyst estimates as patent losses and Medicare price negotiations weighed on legacy products such as Januvia, sharpening investor focus on the durability of its growth drivers.[2] In January 2026, management also laid out a longer-term target of about $70 billion in revenue from new growth drivers by the mid-2030s, highlighting cardiometabolic, respiratory and infectious disease franchises as key pillars beyond flagship cancer drug Keytruda.[5]
Strategically, Merck has been leaning harder into oncology. In March 2026, Reuters reported that the company was nearing an approximately $6 billion all-cash deal to acquire Terns Pharma, a move aimed at bolstering its cancer portfolio ahead of Keytruda’s expected patent expiry later this decade.[13] Earlier regulatory wins, including an FDA approval that expanded a Keytruda regimen and the European launch of a subcutaneous Keytruda formulation, have reinforced the narrative that Merck is working to extend and diversify its oncology franchise even as pricing pressure builds on older drugs.[1]
Policy risk remains a key macro overhang for the sector. In February 2026, Reuters reported that new Medicare prices negotiated under the Inflation Reduction Act could hurt sales of diabetes drug Januvia more than some analysts had penciled in, contributing to a more cautious 2026 sales forecast and reminding investors that large-cap pharma is not immune to Washington’s push on drug costs.[2] That backdrop makes the upcoming midterm-year seasonal window particularly interesting, because it overlaps with a phase of the political calendar when drug pricing rhetoric often heats up before fading into the pre-election year.
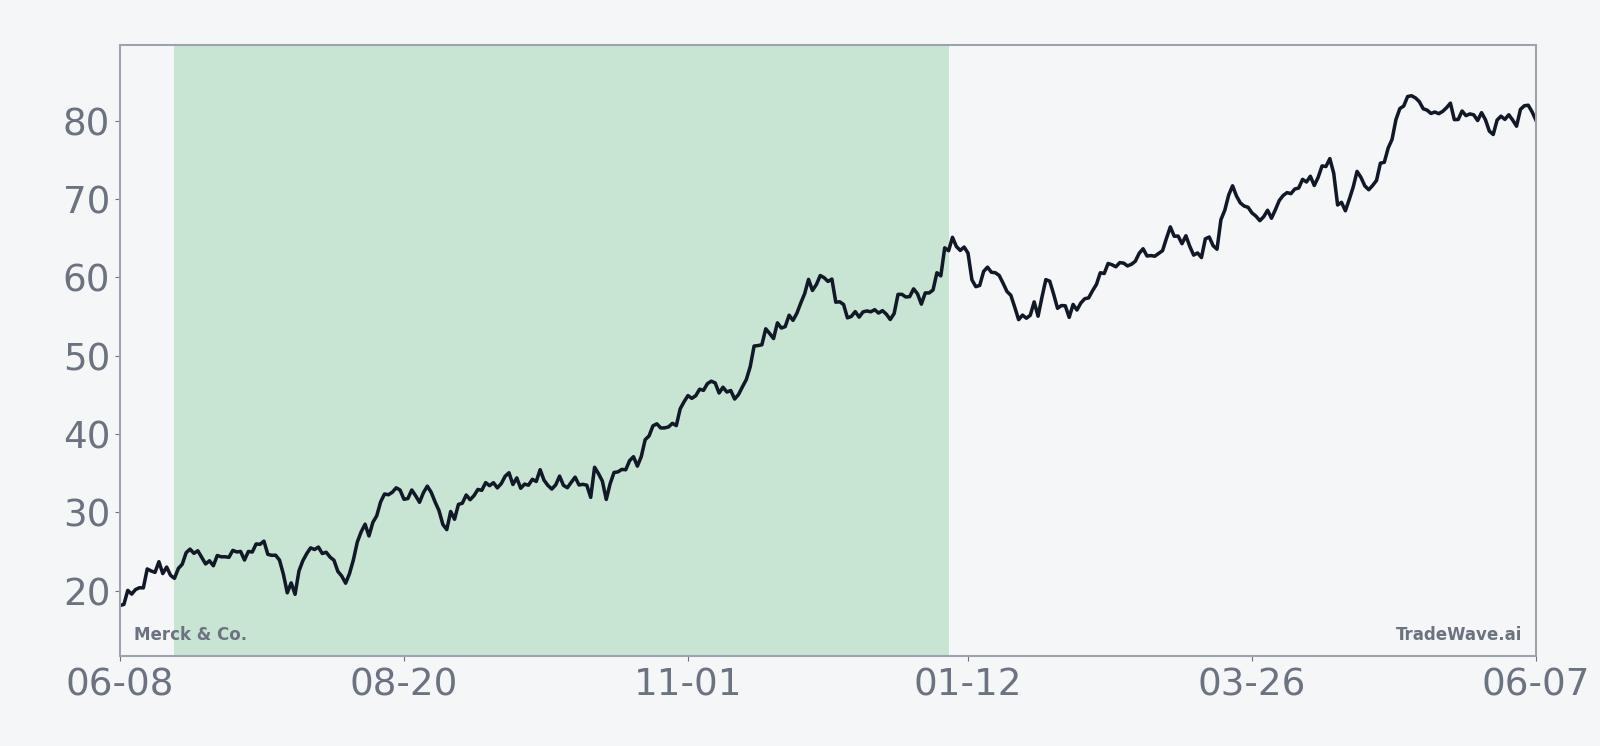
The chart below situates the latest move in its recent multi-month context and overlays a short-term seasonal projection.
What should traders watch as this Merck & Co. seasonal window opens?
First, the calendar. The 200-day window begins on Jun 22 and runs deep into the pre-election year, so the way MRK behaves in the final days before that start date will shape how much “room” the stock has to follow its historical pattern. A clean consolidation just below the 52-week high would look very different from a sharp breakout or a sudden reversal into the window.
Second, policy headlines. Any fresh detail on Medicare drug pricing, Inflation Reduction Act implementation or broader healthcare reform could test the defensive bid that has historically supported Merck & Co. in this phase.[2] If the stock can absorb negative policy noise without breaking its uptrend, that would be consistent with prior midterm-year behavior where drawdowns were temporary rather than terminal.
Third, execution on growth drivers. Investors will be watching for updates on the Terns Pharma deal, additional oncology data and progress toward the company’s mid-2030s revenue target of about $70 billion from new growth engines.[5][13] Strong follow-through on those fronts would help justify the kind of double-digit gains that have been common in past iterations of this window, while any stumble could turn the historical pattern into more of a ceiling than a tailwind.
Finally, volatility inside the window. History shows that even in winning years, Merck & Co. has often experienced sizable intraperiod drawdowns before finishing higher, with some cycles seeing adverse moves in the low- to mid-teens. Traders watching this MRK seasonal trend will want to distinguish between routine shakeouts that fit the historical MAE profile and deeper breaks that would signal a genuine departure from the 10-for-10 record.
Sources
- [1] Forbes, “Why Is Merck Stock Surging?” (Nov 26, 2025).
- [2] Reuters, “Merck forecasts 2026 sales below estimates on patent losses” (Feb 3, 2026).
- [3] CNBC, “Merck beats quarterly estimates on strength of Keytruda and new products, narrows outlook” (Apr 30, 2026).
- [4] Reuters, “Merck posts higher third-quarter sales as Keytruda growth offsets drop from Gardasil” (Oct 30, 2025).
- [5] Reuters, “Merck says new growth opportunities to drive revenue of $70 billion by mid-2030s” (Jan 12, 2026).
- [6] Forbes, “Is Merck Stock’s Run Legitimate?” (Dec 24, 2025).
- [13] Reuters, “Merck nears $6 billion acquisition of Terns Pharma to boost cancer portfolio, FT reports” (Mar 24, 2026).
About this seasonal analysis
Seasonal pattern data is sourced from TradeWave.ai, which analyzes historical price behavior across annual calendar windows going back up to 30 years. Read the full data methodology or the book The 100-Year Pattern by Afshin Moshrefi (2026 edition). Past performance of seasonal patterns does not guarantee future results. This article is for informational purposes only and does not constitute investment advice.