Merck & Co. (MRK) Has Rallied in 10 of 10 Midterm Windows Starting Jun 22, Averaging 18.86%
Merck & Co. is heading into a 200-day midterm-election-year seasonal window with a perfect win record, just as the stock trades near its 52-week high and investors weigh looming patent and policy headwinds.

What is the seasonal pattern for Merck & Co. (MRK)?
Merck & Co. has risen in 10 of 10 midterm-election-year windows starting around Jun 22, with an average gain of 18.86% in winning years.
- 10 for 10 in this window, with average winning-year gains of 18.86% across the last 10 midterm election years.
- The upcoming 200-day window begins Jun 22, 2026 and historically aligns with a long trade direction for MRK.
- Percent Profitable is 100%, with 10 winners and 0 losers across the lookback sample.
- Annualized return for the pattern is 18.53%, with a Sharpe ratio of 1.83 based on end-of-window outcomes.
- The TradeWave Ratio of 2.05 suggests price has typically traveled meaningfully in the long direction within the window before it closes.
- Intraperiod swings have included sizable drawdowns in some years, so the path has not been a straight line even in winning cycles.
According to historical data from TradeWave.ai, this midterm-election-year stretch has behaved very differently from an average calendar period for Merck & Co., and the next iteration is about to open.
How strong is the upcoming seasonal window for Merck & Co. (MRK)?
Merck & Co. has posted gains in every one of the last 10 midterm-election-year windows starting around Jun 22, averaging 18.86% per cycle over 200 trading days. Shares finished Friday at $119.56, up 5.6% year to date and about 3.6% below the 52-week high of $124.00.[3] That combination of a near-peak price and a historically powerful MRK seasonal trend gives this upcoming window unusual weight for traders trying to time exposure to big pharma.
Because this pattern is grouped by the presidential election cycle, it reflects how MRK has behaved specifically in the year before the presidential election, not just in any random summer-to-spring stretch. The current calendar year is the year before the presidential election, so the market is in the same phase that produced these prior 10 outcomes, with the new 200-day regime set to begin on Jun 22 and run deep into the pre-election year.
Across the 10 historical midterm-election-year samples, the MRK seasonal trend has been consistently positive. Percent Profitable is 100%, with 10 winners and 0 losers, and the cumulative return across those windows totals 447%. Average profit of 18.86% per window sits close to the 22.28% median, which suggests the gains have not been driven by a single outlier year.
The per-year table shows how that plays out in individual cycles. The weakest outcome in the sample was 1990, when MRK still finished the window up 2.9% after a maximum favorable move of 11.47% and a maximum adverse move of -10.85%. At the other end of the range, 2006 delivered a 27.88% net gain with a peak run-up of 32.77% and only -1.82% drawdown from entry, while 2022 posted a 25.62% gain with a 31.44% best intraperiod rally and a -4.59% worst pullback.
The MAE/MFE profile underlines that this has been an upside-biased but not risk-free window. Maximum favorable excursions have often pushed into the high 20% to low 30% zone, while maximum adverse excursions have ranged from shallow single-digit dips to a -22.22% drawdown in 2002. In plain English, MRK has tended to trend higher over these 200 days, but some years have included a deep shakeout before the advance stuck.
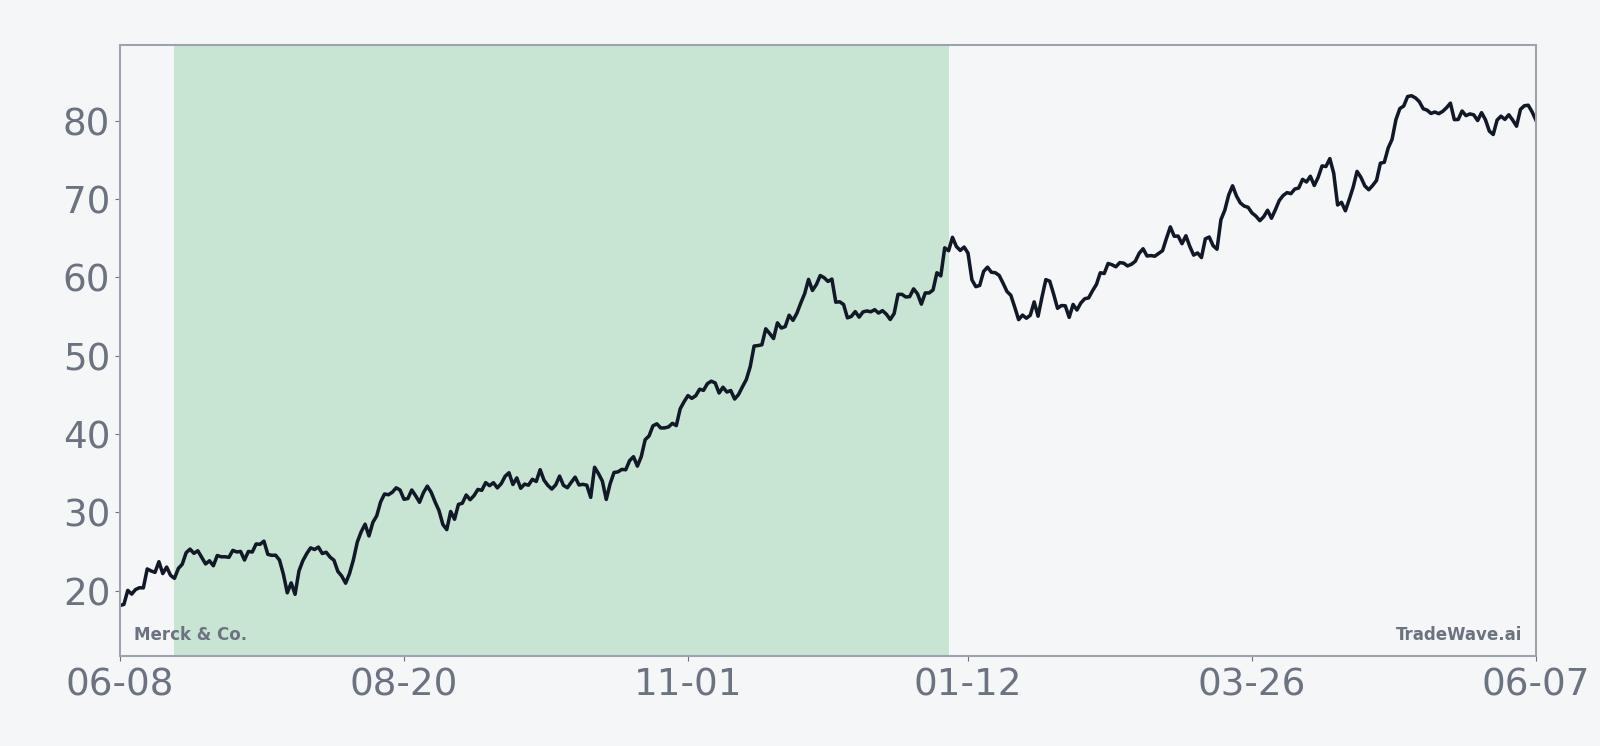
The historical seasonal average suggests that much of the typical gain accrues steadily rather than in a single burst. The curve tends to grind higher through the back half of the midterm year and into the early part of the presidential election year, with only modest soft patches along the way.
A bar view of each year’s net, best run-up and worst drawdown shows how consistently the pattern has favored longs while still allowing for volatility.
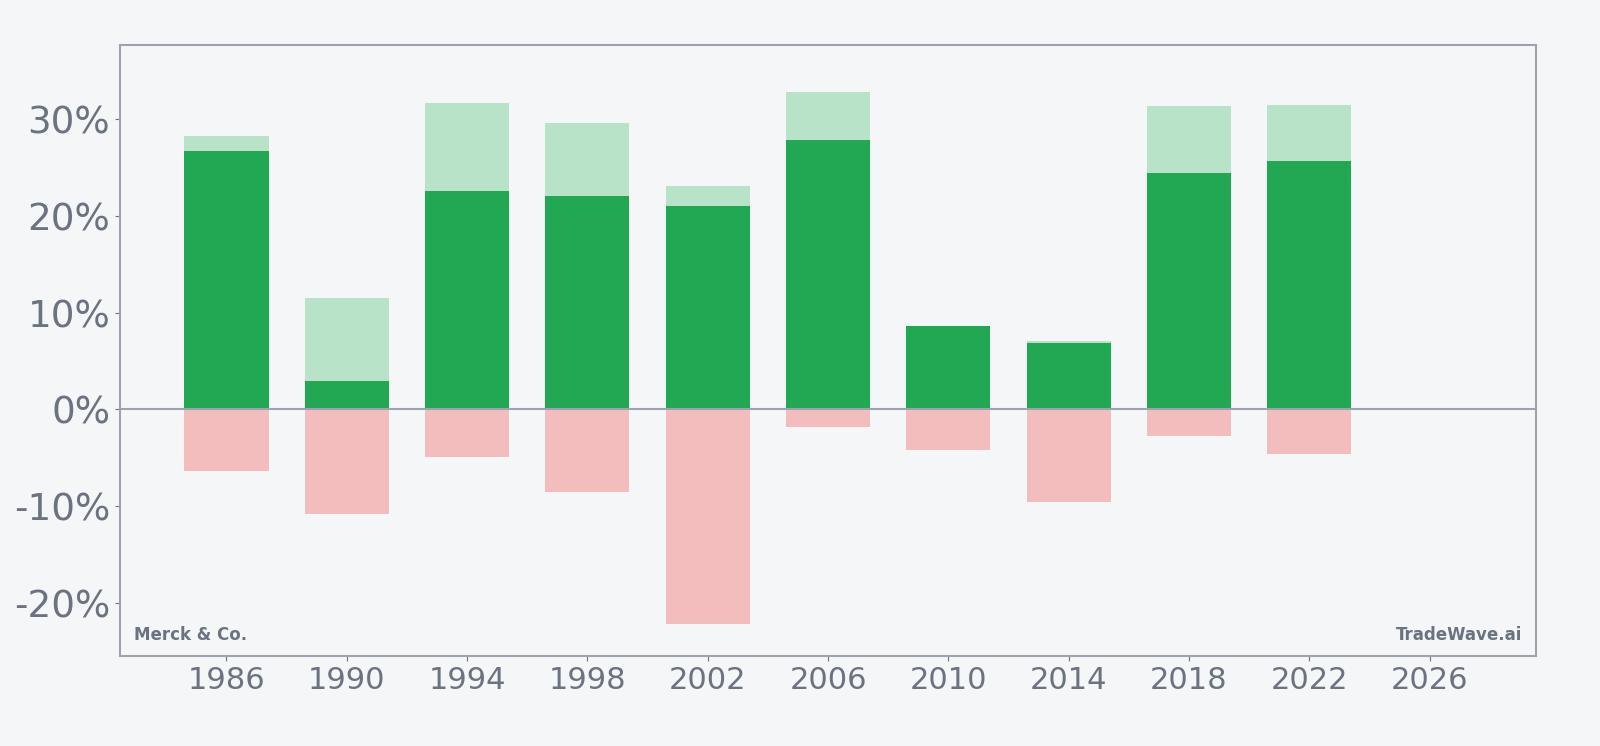
The stacked net, MFE and MAE bars make the pattern clear: every year finished positive, most years saw double-digit upside at some point, and a few carried double-digit drawdowns along the way. For traders, that means the MRK seasonal trend has historically rewarded patience in this window, but the ride has not always been smooth.
History does not guarantee future results; adverse excursions can be large even in winning windows, and seasonal patterns can break when fundamentals or policy regimes change.
Why does Merck & Co. (MRK) follow this seasonal pattern?
One likely driver is how the presidential election cycle shapes healthcare policy expectations and sector rotation. In the year before the presidential election, investors often gain more clarity on drug pricing and regulation, which can reduce headline risk for large pharma names and support gradual multiple expansion. For Merck specifically, this 200-day stretch also tends to capture key earnings reports and pipeline updates that have historically reinforced the growth story around oncology and other franchises, helping the stock trend higher across the window.
What is driving Merck & Co. (MRK) today?
MRK slipped 1.0% in the latest session to $119.56, leaving the stock up 5.6% year to date and about 3.6% below its 52-week high of $124.00, with trading volume of roughly 7.3 million shares versus a 20-day average of about 10.7 million.[3] The stock still sits above its 50-day moving average of $116.18, keeping the near-term trend constructive heading into the seasonal window.[3]
On Apr 30, Merck reported first-quarter 2026 revenue of $16.29 billion, ahead of the $15.82 billion consensus, and an adjusted loss per share of $1.28 that was narrower than the $1.51 loss analysts expected.[3] Management narrowed 2026 sales guidance and raised its adjusted earnings outlook to a range of $5.04 to $5.16 per share, signaling confidence that new products and the oncology pipeline can offset looming patent expirations and softer COVID-related revenue.[3] Earlier in 2026, Reuters reported that the company’s sales outlook reflected pressure from loss of exclusivity on diabetes drugs like Januvia and Janumet and from weaker demand for its COVID-19 treatment Lagevrio, as well as potential impact from Medicare price negotiations under the Inflation Reduction Act.[2]
Strategically, Merck has been leaning harder into oncology and other growth platforms. In Jan 2026, the company outlined a plan to generate about $70 billion in revenue from new growth drivers by the mid-2030s, with larger expected contributions from cardiometabolic, respiratory and infectious disease portfolios.[5] In Mar 2026, Reuters reported that Merck was nearing a roughly $6 billion acquisition of Terns Pharma to bolster its cancer portfolio, underscoring the push to diversify beyond Keytruda as biosimilar competition approaches later in the decade.[13]
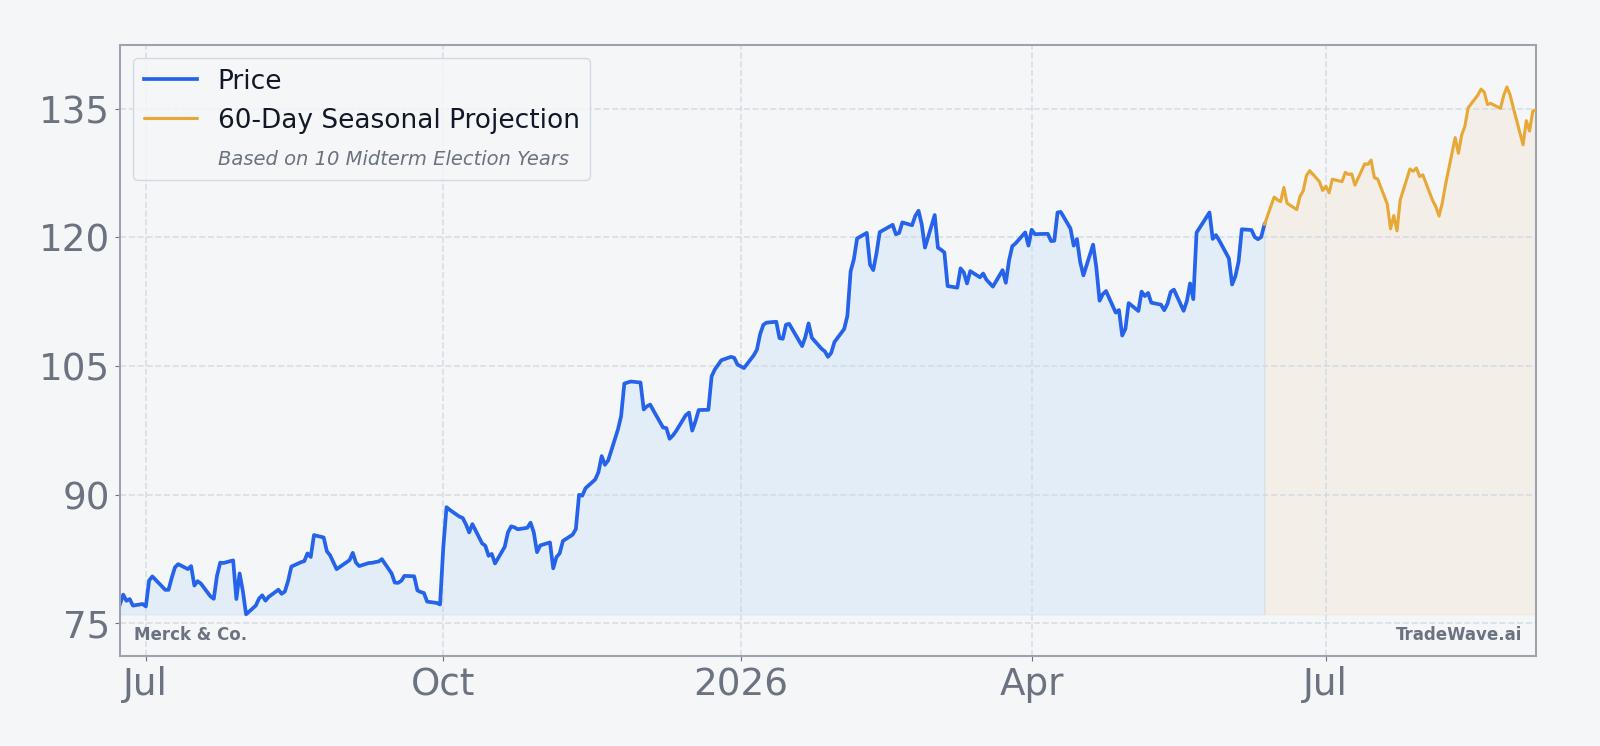
The chart below situates the latest move in its recent multi-month context and overlays a short-term seasonal projection.
What should traders watch as this MRK seasonal window opens?
First, the calendar. The 200-day MRK seasonal window tied to the year before the presidential election begins on Jun 22 and runs into early 2027, so any sustained move that starts in late June or July will unfold inside a regime that has historically favored longs. Traders will be watching whether price can hold above the 50-day moving average and challenge the $124.00 52-week high early in the window, which would be consistent with prior strong cycles.
Second, fundamentals and policy. Upcoming quarters will test whether Merck can keep delivering revenue and earnings above guidance while managing patent losses on legacy drugs and navigating U.S. drug pricing reforms.[2][3] Strong Keytruda performance, progress on new oncology combinations and clarity on Medicare negotiations would all help validate the historical MRK seasonal trend, while disappointments on any of those fronts could break it.
Third, volatility inside the window. Past midterm-election-year cycles show that even winning MRK trades have sometimes absorbed double-digit drawdowns before finishing higher, so traders may focus as much on intraperiod swings as on the final outcome. If early weakness in this window is shallow and quickly bought, it would rhyme with years like 2006 and 2022; a deeper shakeout closer to the 2002 pattern would signal a bumpier ride even if the longer-term seasonal bias remains intact.
Finally, sector and policy headlines. As the presidential race comes into clearer focus over the next several months, any shift in rhetoric around drug pricing, Medicare negotiations or oncology reimbursement could influence whether this historically strong MRK seasonal window repeats or stalls. The key tell will be how the stock behaves around those catalysts: resilience and higher lows would align with the 10-for-10 record, while repeated failures near resistance or a break below the 50-day moving average would suggest that this election-cycle pattern is losing some of its edge.
Sources
- [1] Forbes, "Why Is Merck Stock Surging?", Nov 26, 2025
- [2] Reuters, "Merck forecasts 2026 sales below estimates on patent losses", Feb 3, 2026
- [3] CNBC, "Merck beats quarterly estimates on strength of Keytruda and new products, narrows outlook", Apr 30, 2026
- [4] Reuters, "Merck posts higher third-quarter sales as Keytruda growth offsets drop from Gardasil", Oct 30, 2025
- [5] Reuters, "Merck says new growth opportunities to drive revenue of $70 billion by mid-2030s", Jan 12, 2026
- [6] Forbes, "Is Merck Stock’s Run Legitimate?", Dec 24, 2025
- [9] Seeking Alpha, "Key deals this week: Merck, Glencore, CrowdStrike, Marvell Technology, Steel Dynamics and more", Jan 10, 2026
- [13] Reuters, "Merck nears $6 billion acquisition of Terns Pharma to boost cancer portfolio, FT reports", Mar 25, 2026
About this seasonal analysis
Seasonal pattern data is sourced from TradeWave.ai, which analyzes historical price behavior across annual calendar windows going back up to 30 years. Read the full data methodology or the book The 100-Year Pattern by Afshin Moshrefi (2026 edition). Past performance of seasonal patterns does not guarantee future results. This article is for informational purposes only and does not constitute investment advice.