Kroger (KR) Earnings Beat and Steady 2026 Guidance Meet a Bullish Midterm Summer Streak
Kroger is heading into a historically strong 52-day midterm-year window just as shares trade near their 52-week low following an earnings beat and a renewed push on price investment.

What is the seasonal pattern for Kroger (KR)?
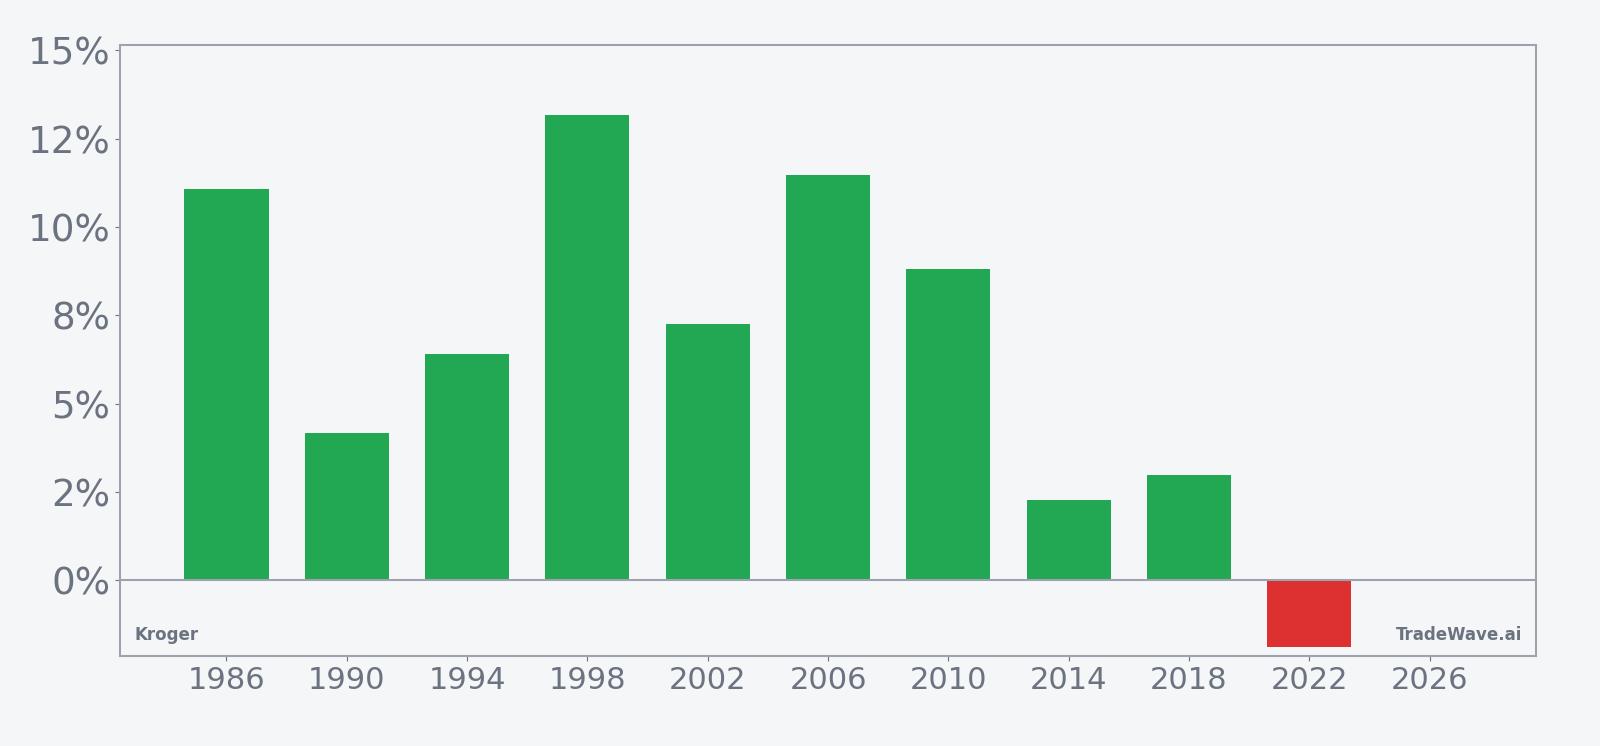
Kroger has risen in 9 of 10 midterm-year summer windows during this 52-day stretch, with an average gain of 7.51% in winning years.
- 9 for 10 in this window, with winning years averaging 7.51% gains and only one losing year in the sample.
- The upcoming 52-day window starts Jun 25, 2026 and covers the last 10 midterm election years for Kroger.
- Percent Profitable is 90%, with 9 winners and 1 loser across the historical midterm-year pattern.
- Including all years, Avg Profit - All is 7%, showing that the lone down year has not erased the typical upside.
- Intraperiod swings have been meaningful, with some years seeing double-digit drawdowns even when the window finished higher.
- For traders, this KR seasonal trend flags a historically bullish but volatile summer stretch in the grocery sector.
According to historical data from TradeWave.ai, this midterm-year summer stretch has behaved differently from an average month for Kroger, with a clear directional bias that many investors overlook.
How has Kroger (KR) traded in this midterm-year summer window?
Kroger has rallied in 9 of the last 10 midterm election years during this 52-day window, averaging 7.51% gains in the winning summers. Shares finished Tuesday at 56.99, leaving the stock about 24.8% below its 52-week high and only about 2.5% above its 52-week low, a setup that makes the upcoming seasonal stretch more interesting for a name that just beat quarterly sales expectations.[2]
Because this pattern is grouped by the presidential election cycle, it only looks at midterm election years, which tend to feature a different policy and spending backdrop than election years or the year after. For a defensive, value-focused retailer like Kroger, that mid-cycle environment often lines up with consumers trading down, elevated policy noise around healthcare and food benefits, and portfolio managers rotating toward staples exposure.
In this specific 52-day stretch starting Jun 25, the historical trade direction is long. Percent Profitable sits at 90%, with 9 winners and just 1 loser across the last ten midterm election years. Average profit in the winning years is 7.51%, while the all-years average, including the one down year, is still a solid 7%, which tells you the losing summer was not a major outlier to the downside.
The per-year breakdown shows how that plays out in practice. Strong years like 1998 and 2006 posted net returns of 13.18% and 11.47% respectively, while even the softer positive years such as 2014 and 2018 still finished up 2.27% and 2.97%. The lone losing year in 2022 saw a decline of 1.88%, which is modest compared with the double-digit gains in the best cycles.
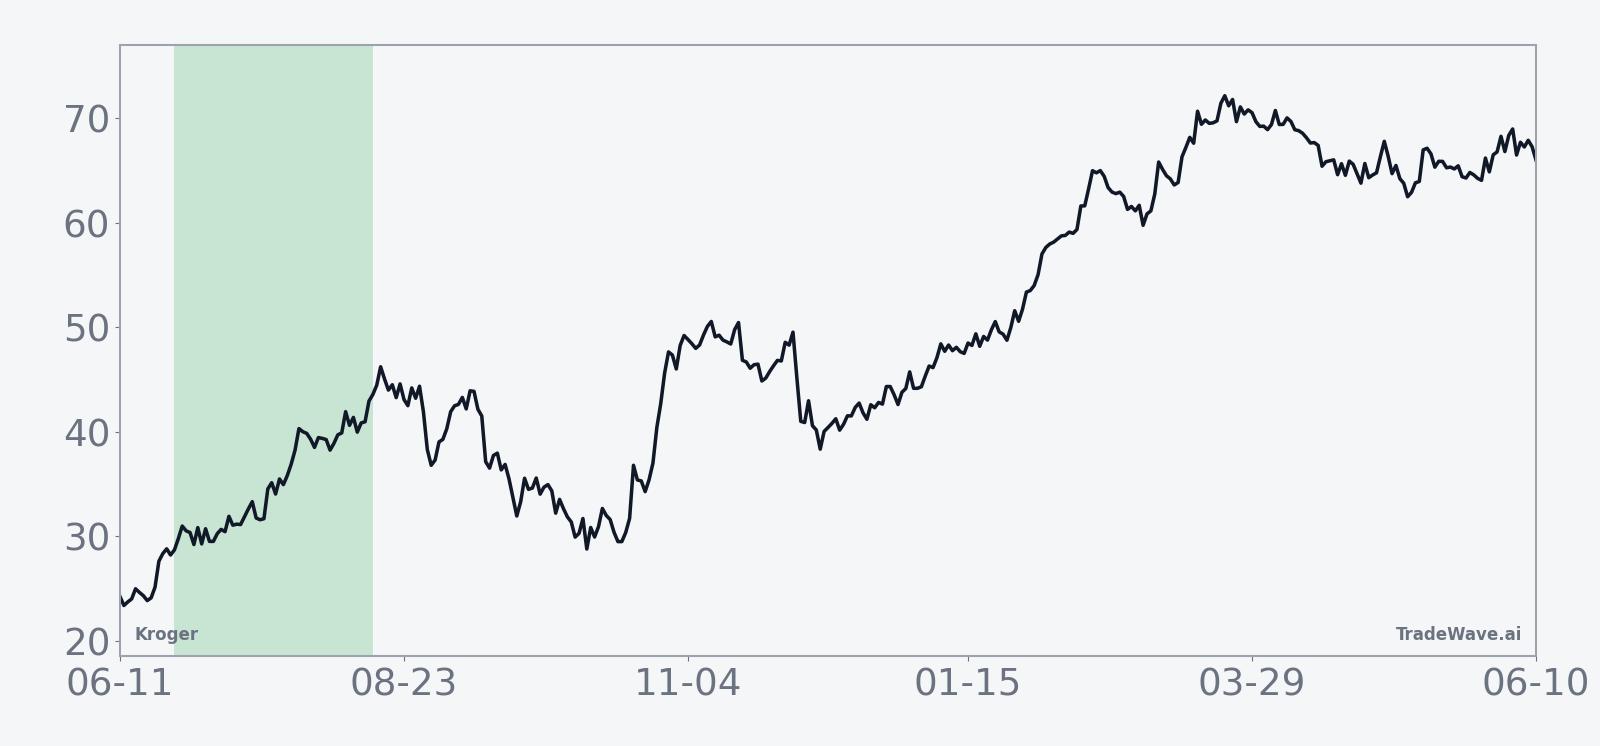
The historical seasonal average trend for this window slopes higher rather than grinding sideways. The typical pattern shows gains building over the course of the 52 days instead of a quick pop that fades, which is consistent with the relatively high Sharpe ratio of 1.27 for a single seasonal slice.
Year-by-year net returns and intraperiod swings round out the picture of upside bias with manageable but real drawdowns.
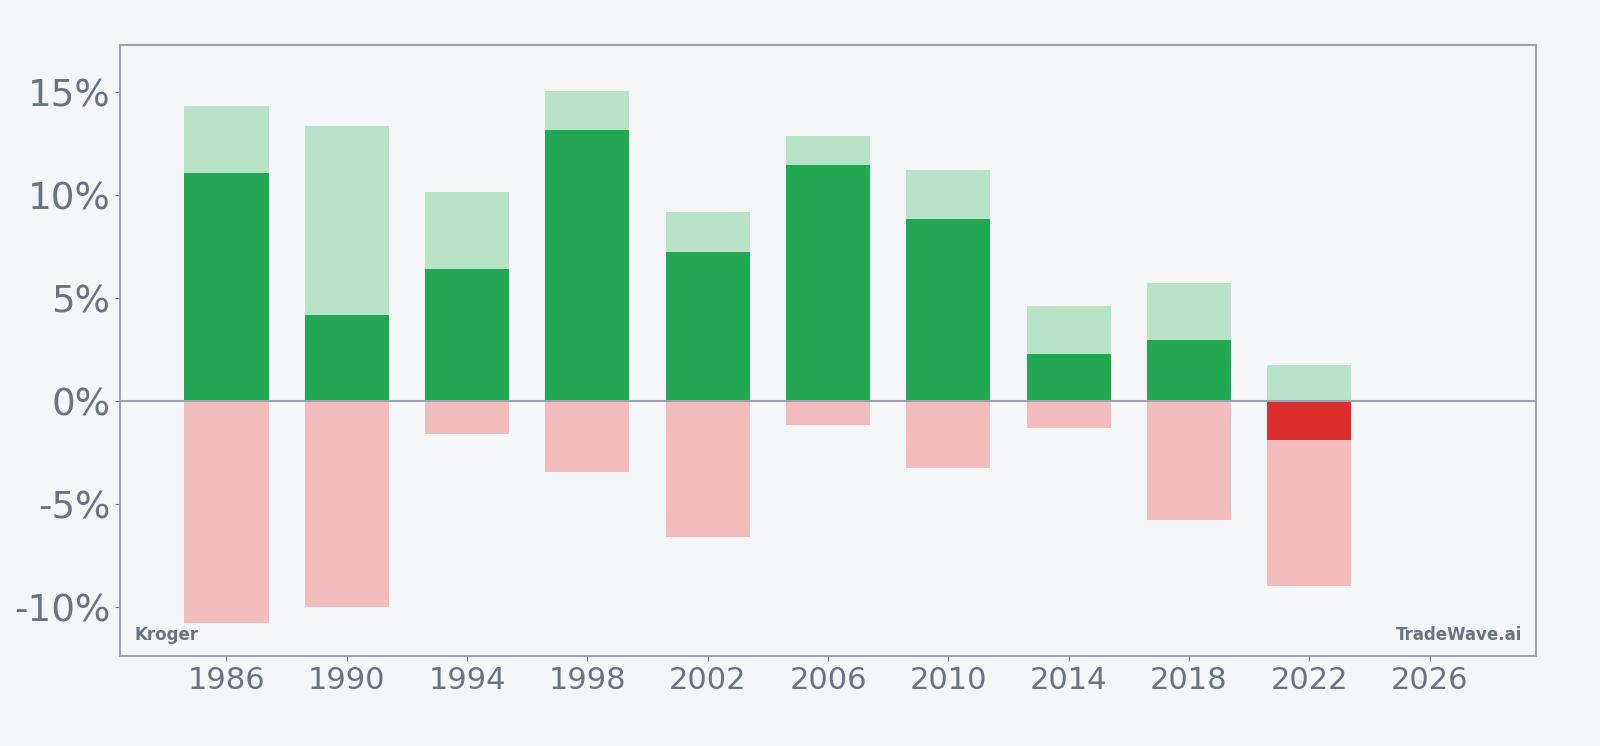
The combined net, maximum favorable move and maximum adverse move view shows why this Kroger trading window has appealed to active traders. In strong years such as 1986, 1998 and 2006, the best point-to-peak rallies inside the window ran between roughly 10% and 15%, while the worst drawdowns from entry often stayed in the mid-single digits. Even in the losing 2022 window, the stock briefly traded up about 1.77% before sliding to an intraperiod low nearly 9% below the starting point, a reminder that adverse excursions can be meaningful even when the final result is not catastrophic.
History does not guarantee future results; adverse excursions (MAE) can be large even in winning windows.
Why does Kroger (KR) follow this seasonal pattern?
One likely driver is the way Kroger’s fiscal calendar and promotional cadence line up with midyear consumer spending, especially in midterm election years when policy noise and inflation debates keep shoppers focused on value. Analysts have pointed to recurring summer promotions, private-label pushes and food-at-home demand as reasons grocery chains can see steady traffic in this stretch, even when broader markets are choppy.[2] This pattern may also reflect institutional portfolio repositioning into defensive retail ahead of the fall policy and budget season, which tends to favor staples names like Kroger when uncertainty rises.
What is driving Kroger (KR) today?
Kroger shares closed at 56.99 on Tuesday, up 2.2% on the day and trading about 24.8% below their 52-week high of 75.78, with the stock sitting only about 2.5% above its 52-week low of 55.60. The latest leg of the move came after Kroger reported quarterly sales of 46.12 billion dollars on Jun 18, topping Wall Street estimates while delivering adjusted earnings per share of 1.58 dollars and reiterating its fiscal 2026 outlook for 1% to 2% identical sales growth and 5.10 to 5.30 dollars in EPS.[2]
Management has been clear that the near-term playbook is about using cost savings to fund lower prices and service, rather than chasing margin expansion at the expense of traffic. In March 2026, the new chief executive emphasized reinvesting sourcing and efficiency gains into everyday prices to win back share from rivals, while keeping guidance relatively conservative.[5] That strategy fits the current macro backdrop, where U.S. consumer inflation data for May showed grocery prices edging higher even as shoppers remain price sensitive, pushing value-focused retailers like Kroger, Walmart and Dollar General to lean on promotions and private-label offerings.[1][2]
Capital structure flexibility is another piece of the story. In April 2026, Kroger filed an omnibus shelf registration covering a range of securities, giving the company more room to tap markets for debt or equity as it balances store investments, digital initiatives and potential strategic moves.[4] Around the same time, it launched the Pearl Street Academy workforce program and earned a top-tier workforce advancement rating, a signal that management is trying to tackle labor retention and productivity in a tight labor market.[3]
Operationally, Kroger is still digesting earlier bets on automation. In Sep 2025, the company said it would review its automated fulfillment network built with Ocado on a site-by-site basis, prompting questions about how aggressively it will lean into centralized warehouses versus more flexible store-based fulfillment.[14] That reassessment sits in the background as the company doubles down on price and service, a combination that could matter for margins if automation spending is dialed back.
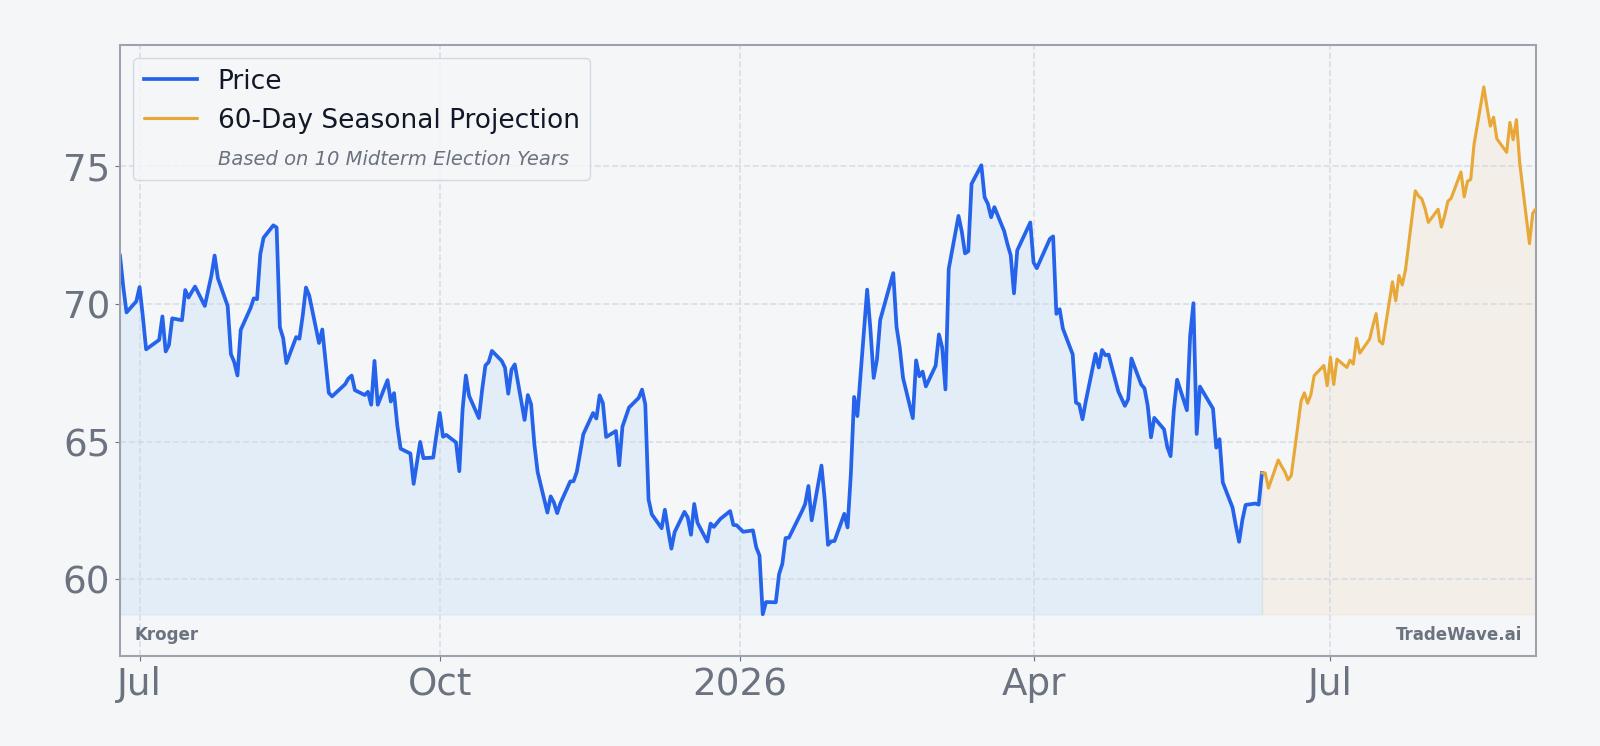
The chart below situates the latest move in its recent multi-month context, alongside a 60-day seasonal projection based on past midterm-year behavior.
What should traders watch in this Kroger (KR) seasonal window?
First, watch how Kroger trades as the 52-day window kicks off on Jun 25. In prior midterm election years, stronger summers often saw the stock start to grind higher early in the window rather than waiting for a late surge, so a firm tone in the next couple of weeks would be more consistent with the historical pattern than another sharp leg down.
Second, keep an eye on how the price-investment strategy interacts with inflation and traffic data. If grocery inflation stays sticky while Kroger leans into promotions and private label, any signs of share gains or better-than-feared margins in upcoming updates could reinforce the historical tendency for this window to favor longs.[1][2][5] Conversely, if value-focused shoppers migrate more aggressively to competitors or if price cuts bite too hard into earnings, this could be one of the rare years where the seasonal tailwind fails to show up.
Third, levels matter. With the stock only a couple of dollars above its 52-week low and well below the 50-day moving average around 64.89, traders will be watching whether KR can reclaim that moving average during the window or whether rallies stall below it. A sustained move back toward the mid-60s would look more like the historical winners, while repeated failures near resistance would start to resemble the weaker years in the per-year table.
Finally, monitor capital-markets and strategic headlines. Any use of the shelf registration for debt refinancing, buybacks or targeted growth projects could change how investors handicap Kroger’s balance between price investment and returns to shareholders.[3][4] Add it up: a historically strong midterm-year summer window, a stock sitting near its lows after an earnings beat, and a management team leaning into value-focused retailing create a setup where behavior over the next 52 days will tell you whether this cycle rhymes with the last nine or looks more like the lone outlier.
Sources
- [1] Reuters, "Kroger raises annual sales forecast as grocery demand stays strong," Sep 11, 2025.
- [2] Reuters, "Kroger beats quarterly sales estimates," Jun 18, 2026.
- [3] Yahoo Finance / Simply Wall St, "Kroger Workforce Push And Valuation Gap Draw Investor Attention," Apr 22, 2026.
- [4] Yahoo Finance / Simply Wall St, "How Kroger’s New Shelf Registration and Workforce Push Could Shape Kroger (KR) Investors’ Outlook," Apr 24, 2026.
- [5] Reuters, "Kroger keeps forecasts soft as new CEO bets on growth by keeping prices down," Mar 5, 2026.
- [14] Reuters, "Ocado shares plunge 13% as US partner Kroger rethinks warehouse strategy," Sep 12, 2025.
About this seasonal analysis
Seasonal pattern data is sourced from TradeWave.ai, which analyzes historical price behavior across annual calendar windows going back up to 30 years. Read the full data methodology or the book The 100-Year Pattern by Afshin Moshrefi (2026 edition). Past performance of seasonal patterns does not guarantee future results. This article is for informational purposes only and does not constitute investment advice.