HP Inc. (HPQ) Warns of PC Shipment Slump While Entering a Historically Soft June Stretch
HP Inc. is sitting in a 12-day midterm-year trading window that has often leaned lower, even as shares hold above their 50-day average after a sharp post-earnings rebound.
What is the seasonal pattern for HP Inc. (HPQ)?
HP Inc. has moved in favor of short trades in 7 of the last 10 midterm-year June windows, with winning years averaging a 4.68% move in the trade direction.
- 7 wins and 3 losses for the short setup in this 12-day window across the last 10 midterm election years, with winning years averaging a 4.68% move.
- Percent Profitable is 70%, with 7 winners and 3 losers, and an all-years average outcome of 4% in the trade direction.
- This HPQ seasonal trend runs for 12 trading days starting Jun 21 in midterm election years, targeting downside rather than upside.
- Average loss across losing years is a modest -0.11%, which keeps the Avg Profit - All close to the winners-only figure.
- Intraperiod swings have been meaningful, with historical best and worst excursions showing that both rallies and drawdowns can develop quickly inside the window.
- Sharpe ratio of 0.97 and a TradeWave Ratio of 1.2 point to a historically efficient short window compared with typical HP Inc. trading behavior.
According to historical data from TradeWave.ai, this mid-June stretch for HP Inc. behaves differently in midterm election years than in a typical month, with a distinct short-side bias that traders often overlook.
How has HP Inc. (HPQ) traded in this midterm-year June window?
In midterm election years, this 12-day June window has historically favored short positions in HP Inc., with 7 winners and 3 losers and an average 4.68% move in the trade direction. The current iteration began on Jun 21 and is already underway, with HPQ last changing hands at 23.71, up 0.7% on the day and trading above its 50-day moving average around 21.98.
Grouping the data by the presidential election cycle matters here because corporate spending, regulation risk and fiscal policy often shift in the midterm year, which can change how hardware names like HPQ trade around the summer. This pattern phase covers the last 10 midterm election years, so it reflects how HP Inc. has behaved in similar policy backdrops rather than in a random run of calendar years.
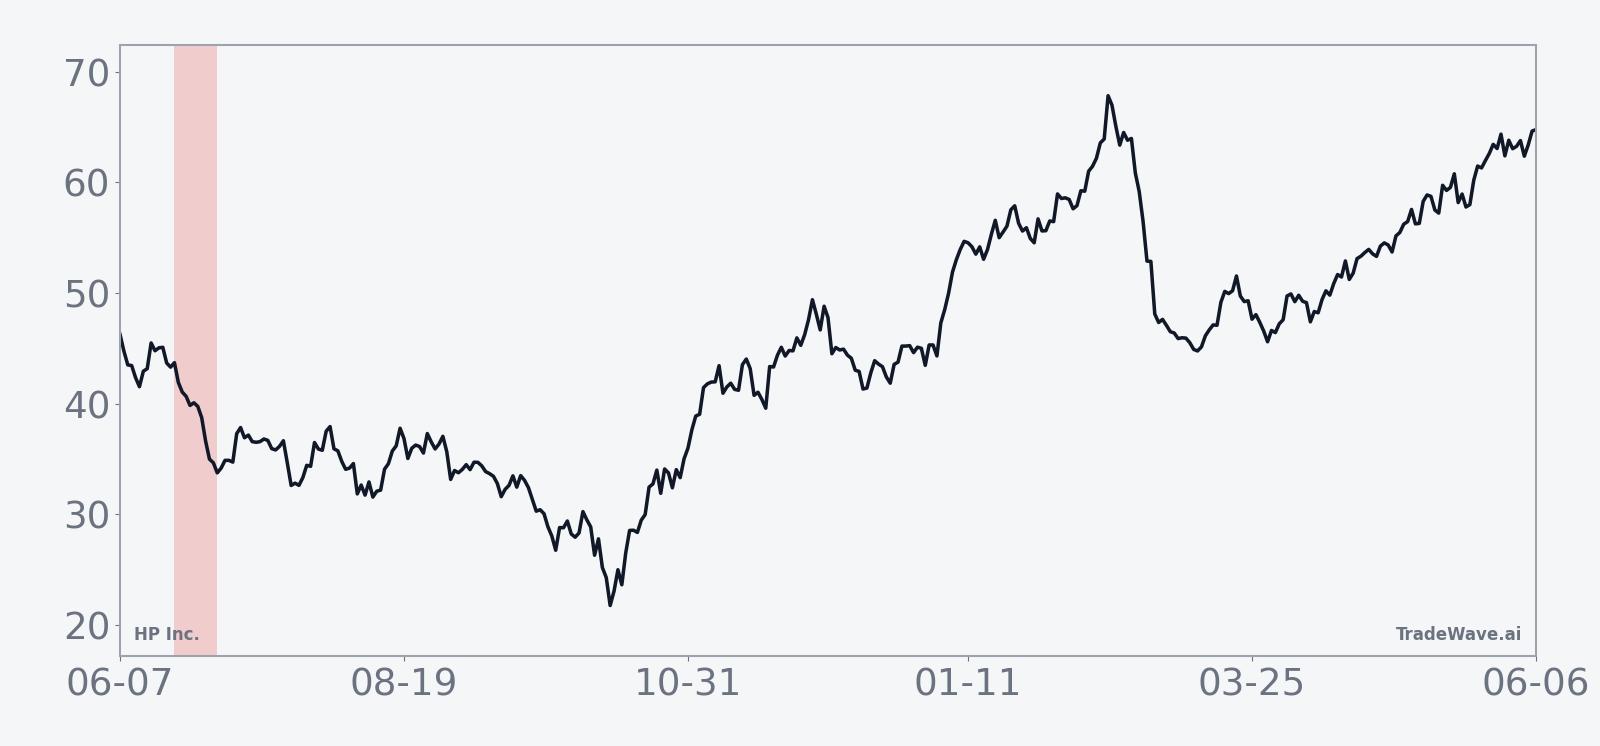
The historical seasonal average trend for this HPQ trading window shows a tendency for the stock to drift lower across the period rather than snap sharply in one direction. For a short setup, that means the typical pattern has been a steady grind in favor of the trade rather than a single-day air pocket.
A stacked view of yearly net returns alongside best and worst intraperiod moves shows how much HPQ has swung inside this window.
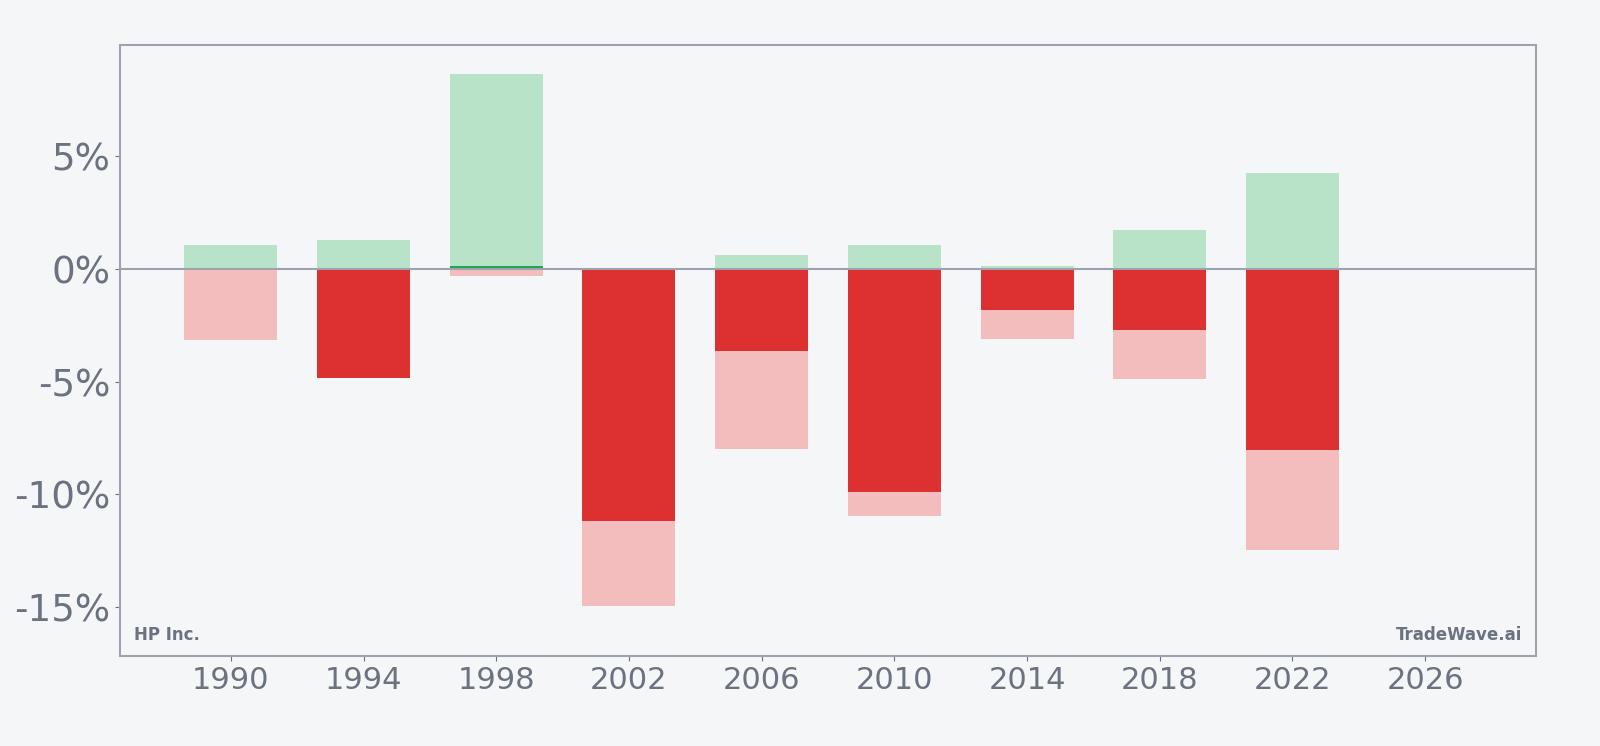
Per-year bars show that the strongest short-friendly years, such as 2002 and 2010, delivered sizeable negative net returns with deep adverse moves for longs, while softer years like 1998 and 2014 were closer to flat. Maximum favorable excursions in several years reached well beyond the final net result, which means intraperiod moves often extended further in the trade direction before partial reversals.
On the risk side, maximum adverse excursions have at times been meaningful even in winning years, underscoring that HPQ can squeeze against shorts before rolling back over. The combination of a 1.2 TradeWave Ratio and a 0.97 Sharpe ratio suggests that, historically, the window has offered a relatively efficient payoff profile for short trades, but only for traders who could tolerate those interim swings.
History does not guarantee future results; adverse excursions can be large even in winning windows, and HPQ’s behavior in any single year can diverge sharply from the historical average.
Why does HP Inc. (HPQ) follow this seasonal pattern?
This HPQ seasonal pattern may reflect how corporate PC budgets and channel inventories evolve in the middle of the year during midterm election cycles. One likely driver is that enterprise buyers often pause or re-evaluate spending as policy debates and regulatory agendas heat up, which can weigh on hardware orders and sentiment. Analysts have also pointed to sector rotation around midyear, when investors reassess cyclical exposure in PC hardware against other technology themes, amplifying short-term downside pressure in names like HP Inc.
What is driving HP Inc. (HPQ) today?
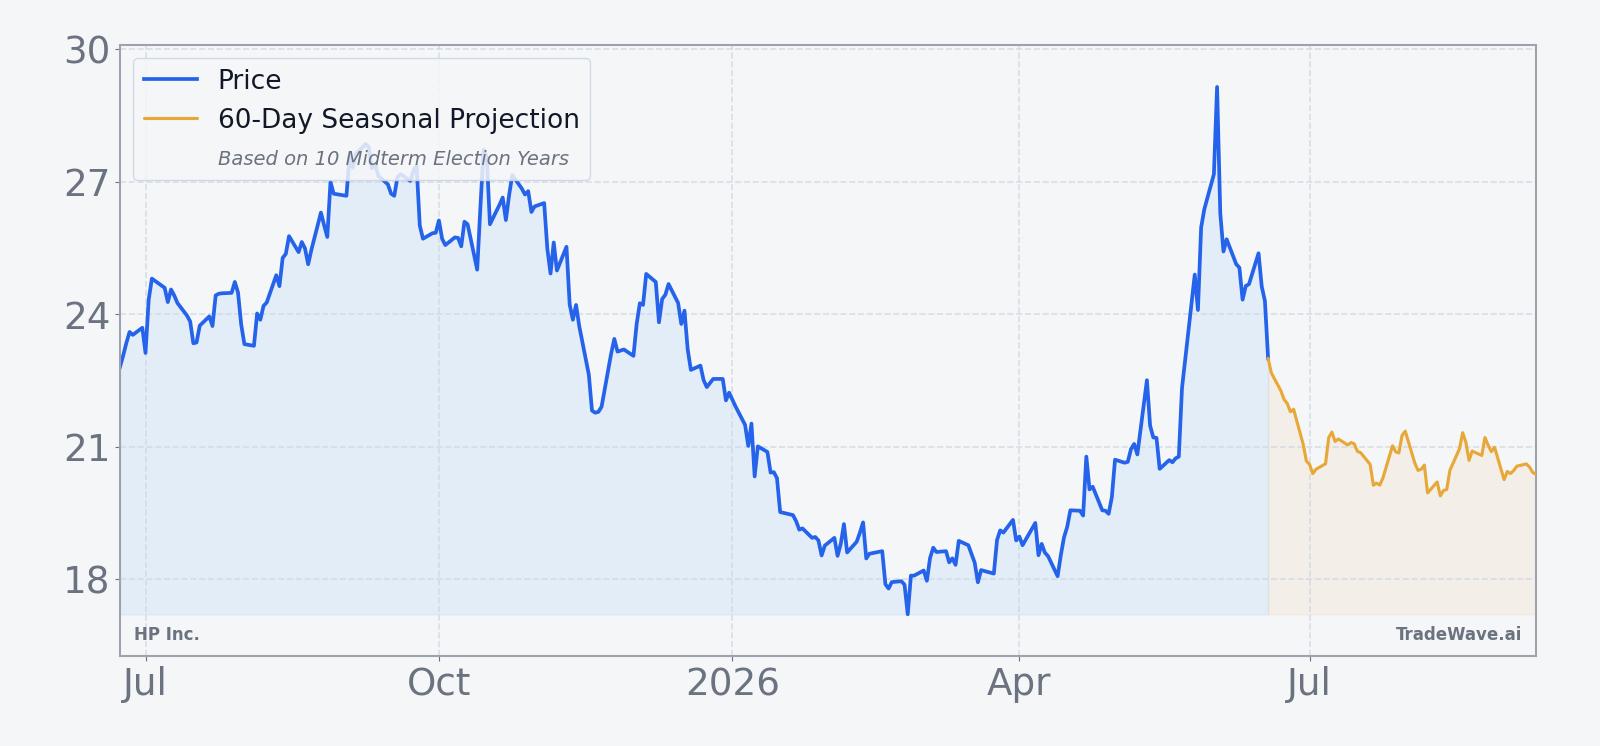
HPQ closed at 23.71 on Jun 24, up 0.17 points or 0.7%, trading between 23.18 and 24.08 on the day with volume of about 11.8 million shares against a 20-day average near 25.8 million. The stock sits above its 50-day moving average around 21.98 and has climbed roughly 10.1% over the past month, helped by a sharp post-earnings jump in late May.
On May 27, 2026, HP reported quarterly results that beat earnings and revenue estimates, sparking a double-digit rally as investors reassessed the company’s PC and print outlook.[1] In February 2026, management had warned that memory-chip volatility and double-digit declines in PC unit shipments could pressure margins and keep fiscal 2026 adjusted profit at the low end of prior guidance, even as AI-enabled PCs and the Windows 11 upgrade cycle supported pricing and mix.[2] That tension between cautious shipment guidance and stronger profitability from higher-end, AI-capable devices remains central to how traders frame HPQ’s risk-reward into the summer.
The chart below situates the latest move in its recent multi-month context alongside a 60-day seasonal projection.
How does the election cycle shape HP Inc. (HPQ) seasonality?
HPQ’s current seasonal window is drawn from the last 10 midterm election years, a phase that often brings more policy noise around trade, technology regulation and federal spending. For a PC and printing heavyweight like HP Inc., that backdrop can influence corporate IT budgets, government procurement and investor appetite for cyclical hardware exposure. By focusing on midterm years only, this HPQ seasonal trend filters out behavior from election and pre-election years, which tend to have different risk-on and risk-off patterns for tech stocks.
In this midterm-year context, the 12-day June window has historically been a soft patch for HPQ, even when the broader tech sector was firm. The pattern’s short direction and 70% win rate suggest that, in prior cycles, rallies into this period often stalled or reversed as investors digested guidance, macro headlines and early signals on back-to-school and holiday PC demand. That makes the current setup notable, because HPQ is entering the heart of this window from a position of strength after its recent earnings beat.
What should traders watch in this HPQ seasonal window?
For traders tracking this HPQ seasonal pattern, the first marker is whether the stock can hold above its 50-day moving average near 21.98 while the 12-day window runs its course. A sustained break below that level during the window would be more in line with the historical short bias, while a grind higher that shrugs off intraperiod volatility would contradict the typical midterm-year June behavior.
Fundamentally, updates on memory-chip pricing and any fresh commentary on PC shipment trends will matter, given HP’s February warning that double-digit unit declines could persist even as AI PCs support revenue and profit.[2] Traders will also be watching for signs that the post-earnings enthusiasm from late May is fading or consolidating, especially if volume dries up relative to the 20-day average. Add it up: the next several sessions offer a clean test of whether HPQ’s historical midterm-year seasonal weakness still has teeth in an AI-driven PC cycle.
Sources
About this seasonal analysis
Seasonal pattern data is sourced from TradeWave.ai, which analyzes historical price behavior across annual calendar windows going back up to 30 years. Read the full data methodology or the book The 100-Year Pattern by Afshin Moshrefi (2026 edition). Past performance of seasonal patterns does not guarantee future results. This article is for informational purposes only and does not constitute investment advice.