Adobe Inc. (ADBE) Has Rallied in 8 of 9 Midterm Windows, Averaging 21% Gains
Adobe Inc. is heading into a historically strong 264-day midterm-election-year trading window just as the stock trades near 52-week lows after a steep pullback from its AI-driven surge.

What is the seasonal pattern for Adobe Inc. (ADBE)?
Adobe Inc. has risen in 8 of 9 midterm-election-year windows starting around June 30, with an average gain of 24.24% in winning years.
- 8 wins, 1 loss in this 264-day midterm-year window, with winning years averaging 24.24% gains.
- Percent Profitable is 89%, with 8 winners and just 1 loser across the last 9 midterm election years.
- Including the lone down year, the all-years average return in this window is still a strong 21%.
- The worst loss in the sample is only -0.87%, while several years posted gains above 30%.
- Intraperiod swings have been large, with some years seeing adverse moves near -55% before finishing higher.
- The TradeWave Ratio of 2.28 and Sharpe ratio of 1.32 point to a historically powerful long-biased seasonal trend.
According to historical data from TradeWave.ai, this upcoming midterm-election-year stretch has behaved very differently from an average year for Adobe Inc., with a distinct long-biased seasonal profile that traders rarely see discussed in day-to-day coverage.
How strong is the upcoming seasonal window for Adobe Inc. (ADBE)?
Adobe Inc. has rallied in 8 of the last 9 midterm-election-year windows that begin around Jun 30 and run for 264 trading days, averaging 24.24% gains in the winning years. Today the stock closed at $194.90, leaving it about 50.4% below its 52-week high of $392.58 and only about 2.5% above its 52-week low of $190.12, after a bruising one-month slide of 20.16% that has reset expectations around its AI story.[2][3][4]
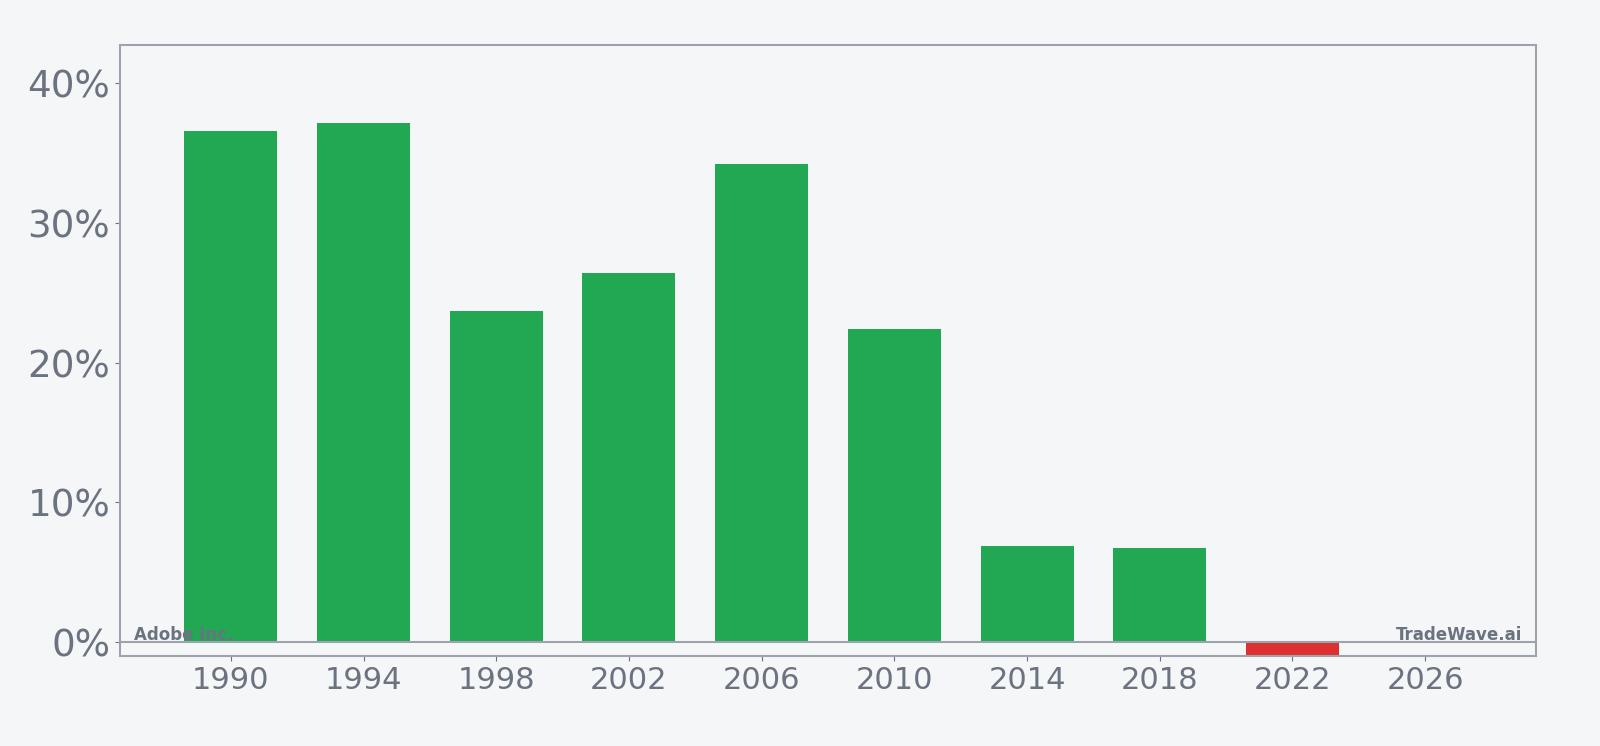
Grouping the data by the presidential election cycle matters here because this window sits in the midterm election year, a phase that often brings policy noise early on but has historically rewarded patient exposure as markets look ahead to the pre-election year. For a large-cap software and AI bellwether like Adobe, that means this specific midterm-to-pre-election stretch has repeatedly lined up with periods when investors refocus on earnings power and recurring revenue rather than short-term macro headlines.
This seasonal window begins on Jun 30, 2026 and spans 264 trading days, carrying through the back half of the midterm election year and deep into the year before the presidential election. Historically, during this period, Adobe Inc. has shown a strong long-biased tendency, with 89% of the sampled midterm-year windows finishing higher and only one small losing year of -0.87%. The median outcome of 23.65% and an all-years average of 21% underline how consistently this Adobe Inc. trading window has skewed positive for long exposure.
The per-year table shows that the strongest years in this pattern were 1994 and 1990, with net returns of 37.13% and 36.55% respectively, while the weakest was 2022 at -0.87%. In several cycles, such as 2006 and 2010, the stock pattern analysis shows gains north of 22% even after weathering meaningful volatility inside the window. Add it up: 443% cumulative return across the nine midterm-year windows, annualized at 20.7%, is a powerful historical backdrop for a long-only seasonal regime.
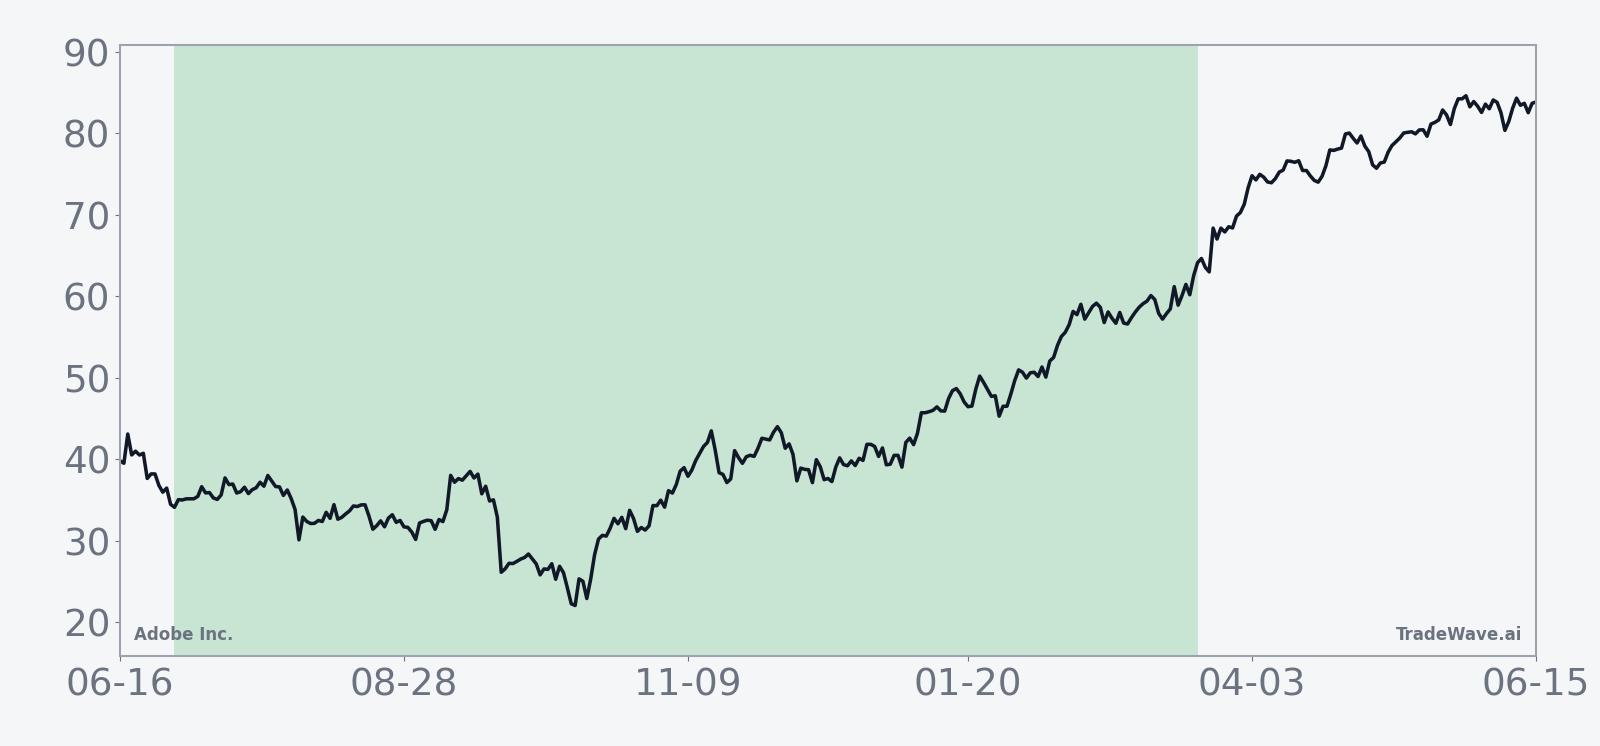
The historical seasonal average trend for this window slopes higher for most of the period, with relatively few flat stretches, which fits a long pattern where gains tend to accrue over months rather than in a single burst. The profile suggests that in prior midterm cycles, Adobe often built momentum as the window progressed, aligning with the broader tendency for risk assets to firm up as markets transition from midterm uncertainty into the typically stronger year before the presidential election.
Yearly net and peak moves highlight upside persistence amid typical drawdowns.
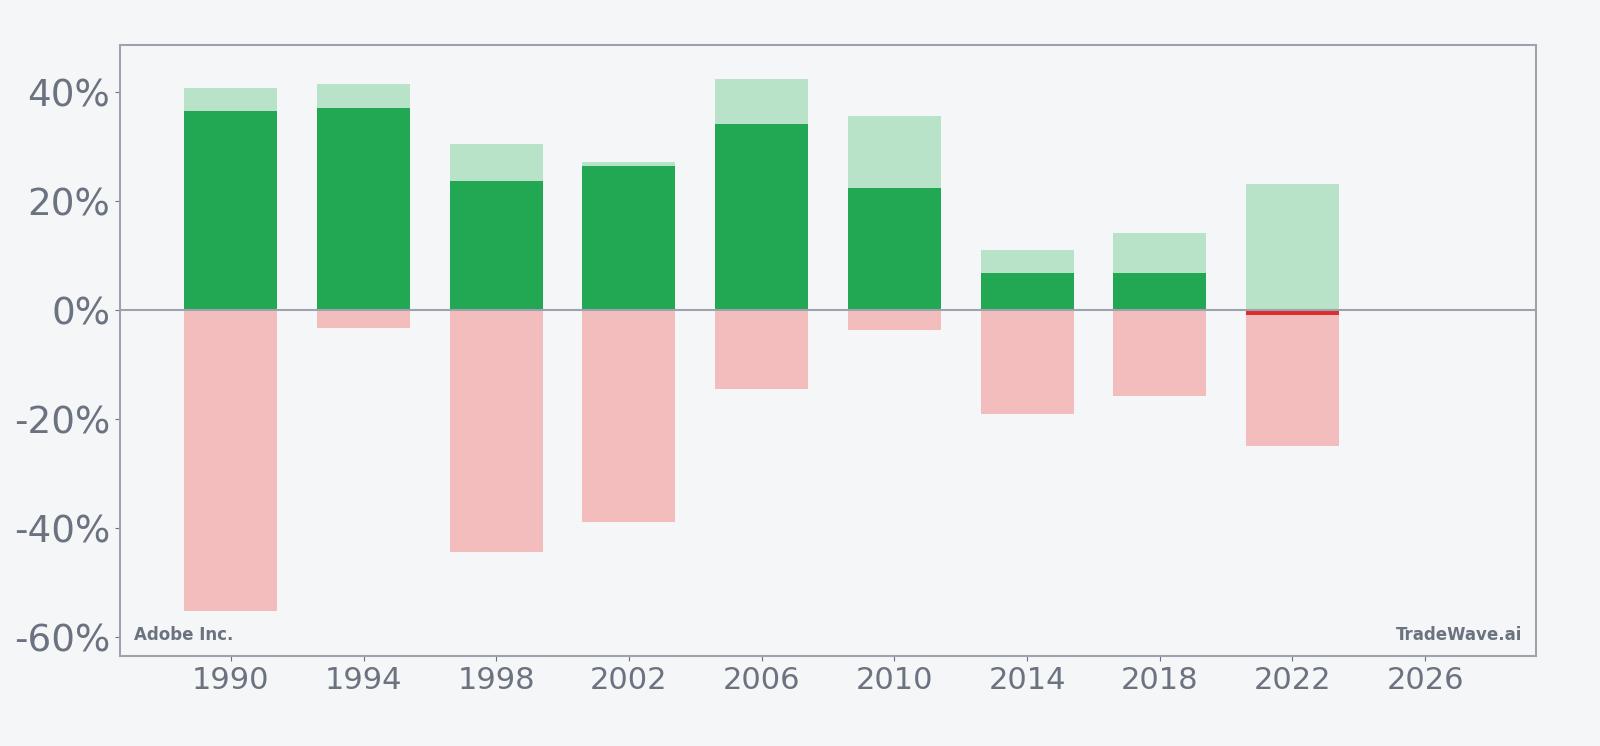
The stacked net/MFE/MAE bars show that even in winning years, Adobe has often experienced deep intraperiod drawdowns, with maximum adverse excursions as steep as about -55.26% in 1990 and -44.31% in 1998 before finishing the window solidly higher. At the same time, maximum favorable moves have been large, with several years posting peak run-ups above 40%, which is consistent with a TradeWave Ratio of 2.28 that signals substantial travel in the trade direction within the window. The key message: this has been a strong long seasonal pattern, but one that has not been smooth, and traders have historically needed to tolerate sizable swings to capture the full move.
History does not guarantee future results; adverse excursions (MAE) can be large even in winning windows.
Why does Adobe Inc. (ADBE) follow this seasonal pattern?
One likely driver is the clustering of Adobe’s fiscal-year cadence and product updates around this part of the calendar, which can concentrate earnings surprises and guidance changes into the back half of the midterm year and the following pre-election year. Analysts have also pointed to institutional portfolio repositioning around AI and software leaders as policy uncertainty from the midterm election fades and risk appetite improves. For a subscription-heavy business like Adobe, that combination of recurring revenue visibility and renewed risk-on sentiment may help explain why this specific midterm-year seasonal window has so often favored the long side.
What is driving Adobe Inc. (ADBE) today?
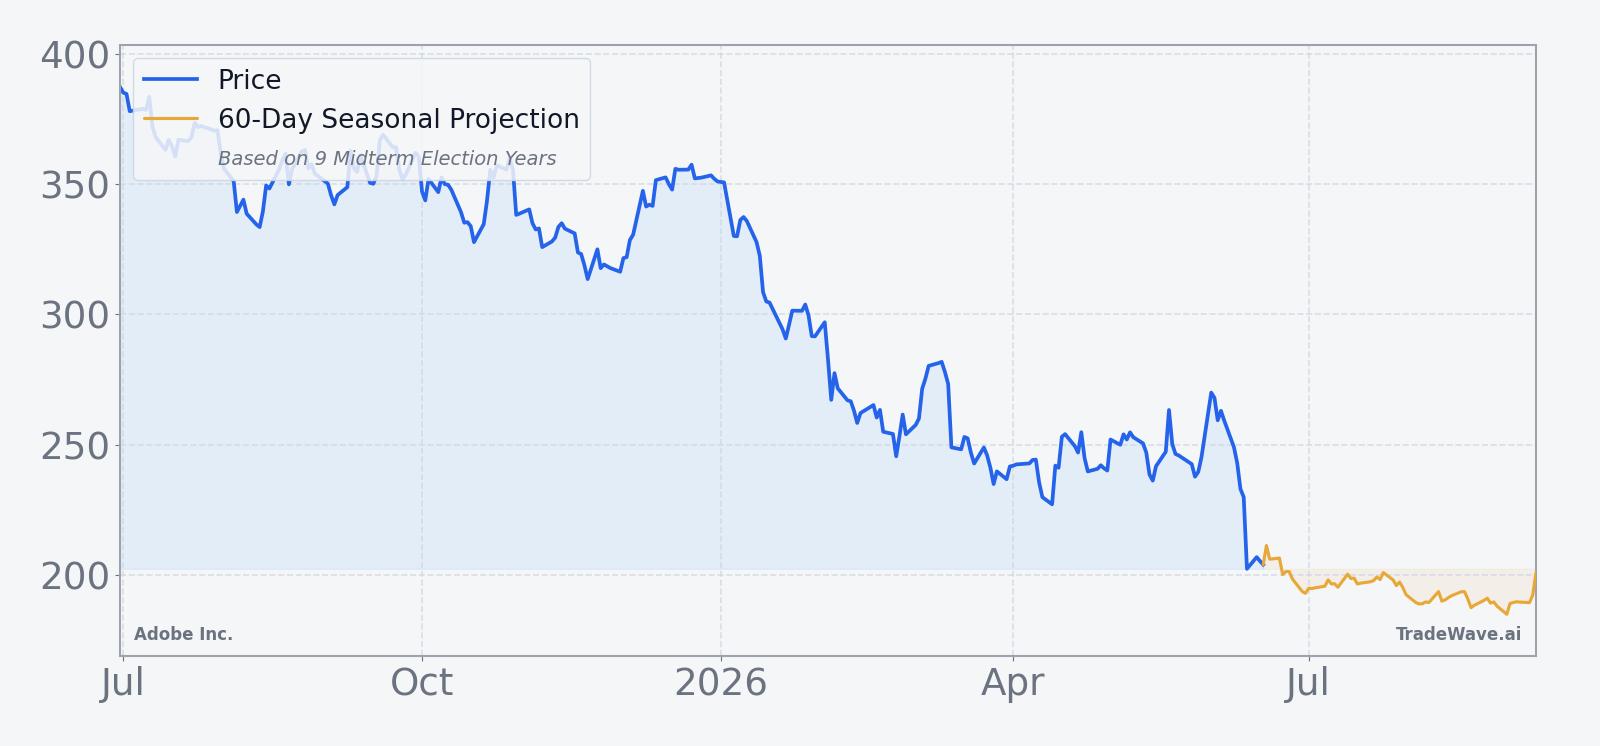
Adobe shares slipped 0.13% to $194.90 on Monday, extending a one-month drop of 20.16% that has dragged the stock to within about 2.5% of its 52-week low and far below the $392.58 high set earlier in the year.[2][3][4] The pullback comes despite a strong Q2 2026 earnings print on Jun 11, when Adobe reported record revenue of $6.62 billion and non-GAAP EPS of $5.96, both ahead of Wall Street estimates, and raised full-year revenue and profit guidance on the back of AI demand and the Semrush acquisition.[2][3] Investors focused instead on management’s decision to keep full-year ARR growth guidance at 10.2%, a level some saw as conservative given roughly $480 million of ARR from Semrush, which helped trigger profit-taking after a big AI-driven run.[2][4]
The chart below situates the latest move in its recent multi-month context, alongside a 60-day seasonal projection.
The latest earnings call also highlighted how central AI has become to Adobe’s growth story, with management pointing to strong demand for generative features and AI-influenced ARR that supports both revenue and cash flow strength.[3] In mid-June, one analysis framed the stock as having meaningful upside potential from depressed levels, citing a consensus price target around $329.33 from a Yahoo Finance and 24/7 Wall St. aggregation, although that target reflects a much higher prior trading range than today’s sub-$200 price.[4] Insider activity commentary around the quarter flagged net selling as a yellow flag rather than a clear red alert, a reminder that even in a strong seasonal setup, positioning and governance signals can complicate the picture.[4]
From a macro and sector standpoint, Adobe remains a key software and AI player, with AI adoption and monetization across its product suite driving both ARR and revenue growth.[3] That positioning has made the stock a proxy for broader enthusiasm around generative AI, which can amplify both rallies and corrections as sentiment swings. The tension heading into this seasonal window is clear: the historical pattern has been strongly bullish for longs, but the stock is entering it from a position of weakness, with investors still digesting guidance, valuation and insider selling signals.
What should traders watch as this Adobe Inc. seasonal window opens?
As the Jun 30 window approaches, the first thing to watch is whether Adobe can stabilize above the recent 52-week low near $190.12 or whether selling pressure pushes it decisively through that level.[2][3][4] A firm base forming near current prices would line up more cleanly with the historical midterm-year seasonal trend, which has typically seen gains build over months rather than from a deepening slide. Second, upcoming earnings and any interim updates on AI-influenced ARR will be critical, since prior winning years in this pattern often coincided with upbeat guidance and strong subscription momentum.[2][3]
Third, traders should keep an eye on insider activity and any fresh commentary around governance or executive selling, given that Q2 discussions flagged net insider selling as a yellow flag.[4] If insider selling slows or reverses while the stock begins to respect support and respond positively to AI and ARR headlines, that would be more consistent with the historical long-biased seasonal window. If, instead, insider selling accelerates or the stock continues to make new lows despite the seasonal tailwind, that would be an early sign that this cycle could rhyme more with the weaker 2022 outcome than with the big double-digit gain years.
Finally, because this window bridges the back half of the midterm election year and the run-up to the presidential election, policy and regulatory headlines around AI, data privacy and digital content will matter. Historically, the transition from midterm uncertainty to the year before the presidential election has been a friendlier backdrop for growth stocks, but the path has rarely been smooth. For Adobe, how the stock behaves inside this 264-day window relative to those catalysts will tell traders whether the long-standing seasonal pattern is still in force or starting to fade.
Sources
- Yahoo Finance: Adobe (ADBE) Reaffirms AI Leadership With Strong Revenue and Cash Flow (Jan 2, 2026).
- Yahoo Finance: Adobe Beats Expectations and Raises Outlook, but Shares Fall on ARR Concerns (ADBE) (Jun 12, 2026).
- Yahoo Finance / GuruFocus: Adobe Inc (ADBE) Q2 2026 Earnings Call Highlights (Jun 12, 2026).
- Yahoo Finance / 24/7 Wall St.: Adobe Stock Set for 46% Gain After Earnings Beat (Jun 15, 2026).
- Reuters: Adobe raises annual revenue and profit forecasts on strong design software demand (Sep 11, 2025).
- Forbes: How Adobe Stock Rises To $330 (Feb 27, 2026).
- Forbes: Adobe Stock: High Cash, Higher Upside? (Jan 29, 2026).
About this seasonal analysis
Seasonal pattern data is sourced from TradeWave.ai, which analyzes historical price behavior across annual calendar windows going back up to 30 years. Read the full data methodology or the book The 100-Year Pattern by Afshin Moshrefi (2026 edition). Past performance of seasonal patterns does not guarantee future results. This article is for informational purposes only and does not constitute investment advice.