IBM Nears Seasonal Midterm Window With Perfect Summer Rally Record
IBM is approaching a 44-day midterm-year seasonal window that has never produced a loss in this dataset, just as the stock pulls back sharply from recent highs and options activity heats up.

What is the seasonal pattern for IBM (IBM)?
IBM has risen in 8 of 8 midterm-year summer windows starting around Jul 5, with an average gain of 6.58% in winning years.
- 8 for 8 in this window, with IBM averaging 6.58% gains across all winning years over the 44-day stretch.
- The upcoming trading window begins Jul 5, 2026 and runs for 44 days, grouped across the last 8 midterm election years.
- Percent Profitable is 100%, with 8 winners and 0 losers in this IBM seasonal trend sample.
- Average winner gains of 6.58% stack up to a 64% cumulative return across the eight historical IBM trading windows.
- The TradeWave Ratio (TWR) of 1.3 suggests price has typically traveled meaningfully in the long direction within the window, while the Sharpe ratio of 1.1 points to solid risk-adjusted returns.
- Intraperiod swings have included double-digit drawdowns in some years, so the IBM seasonal pattern has combined strong upside with real downside volatility.
According to historical data from TradeWave.ai, this midterm-year summer stretch has behaved very differently from an average month on the IBM calendar, and the next iteration is just days away.
How has IBM (IBM) traded in past midterm-year summer windows?
IBM has risen in 8 of 8 midterm election years during the 44-day window that starts around Jul 5, averaging 6.58% gains and delivering a 64% cumulative return across those cycles. Shares finished Monday at $249.10, down 5.1% on the day and about 25.1% below the 52-week high of $332.46, after a volatile June run that included a 15% spike tied to a viral political video and bullish brokerage commentary.[9] Heavy options trading around the U.S. Commerce Department’s $1 billion quantum-computing grant and that same June 1 price surge has flagged IBM as a crowded tactical trade heading into this seasonal window.[10]
Because this pattern is grouped by the presidential election cycle, it only looks at IBM’s behavior in the midterm election year, which has often featured policy uncertainty, shifting fiscal priorities and sector rotation inside large-cap tech. That focus strips out the typically stronger pre-election year and more volatile election year, giving a cleaner read on how IBM has traded in the middle of the political cycle when Washington is debating budgets, regulation and industrial policy rather than campaigning.
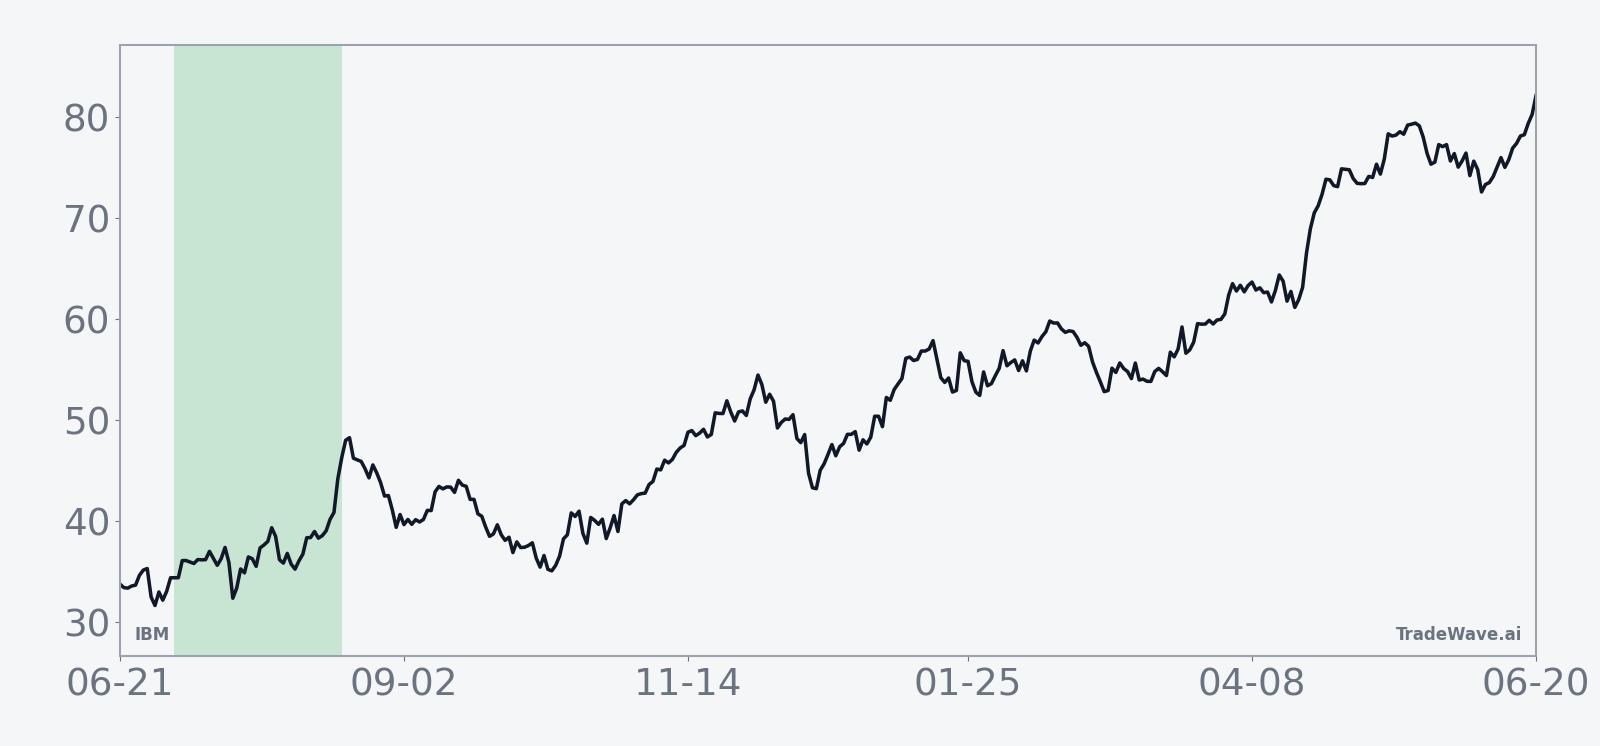
The historical seasonal average shows IBM’s gains in this window tend to build gradually rather than in a single spike. In several years, the curve slopes higher from the first week, with modest pauses mid-window before finishing stronger into the final third. That profile fits a pattern where investors digest midyear earnings and macro headlines, then lean back into large-cap tech and enterprise software as visibility improves.
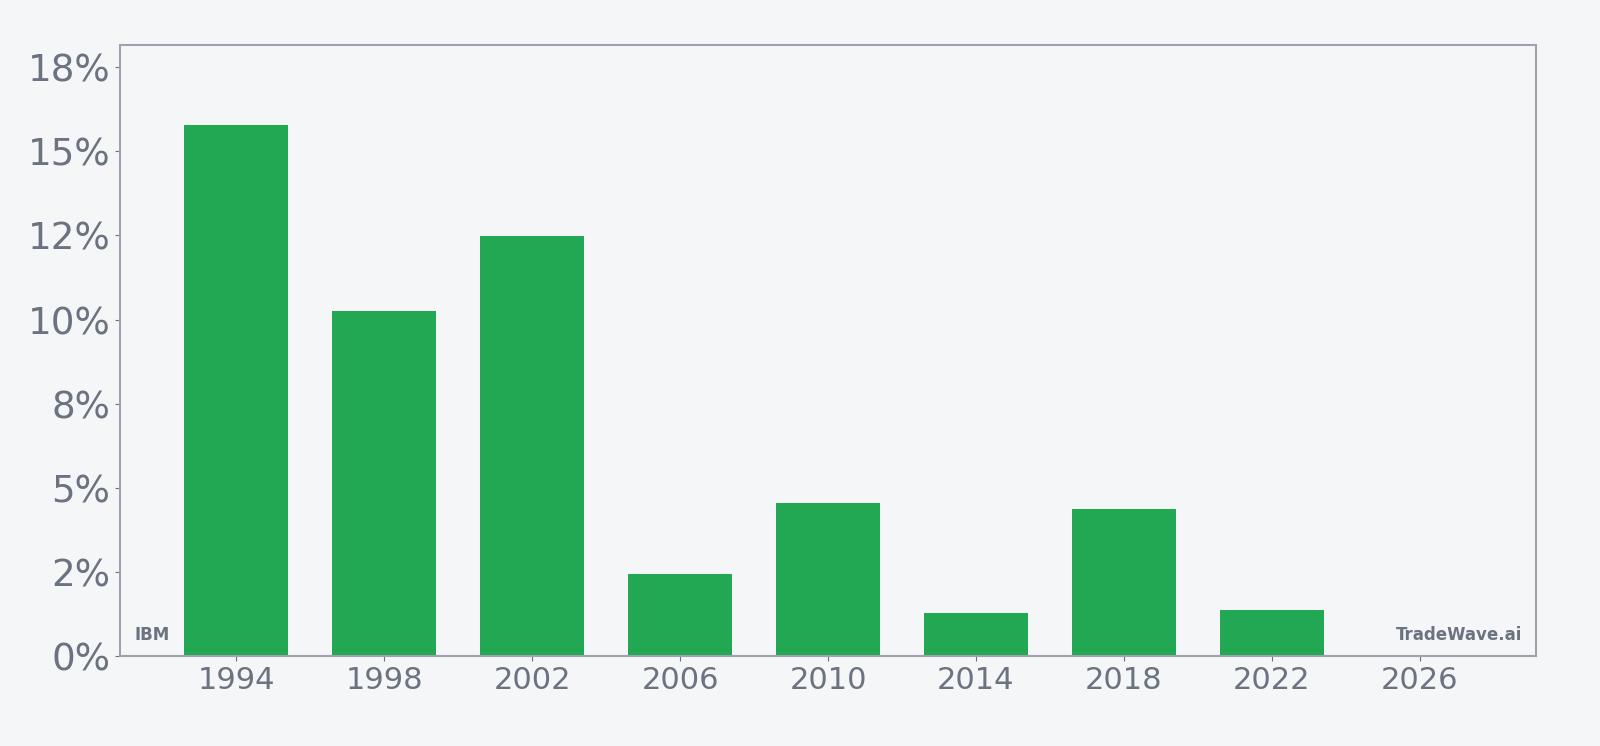
Across the eight historical windows, the strongest year was 1994, when IBM gained 15.79% in the 44-day stretch, with a best intraperiod run-up of 17.13% and a worst drawdown of 3.11% from the entry point. The softest outcome was 2014, which still posted a 1.3% net gain, with a maximum favorable move of 4.45% and a modest 1.79% adverse excursion. Even in 2002 and 2022, when the broader market backdrop was choppy, IBM finished this window higher, though those years saw deeper intraperiod drawdowns of 10.61% and 9.08% respectively before recovering.
Put together, the per-year table shows a long-biased IBM trading window that has been consistently positive on a close-to-close basis but far from smooth inside the range. Maximum favorable excursions have often run ahead of the final net result, which means traders who managed risk actively inside the window sometimes captured more than the average 6.58% gain, while those who sat through the full period had to tolerate meaningful swings along the way.
Yearly net and peak moves highlight upside persistence amid typical drawdowns.
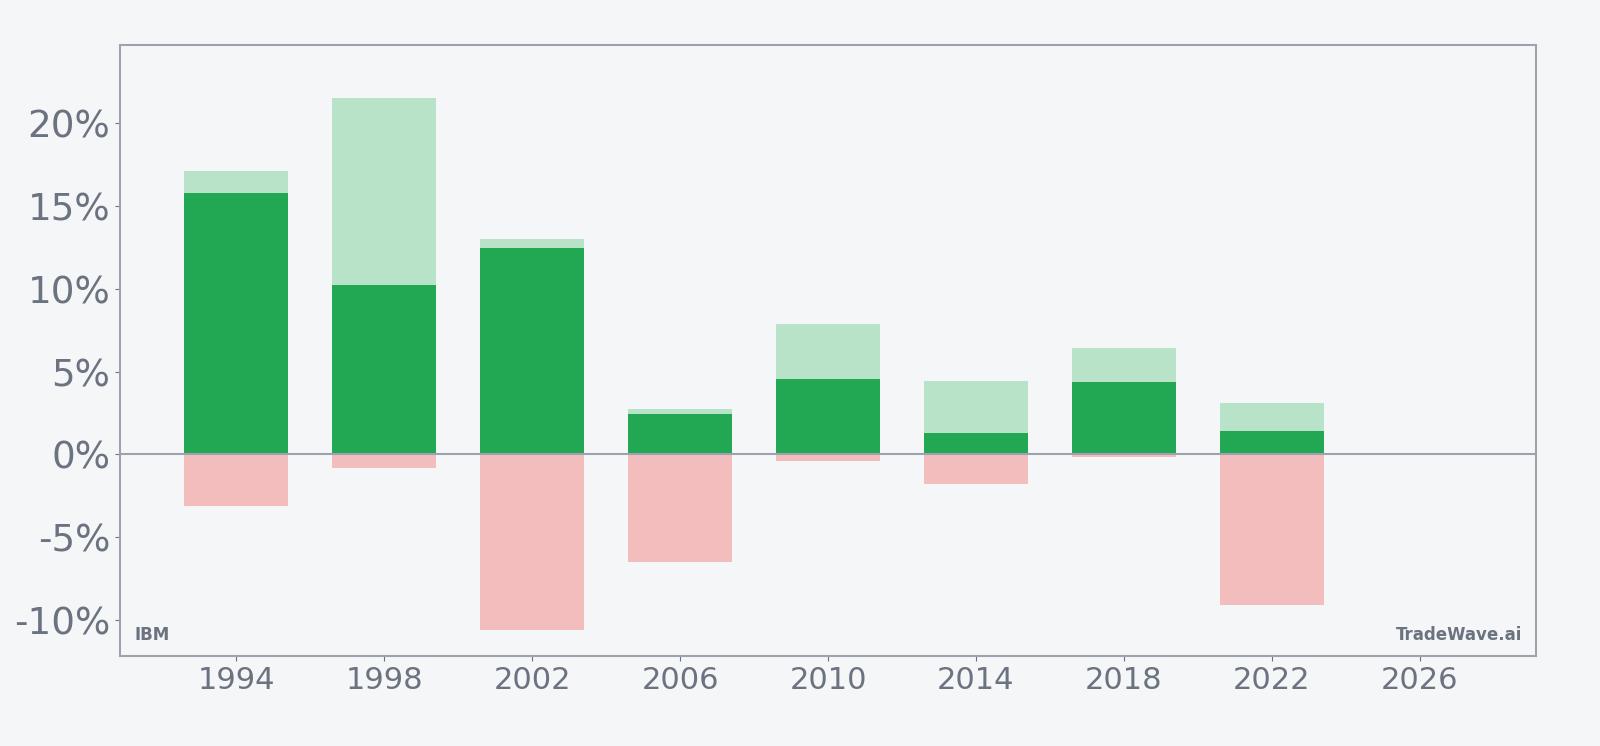
The combined net, maximum favorable move and maximum adverse move bars underline that this IBM seasonal window has offered both opportunity and risk. In the best years, the maximum favorable move has pushed into double digits while the worst drawdowns stayed mid-single digits, a profile that suits a long bias. In tougher macro years, the maximum adverse move has widened toward 10% even though the stock still finished the window in the green, a reminder that timing and risk limits matter as much as the historical edge.
History does not guarantee future results; adverse excursions (MAE) can be large even in winning windows.
Why does IBM (IBM) follow this seasonal pattern?
One likely driver is the clustering of IBM’s earnings and guidance updates around midyear, which can reset expectations for enterprise software, hybrid cloud and AI spending. Analysts have also pointed to institutional portfolio rebalancing and sector rotation in midterm election years, as investors adjust to shifting policy signals on government tech, quantum and AI budgets.[3] The combination of earnings clarity and policy visibility may help explain why this specific midterm-year summer window has repeatedly favored long exposure to IBM, even when the broader tape has been volatile.
What is driving IBM (IBM) today?
IBM closed at $249.10 on Jun 22, down 5.1% on the session after a sharp June rally that had pushed the stock to within striking distance of its recent highs, and it now sits about 25.1% below its 52-week peak of $332.46. The pullback follows a Q1 2026 earnings beat in April, when IBM delivered adjusted EPS of $1.91 on $15.9 billion in revenue but kept its full-year outlook unchanged, a stance that some investors read as cautious given the AI and hybrid-cloud narrative.[3] On Jun 1, a resurfaced video of former President Trump coincided with a 15% intraday surge in IBM shares and a spike in options volume, an idiosyncratic move that highlighted how sentiment and positioning can overpower fundamentals in the short term.[9] That same day, Business Insider reported that Barclays had reiterated a bullish stance on IBM, citing quantum-computing optionality and resilient software demand, and noted heavy call buying with calls outpacing puts by roughly 8 to 1 around the Commerce Department’s $1 billion quantum grant.[10]
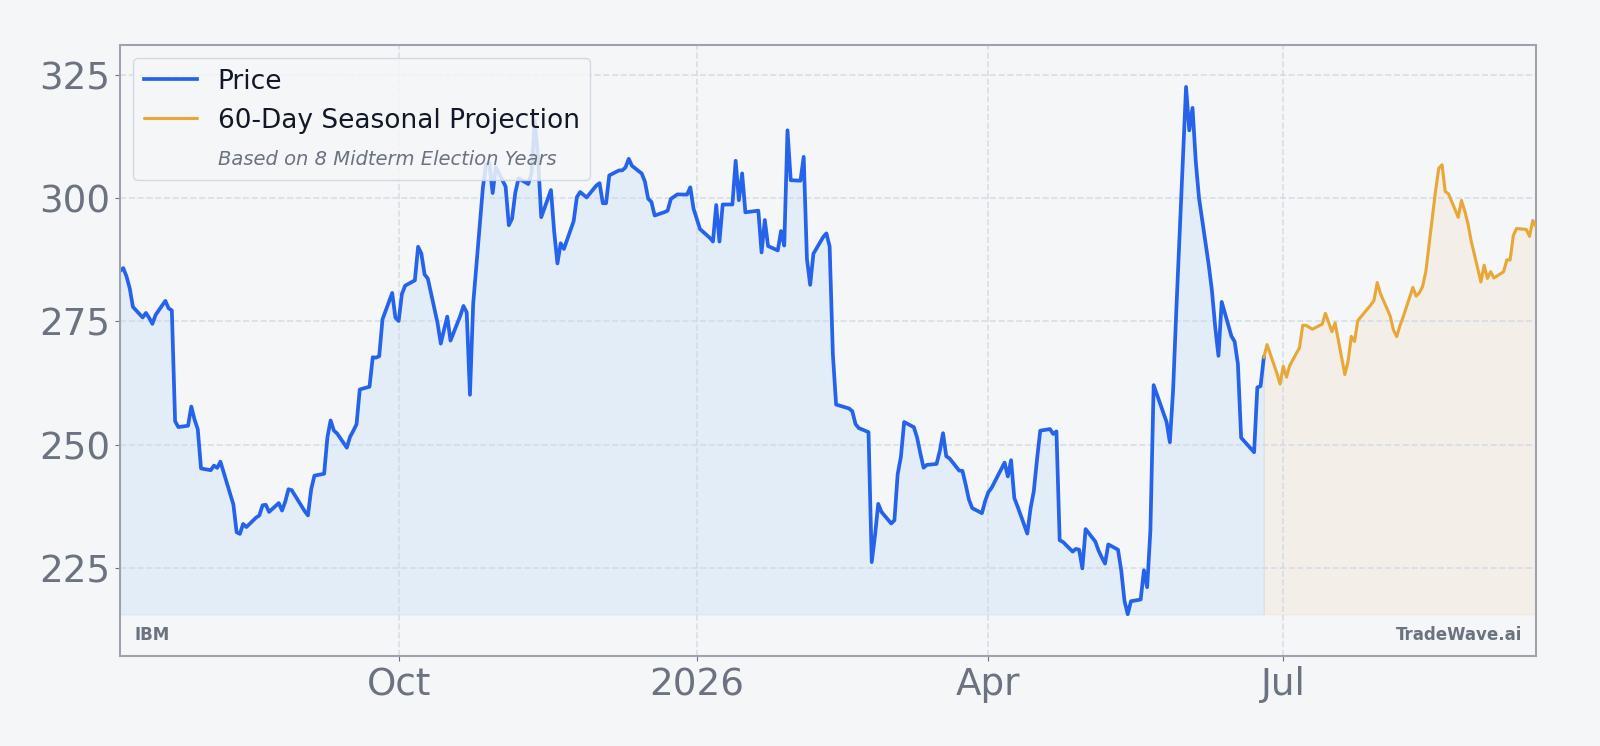
The chart below situates the latest move in its recent multi-month context and overlays the 60-day seasonal projection for the upcoming window.
Fundamentally, IBM is still leaning on AI and hybrid cloud as its growth engines. In Q3 2025 and Q1 2026, management highlighted an AI book of business above $9.5 billion and reiterated guidance for more than 5% constant-currency revenue growth and roughly $14 billion in free cash flow, even as some analysts flagged softer software metrics beneath the headline beats.[3] Government support has added another leg to the story: the Commerce Department’s planned $1 billion quantum-computing grant positions IBM as a key beneficiary of public investment in advanced computing, a theme that has fed into the stock’s “defensive tech” narrative alongside Red Hat and mainframe strength.[10]
At the same time, the stock’s path has been anything but smooth. In 2025, MarketWatch and CNBC both chronicled episodes where IBM beat earnings expectations yet sold off as investors focused on the quality of software growth and the durability of mainframe cycles, underscoring how quickly sentiment can swing around this name.[1][6] The recent options surge and 15% one-day jump in June show that IBM can still behave like a momentum trade when catalysts line up, which is why the upcoming seasonal window, with its history of strong but volatile gains, is drawing fresh attention.[9][10]
What should traders watch in IBM (IBM) during this window?
For the 44-day stretch starting Jul 5, the key watchpoints are how IBM trades around any macro or policy headlines, whether the stock respects recent support levels near the 50-day moving average around $249, and how intraday swings compare with the historical pattern of sizable but ultimately contained drawdowns. If the stock begins to track the historical IBM seasonal trend, traders would expect early choppiness followed by a grind higher into the back half of the window, though the path can vary year to year.
The options market will be just as important as the tape. The June spike in call buying and contracts traded around the quantum grant and Trump video showed how quickly positioning can build in IBM when a narrative catches fire.[9][10] If call volume and open interest continue to climb into July, that would signal that speculators are leaning into the historical seasonal edge, which could amplify both rallies and intraperiod drawdowns. A fade in options activity, by contrast, would suggest that the recent burst of enthusiasm was a one-off and that the seasonal window may play out with less leverage behind it.
Macro and policy calendars also matter in a midterm election year. Any fresh signals on federal tech spending, AI regulation or quantum-computing funding could intersect with this IBM trading window, especially given the company’s role as a beneficiary of government support.[10] Add it up: a historically strong IBM seasonal window, a stock that has just reset lower after a volatile spike, and an options market that has shown it can flip from quiet to frenzied in a single session. How IBM behaves inside this 44-day stretch will tell traders whether the midterm-year pattern is still intact or finally due for a break.
Sources
- CNBC, "IBM is trying to rebound after results disappointed initially. What analysts and investors are saying" (Oct 23, 2025).
- MarketWatch, "IBM’s stock is sliding. Here’s why these analysts see an opportunity to buy." (Jul 24, 2025).
- Yahoo Finance (GuruFocus), "IBM Stock Tumbles. Solid Quarter Can't Offset Tepid Forecast" (Apr 23, 2026).
- CNBC, "IBM tops third-quarter estimates and lifts guidance, but stock drops" (Oct 22, 2025).
- Forbes, "What’s Happening With IBM Stock?" (Oct 07, 2025).
- MarketWatch, "Why is IBM’s stock down after an earnings beat? Here’s one quibble." (Jul 23, 2025).
- Barron's, "IBM Earnings Beat Estimates. The Stock Is Still Falling." (Apr 22, 2026).
- Yahoo Finance, "IBM shares surge 15% after Trump video resurfaces" (Jun 01, 2026).
- Business Insider, "IBM stock shoots higher after bullish Barclays forecast hits back at SaaSpocalypse fears" (Jun 01, 2026).
- Forbes, "IBM Stock Isn't Dying. It's On Sale" (Feb 24, 2026).
About this seasonal analysis
Seasonal pattern data is sourced from TradeWave.ai, which analyzes historical price behavior across annual calendar windows going back up to 30 years. Read the full data methodology or the book The 100-Year Pattern by Afshin Moshrefi (2026 edition). Past performance of seasonal patterns does not guarantee future results. This article is for informational purposes only and does not constitute investment advice.