AI Data Center Boom and Trexon Deal Put Amphenol (APH) Near a Historic Midterm Rally Run
Amphenol is trading just below its 52-week high as it approaches a long midterm-election seasonal window that has never been negative in this sample, putting extra focus on AI demand and deal execution.

What is the seasonal pattern for Amphenol (APH)?
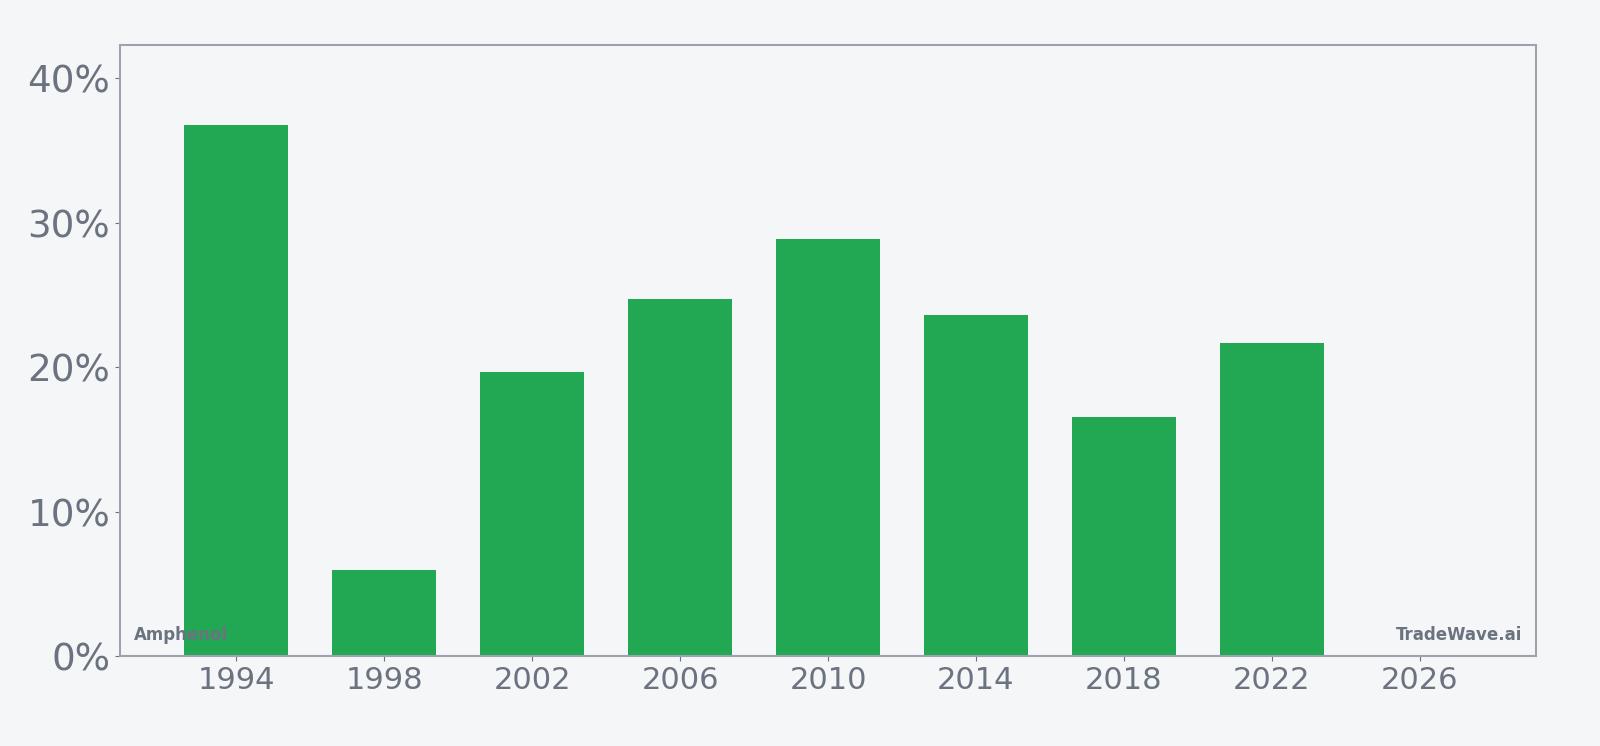
Amphenol has risen in 8 of 8 midterm-election-year windows starting in mid-July, with an average gain of 22.24% in winning years.
- 8 for 8 in this window, averaging 22.24% gains in winning years across the last eight midterm election cycles.
- The upcoming 273-day Amphenol trading window begins Jul 11, 2026 and runs deep into the following pre-election year.
- Percent Profitable is 100%, with 8 winners and 0 losers in this APH seasonal trend sample.
- Average profit of 22.24% compares with a median outcome of 22.67%, showing a tight cluster of strong years rather than one outlier.
- Historical MFE/MAE readings show sizable peak run-ups but also intraperiod drawdowns that have reached as much as about 28% in weaker paths.
- The pattern aligns with the midterm-to-pre-election phase, when policy visibility improves and growth-sensitive tech hardware often sees renewed flows.
According to historical data from TradeWave.ai, Amphenol’s behavior around midterm election years has followed a distinct calendar rhythm that differs from its average year-round performance.
How has Amphenol (APH) traded in this midterm-year seasonal window?
Amphenol has rallied in every one of the last eight midterm election years during the 273-day window that starts on Jul 11, posting an average gain of 22.24%. Today the stock closed at 163.96, up 1.8% on the day and about 1.4% below its 52-week high of 166.38.[1]
The presidential election cycle matters here because this window straddles the back half of the midterm election year and the early part of the year before the presidential election, a stretch that has often coincided with clearer policy signals and renewed risk appetite in growth sectors. For a communications and defense interconnect supplier like Amphenol, that has historically lined up with stronger capital spending on data centers, broadband and defense programs.[3]
Across the eight midterm-year samples, the APH seasonal trend has been consistently positive rather than driven by a single blockbuster year. The strongest run came in 1994 with a 36.78% net gain, while the softest still delivered 5.96% in 1998, underscoring how even the weakest iteration finished higher over this long trading window.
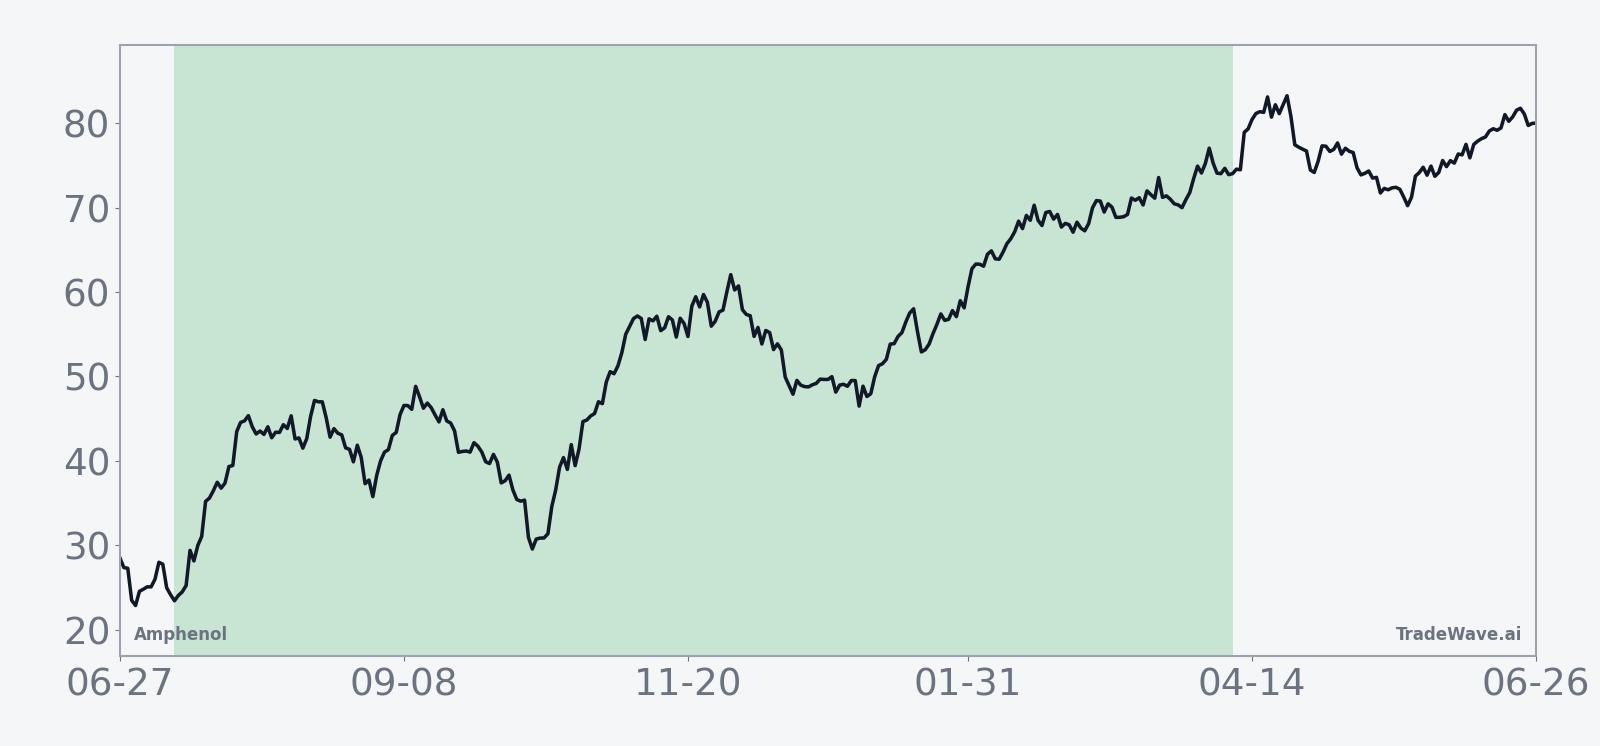
The historical seasonal average shows gains building steadily rather than in a single burst, with the curve grinding higher through much of the window. That profile fits a long trade direction where pullbacks have tended to be pauses in an uptrend instead of lasting reversals.
The bar chart with MFE and MAE adds detail on how far APH has typically run and how deep the worst drawdowns have been inside the window.
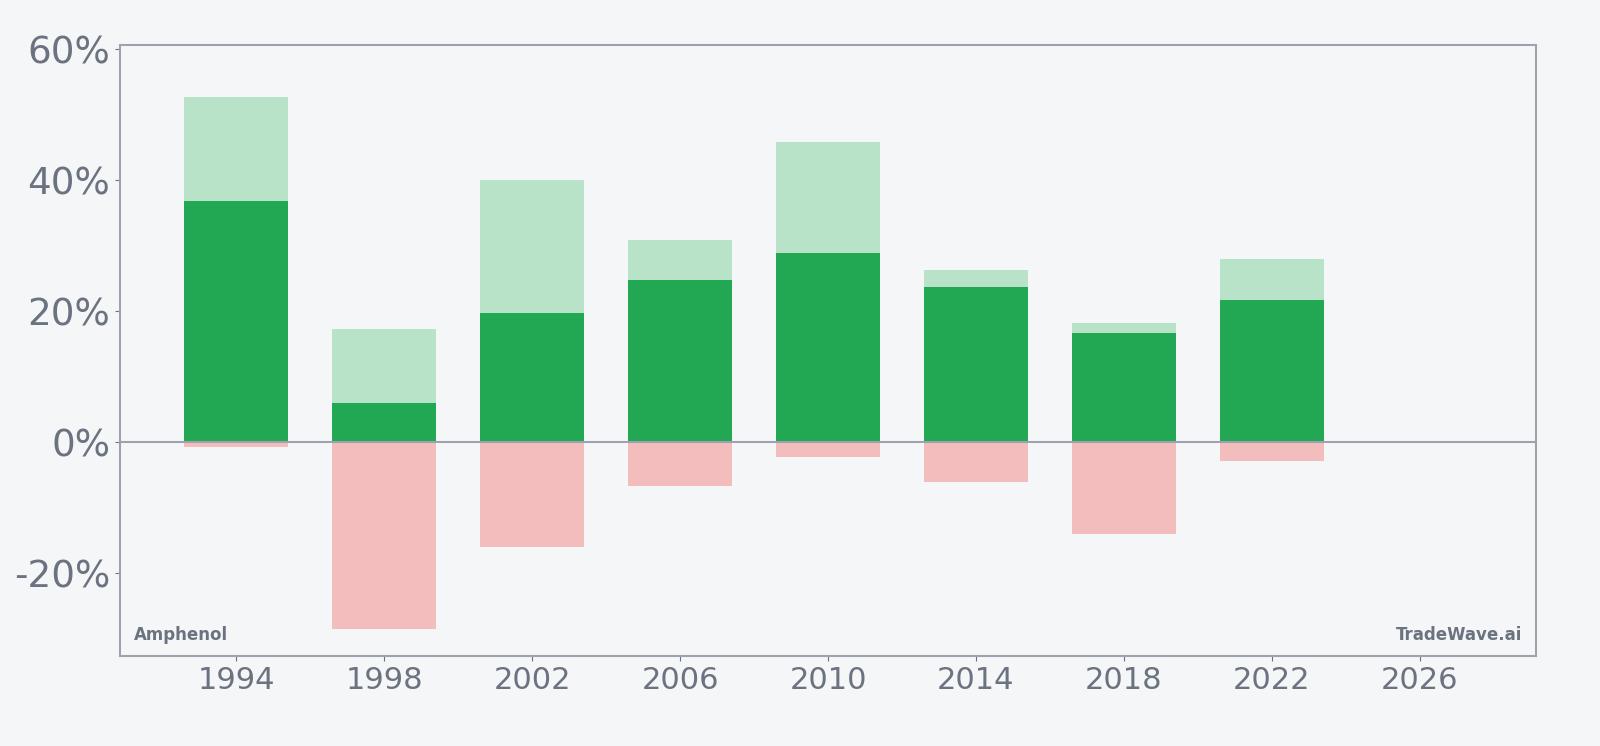
Maximum favorable excursions have reached between roughly 17% and 53% in individual years, showing that when APH has trended higher in this window it has often overshot the final close by a wide margin. At the same time, maximum adverse excursions have ranged from shallow pullbacks of around 0.7% to a sharp 28.47% drawdown in 1998, a reminder that even a 100% win-rate pattern can involve uncomfortable volatility along the way.
History does not guarantee future results; adverse excursions can be large even in winning windows, and seasonal tendencies can break when fundamentals or policy regimes change.
Why does Amphenol (APH) follow this seasonal pattern?
One likely driver is the clustering of corporate and government spending decisions in the back half of the midterm election year and into the year before the presidential election, when policy visibility improves and budgets for data centers, broadband and defense programs are locked in.[3] Analysts have also pointed to AI data center demand and rising content per rack as multi-year tailwinds for Amphenol, which can translate into stronger orders and investor enthusiasm during this phase of the cycle.[1] The pattern may also reflect institutional portfolio repositioning toward quality hardware names as macro and policy uncertainty from the early midterm months fades.
What is driving Amphenol (APH) today?
Amphenol shares finished Monday at 163.96, up 1.8% on the session and about 1.4% below their 52-week high of 166.38, after a powerful 33.25% one-month run that has pushed the stock well above its 50-day moving average of 142.66 on heavy volume of 12.8 million shares versus a 20-day average of 10.9 million.[1] The move extends a broader rally that has been fueled by expectations for strong AI-related revenue growth, with higher connectivity content per rack in data centers seen as a key driver for mid-teens organic growth in the 2026 to 2028 period.[1]
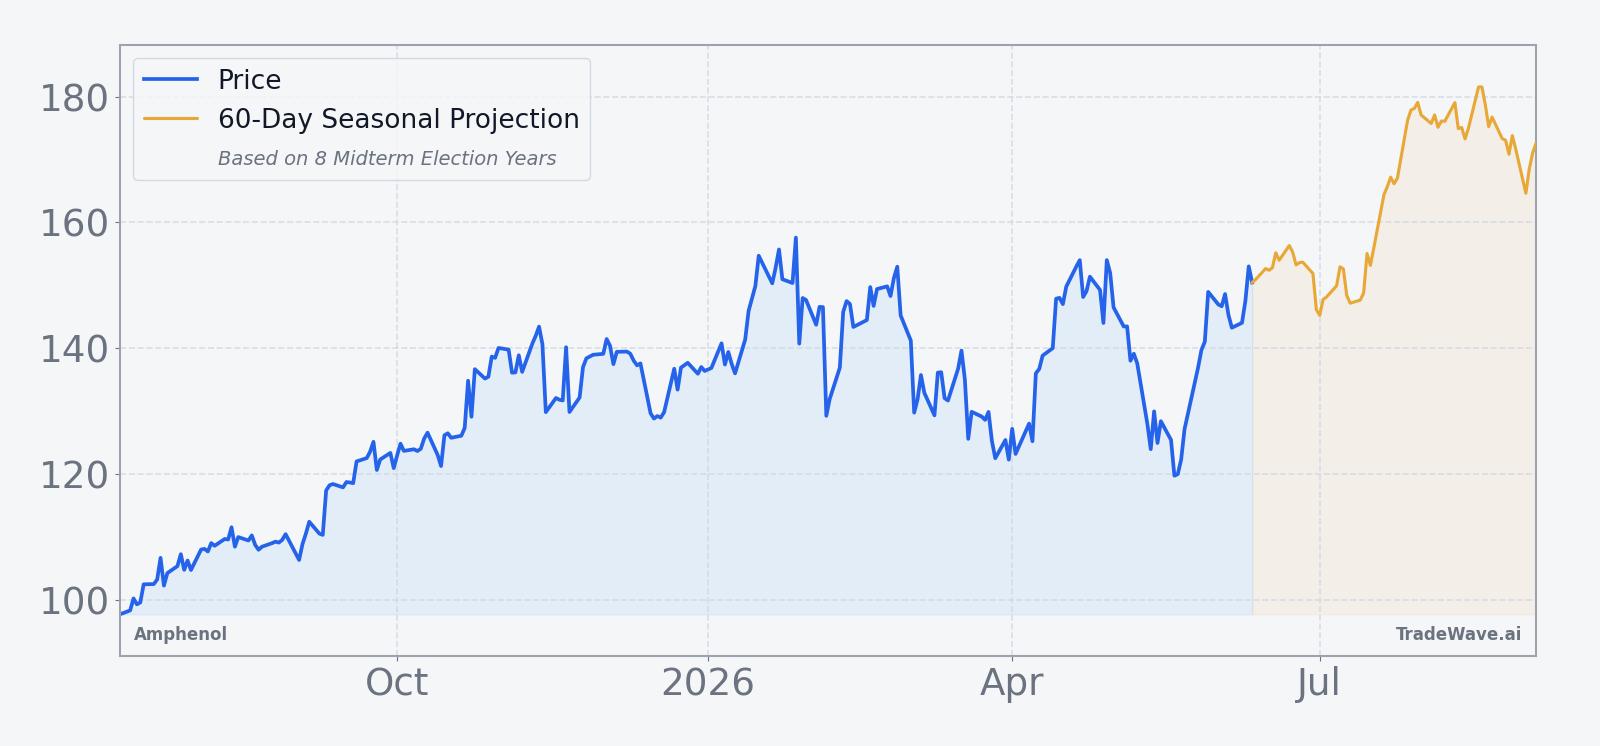
The chart below situates the latest move in its recent multi-month context alongside a 60-day seasonal projection.
Beyond AI data centers, Amphenol’s communications and defense interconnect businesses have been expanding through acquisitions, including deals announced in 2025 to buy a CommScope broadband connectivity unit and Trexon, a defense cable assemblies provider, which would deepen its exposure to broadband and defense spending if completed.[2][3] In August 2025, Bank of America upgraded the stock to Buy and lifted its price target, citing those M&A tailwinds and AI-driven growth as reasons estimates could move higher over time.[1] While those calls came in a different price regime, they frame why investors have been willing to pay up for the name as it heads into a historically strong APH seasonal trend.
What should traders watch as this Amphenol seasonal window approaches?
First, the calendar: the 273-day Amphenol trading window tied to midterm election years begins on Jul 11, 2026, and runs well into the year before the presidential election, a phase that has historically been friendly to risk assets. Second, price behavior around the current 52-week high zone near 166.38 will matter; a sustained consolidation above the 50-day moving average with normalizing volume would be more consistent with prior strong seasonal runs than a sharp reversal back through that trend line.[1]
Third, macro and policy catalysts tied to AI infrastructure, broadband funding and defense budgets will be key tells for whether the historical seasonality repeats or fades.[1][3] Strong follow-through in orders or commentary around data center connectivity and defense interconnect demand would rhyme with the prior midterm-year windows that delivered double-digit gains, while any sign of delayed spending or regulatory pushback could break the pattern. Finally, traders should monitor how APH trades on pullbacks inside the window: in past cycles, even winning years saw sizable drawdowns, so whether buyers step in quickly on dips will be an important real-time test of this APH seasonal trend.
Sources
- [1] Bank of America upgrade and AI growth commentary via LSEG / CNBC summary (Aug 15, 2025).
- [2] Seeking Alpha: “Amphenol set to acquire CommScope unit in $10.5B deal - report” (Aug 4, 2025).
- [3] The Wall Street Journal: “Amphenol to Buy Trexon From Audax Private Equity for $1 Billion” (Aug 18, 2025).
About this seasonal analysis
Seasonal pattern data is sourced from TradeWave.ai, which analyzes historical price behavior across annual calendar windows going back up to 30 years. Read the full data methodology or the book The 100-Year Pattern by Afshin Moshrefi (2026 edition). Past performance of seasonal patterns does not guarantee future results. This article is for informational purposes only and does not constitute investment advice.