Amgen (AMGN) Has Rallied in 10 of 10 Midterm July Windows, Averaging 7.02% Gains
Amgen is heading toward a historically strong 22-day July trading window just as shares hover near record highs and investors weigh obesity-drug hopes against pipeline and policy risk.

What is the seasonal pattern for Amgen (AMGN)?
Amgen has risen in 10 of 10 midterm-year July windows during this 22-day stretch, with an average gain of 7.02% in winning years.
- 10 for 10 in this window, with Amgen averaging 7.02% gains in each winning year across the last 10 midterm election cycles.
- The upcoming 22-trading-day window begins Jul 5, 2026 and has historically been a bullish AMGN seasonal pattern in midterm election years.
- Percent Profitable is 100%, with 10 winners and 0 losers across the lookback sample.
- Average winner gain of 7.02% compares with a median profit of 5.39%, pointing to a solid but not extreme upside skew.
- Historical best intraperiod rallies have reached up to 17.96% from entry, while the worst drawdowns have stretched to as much as 19.70% before recovering.
- Cumulative return across all 10 windows totals 95%, giving this AMGN seasonal trend real weight for traders watching the midterm-year summer tape.
According to historical data from TradeWave.ai, this midterm-year July stretch has behaved very differently from an average month for Amgen, and the next iteration is just days away.
How has Amgen (AMGN) traded in this midterm-year July window?
Amgen has risen in 10 of the last 10 midterm election years during the 22 trading days starting Jul 5, averaging 7.02% gains and delivering a 95% cumulative return across those windows. Today the stock closed at 344.72, up 2.1% on the session and sitting about 10.6% below its 52-week high of 385.45, leaving room above if the historical pattern repeats.
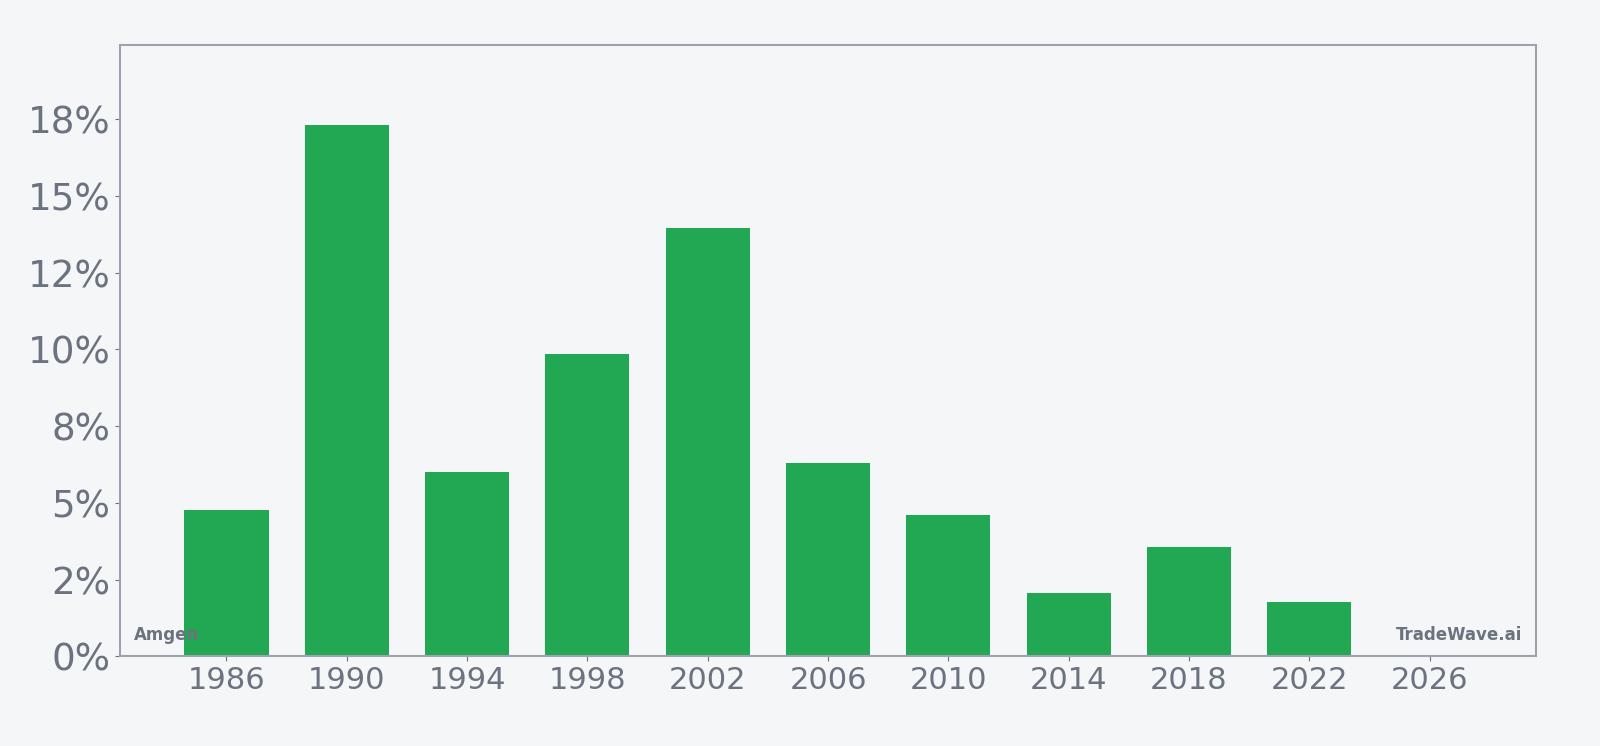
Because this pattern is grouped by the presidential election cycle, it only looks at midterm election years, which often feature shifting policy expectations and sector rotation ahead of the stronger pre-election year. For a large-cap biotech like Amgen, that has historically meant this early-July slice behaves more like a positioning window than a quiet summer lull.
A second view layers in the typical best and worst intraperiod swings alongside those net outcomes.
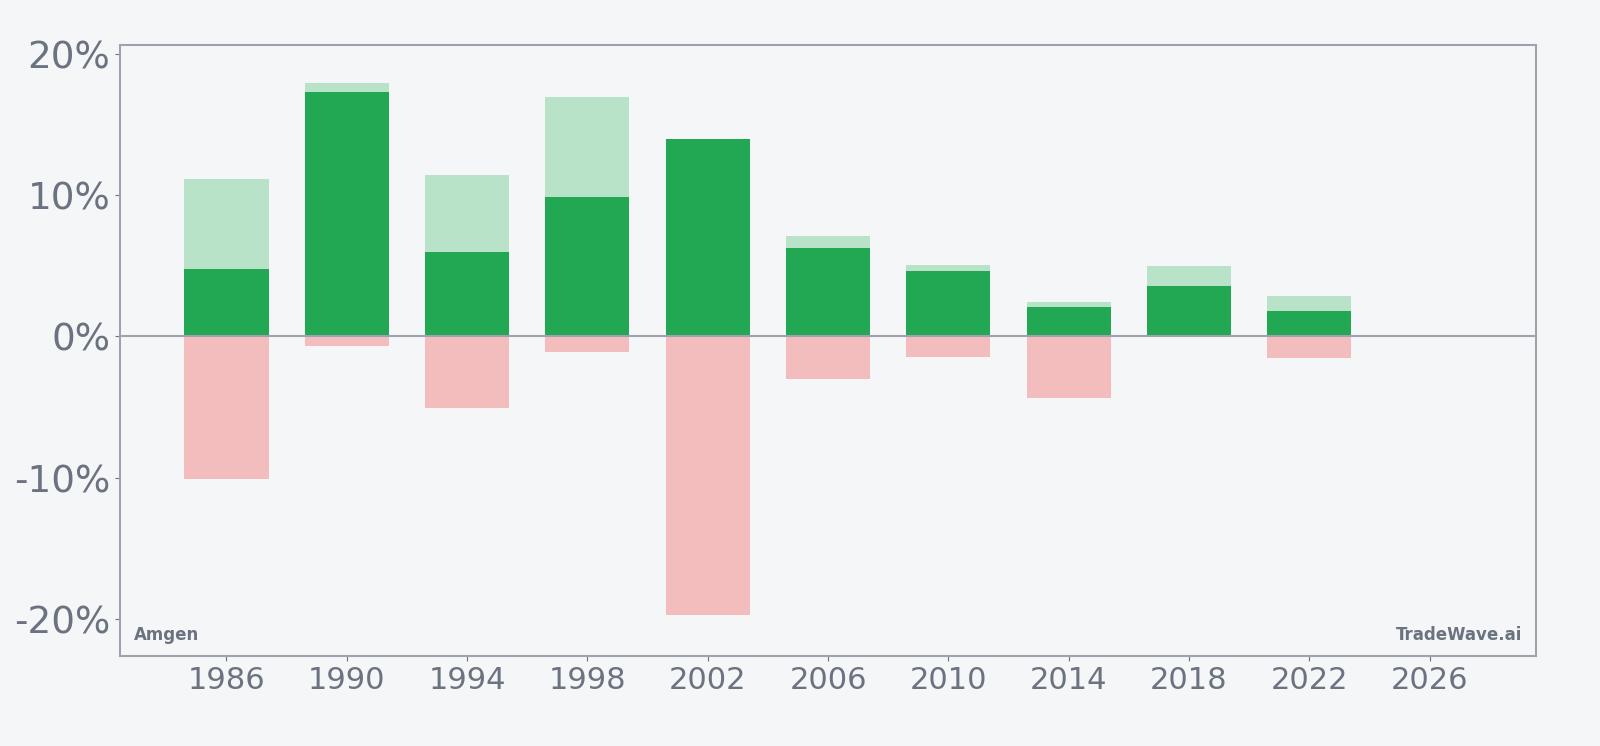
The per-year table shows why this AMGN seasonal trend gets attention. The strongest year in the sample, 1990, delivered a 17.32% net gain with a maximum favorable move of 17.96% and only a 0.64% worst drawdown from entry. At the other end of the spectrum, 2002 still finished up 13.95% but only after a 19.70% intraperiod slide, underscoring that even winning years can involve sharp downside before the rebound.
Across all 10 midterm-year windows, the median profit of 5.39% sits below the 7.02% average, which hints at a few outsized winners pulling the mean higher. The TradeWave Ratio of 1.6 suggests that, on average, price has tended to travel meaningfully in the long direction during the window, not just grind sideways. The Sharpe ratio of 1.32, based on end-of-window outcomes, points to a historically favorable risk-adjusted profile for long exposure in this specific slice of the calendar.
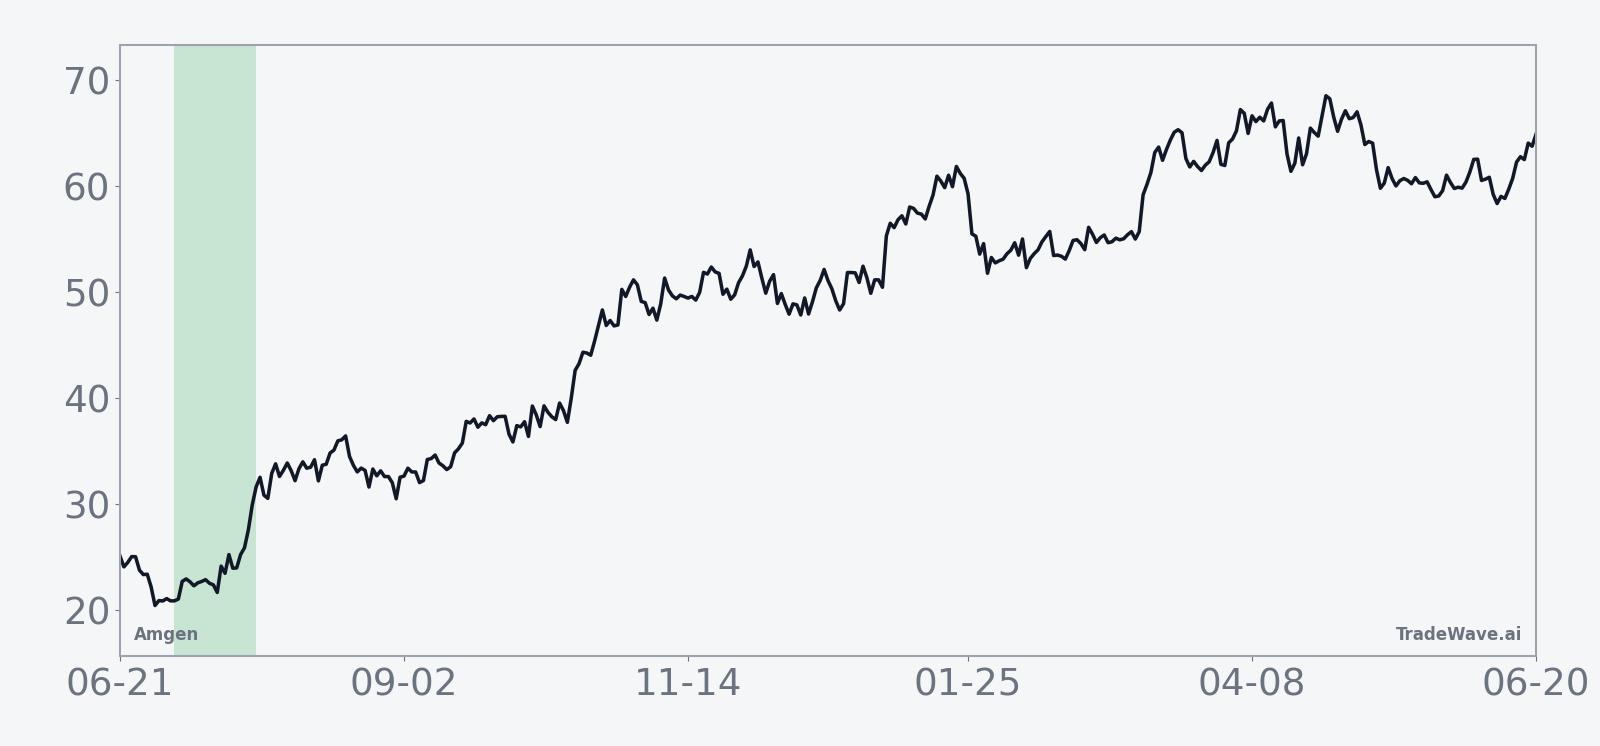
The historical seasonal trend chart tilts higher through most of the 22 days, with gains tending to build rather than spike on a single session. That pattern fits a story of steady accumulation rather than one-off news shocks, which is consistent with institutional portfolio managers adjusting healthcare and biotech weights as the midterm year moves toward the stronger pre-election phase.
The combined net, maximum favorable move and maximum adverse move bars highlight the trade-off. In several years, Amgen’s best intraperiod rallies in this window have pushed into double digits, while the worst drawdowns have often stayed in the mid-single to low-double-digit range. Large MAE in 2002 shows that downside can be abrupt even when the final result is positive, a reminder that this is a high-energy window rather than a free ride.
History does not guarantee future results; adverse excursions can be large even in winning windows, and traders should treat this seasonal pattern as context, not a forecast.
Why does Amgen (AMGN) follow this seasonal pattern?
One likely driver is the way the presidential election cycle shapes risk appetite, with midterm years often seeing investors rebalance into defensive and healthcare names ahead of the historically stronger pre-election year. For Amgen specifically, this July stretch may also line up with portfolio repositioning after first-half earnings and midyear index rebalances, which can boost flows into large-cap biopharma. Sector rotation within healthcare, as managers adjust exposure to obesity, oncology and biosimilar themes, may further amplify this recurring mid-summer bid.
What is driving Amgen (AMGN) today?
Amgen shares climbed 2.1% Tuesday to 344.72, extending a one-month gain of 2.16% and leaving the stock about 10.6% below its 52-week high of 385.45 on 20-day average volume of roughly 3.1 million shares. The stock is trading modestly above its 50-day moving average of 337.50, a sign that buyers have been willing to support dips even as the broader biotech sector juggles drug-pricing headlines and obesity-drug competition.
In February 2026, Amgen reported fourth-quarter 2025 revenue of $9.9 billion and adjusted earnings of $5.29 per share, both ahead of analyst estimates, and raised its 2026 guidance to $37.0 billion to $38.4 billion in revenue and adjusted EPS of $21.60 to $23.00.[2] Management highlighted continued confidence in its pipeline, including obesity candidate MariTide, which sits at the center of a weight-loss market analysts expect could reach about $150 billion in the coming years.[1] That combination of earnings momentum and exposure to a fast-growing therapeutic category has helped underpin Amgen’s premium valuation even as it faces biosimilar pressure on legacy products such as Prolia.[1]
In August 2025, Amgen’s second-quarter results also topped expectations, with revenue of $9.18 billion and adjusted EPS of $6.02, helped by product sales growth and a lower tax rate.[1] Around the same time, both Reuters and The Wall Street Journal noted that investors were increasingly focused on how MariTide data expected in late 2025 could reshape Amgen’s long-term growth profile.[1][3] By early 2026, Forbes framed the stock as rewarding long-term holders through a mix of revenue growth, margins and capital returns, reinforcing the idea that Amgen has become a core healthcare holding rather than a tactical trade.[4]
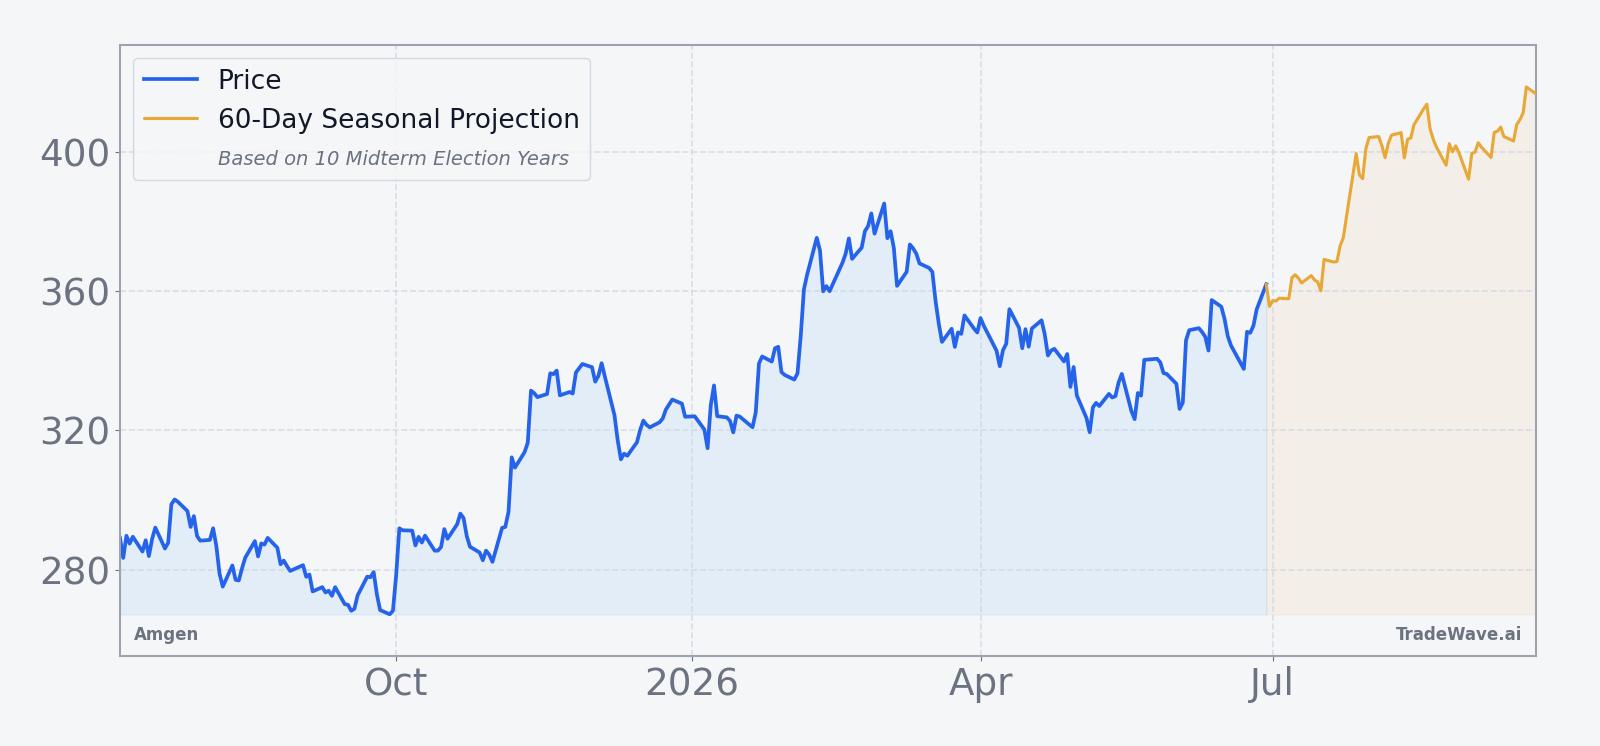
The chart below situates the latest move in its recent multi-month context, alongside a 60-day seasonal projection path.
What should traders watch as this Amgen (AMGN) window approaches?
First, the calendar: the 22-day midterm-year July window begins Jul 5, so price action in the final week of June will shape how stretched or under-owned Amgen looks heading into a historically bullish stretch. A push back toward the 52-week high near 385 with contained intraday volatility would echo prior cycles where the stock climbed steadily through the window, while a sharp pullback ahead of Jul 5 would raise the odds of a choppier, 2002-style path with deeper drawdowns before any recovery.
Second, watch how the stock trades around upcoming fundamental updates, especially any commentary on MariTide timelines or obesity-drug competition in management appearances and conferences.[1][2] Stronger conviction on the obesity franchise could reinforce the historical pattern of mid-summer accumulation, while negative surprises on trial data or pricing policy could overwhelm the usual seasonal tailwind. Volume relative to the 20-day average near 3.1 million shares will be a useful tell on whether institutional money is leaning into or fading the pattern.
Finally, monitor how Amgen trades versus the broader healthcare and biotech complex as the midterm year transitions toward the pre-election year. If AMGN continues to outperform sector peers into and through the July window, it would fit the historical script of this stock acting as a defensive growth anchor in a policy-heavy part of the cycle. If instead it lags while the group rallies, that would be an early sign that this time may diverge from the 10-for-10 record, reminding traders that even the cleanest seasonal windows are tendencies, not guarantees.
Sources
- [1] Reuters, "Amgen profit rises, weight-loss data expected in 4th quarter," Aug 5, 2025.
- [2] Reuters, "Amgen Q4 results beat Street estimates, company says patients need weight-loss options," Feb 3, 2026.
- [3] The Wall Street Journal, "Amgen Posts Higher Profit, Revenue On Sales Growth Among Products," Aug 5, 2025.
- [4] Forbes, "Why Amgen Stock Is Paying Off Big For Long-Term Investors," Feb 4, 2026.
About this seasonal analysis
Seasonal pattern data is sourced from TradeWave.ai, which analyzes historical price behavior across annual calendar windows going back up to 30 years. Read the full data methodology or the book The 100-Year Pattern by Afshin Moshrefi (2026 edition). Past performance of seasonal patterns does not guarantee future results. This article is for informational purposes only and does not constitute investment advice.