DTE Energy (DTE) Enters 51-Day Midterm Window With 100% Win Rate and 62% Cumulative Gains
DTE Energy is heading into a 51-day midterm-year seasonal window with a perfect win record, just as the stock trades near its 52-week high and investors focus on massive AI data center power demand.
What is the seasonal pattern for DTE Energy (DTE)?
DTE Energy has risen in 10 of 10 midterm-year summer windows starting around Jul 2, with an average gain of 5.05% in winning years.
- 10 for 10 in this 51-day midterm-year window, with average winner gains of 5.05% and no losing years.
- Seasonal window runs from Jul 2 for 51 trading days, covering the heart of the midterm-year summer for utilities.
- Percent Profitable is 100%, with 10 winners and 0 losers across the last 10 midterm election years.
- Cumulative return across those windows totals 62%, with a Sharpe ratio of 1.2 for the long setup.
- The TradeWave Ratio of 1.74 signals meaningful intraperiod travel in the trade direction, even when final gains are moderate.
- Individual years have seen adverse moves as deep as about 23% before finishing higher, underscoring real drawdown risk inside an otherwise strong pattern.
According to historical data from TradeWave.ai, this midterm-year summer stretch has behaved very differently from an average month on the calendar for DTE Energy. The next section walks through how that election-cycle pattern has played out and what it means for the upcoming 51-day window.
How has DTE Energy (DTE) traded in past midterm-year summer windows?
DTE Energy has risen in all 10 of the last midterm election years during this 51-day summer window, averaging 5.05% gains for the long side. The upcoming iteration begins on Jul 2 and lands as the stock changes hands around 149.19, about 1.4% below its 52-week high of 151.29.
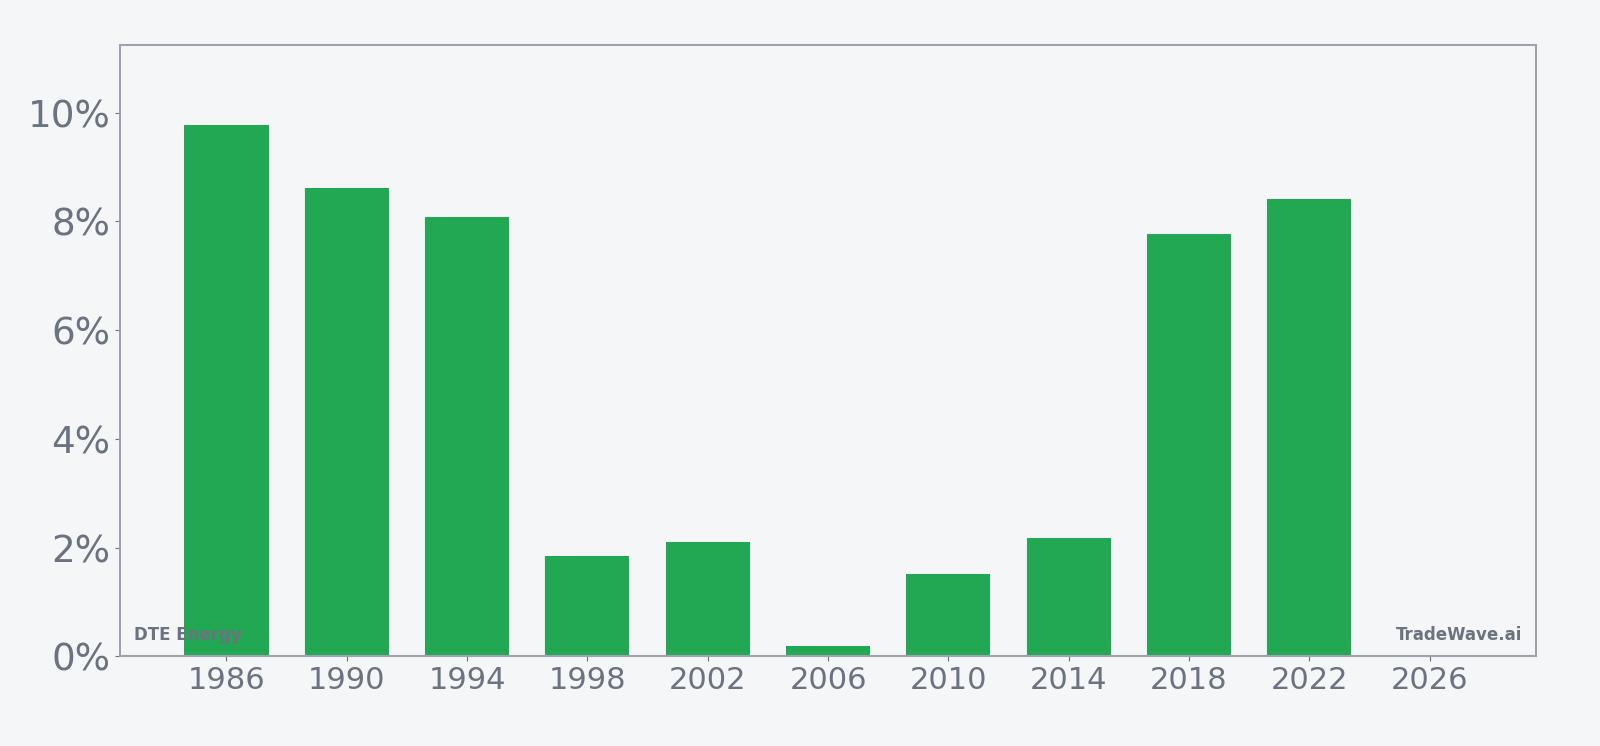
Grouping the data by the presidential election cycle matters here because utilities often feel policy shifts around regulation, infrastructure spending and energy transition most acutely in midterm years, when Washington is debating budgets and oversight rather than running a presidential campaign. This 51-day DTE seasonal trend captures that mid-cycle backdrop, focusing only on the last 10 midterm election years rather than every calendar year.
Across the 10 midterm-year samples, the strongest years have been 1986, 1990, 1994, 2018 and 2022, each posting net gains between about 7.8% and 9.8% over the 51 trading days. The softest outcome was 2006, which still finished slightly positive at 0.2%, underscoring how unusual it has been for this DTE Energy trading window to end in the red.
The intraperiod path has not been smooth. In 2002, for example, DTE’s best point-to-peak move within the window was only about 2.17%, but the worst drawdown from entry reached roughly 23.05% before the stock recovered to finish up 2.1%. That combination of modest final gain and deep interim loss is a reminder that a perfect win record can still hide sharp swings along the way.
Other years show a more classic “grind higher” profile. In 1990, the stock rallied as much as 13.4% at its best point in the window and closed up 8.61%, while the worst pullback from entry was only about 1.43%. Several more recent midterm years, including 2010, 2014 and 2018, also saw maximum favorable moves in the 7.9% to 10.13% range with relatively contained adverse excursions between roughly 0.66% and 5.39%.
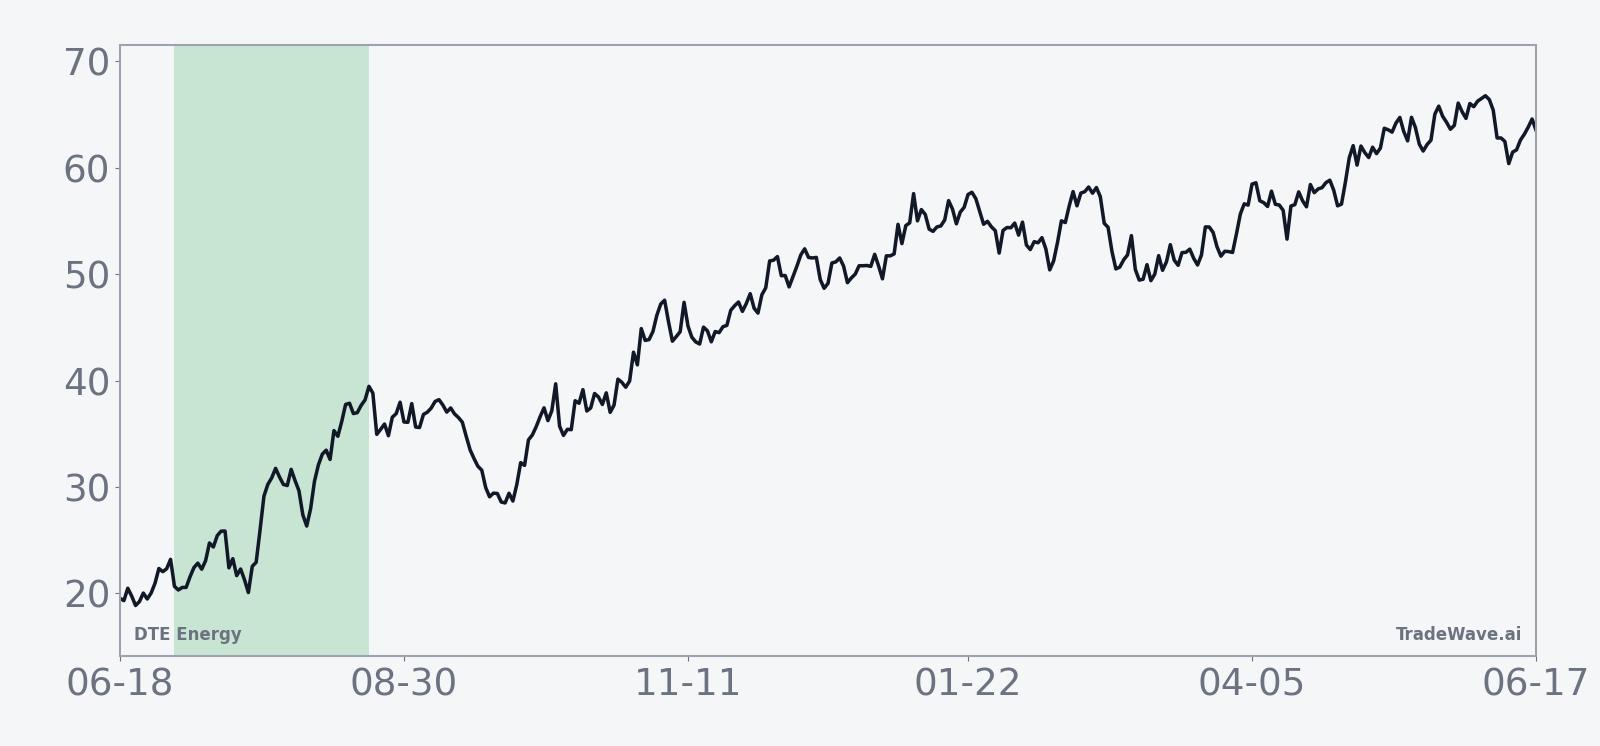
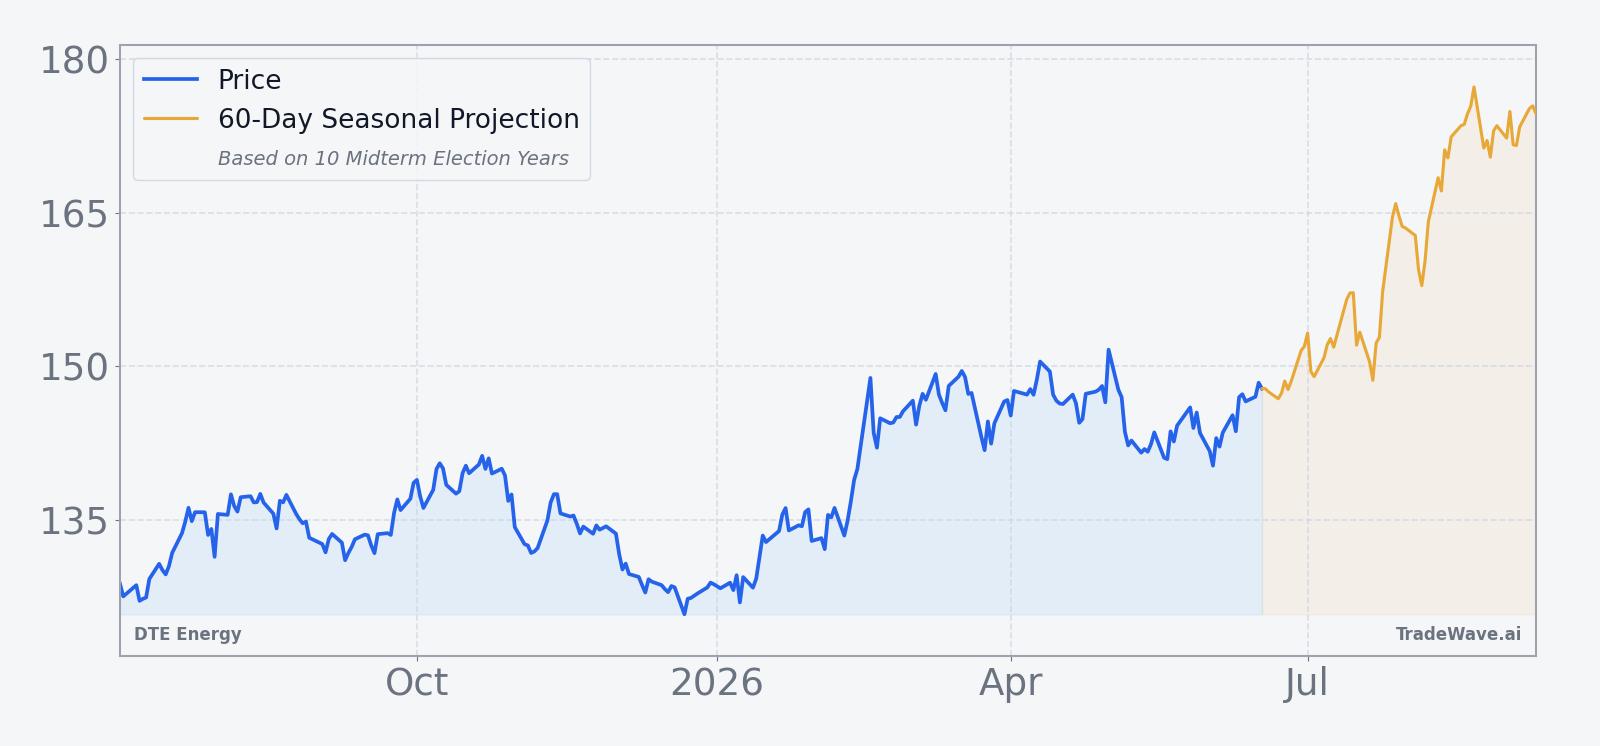
The historical seasonal average curve slopes higher through most of the 51 days, with gains tending to build rather than spike on a single session. That suggests the typical pattern has been a steady drift upward for longs, punctuated by a few sharper swings in the more volatile years.
A closer look at yearly net returns alongside best and worst intraperiod moves shows how upside and drawdown have coexisted in this pattern.
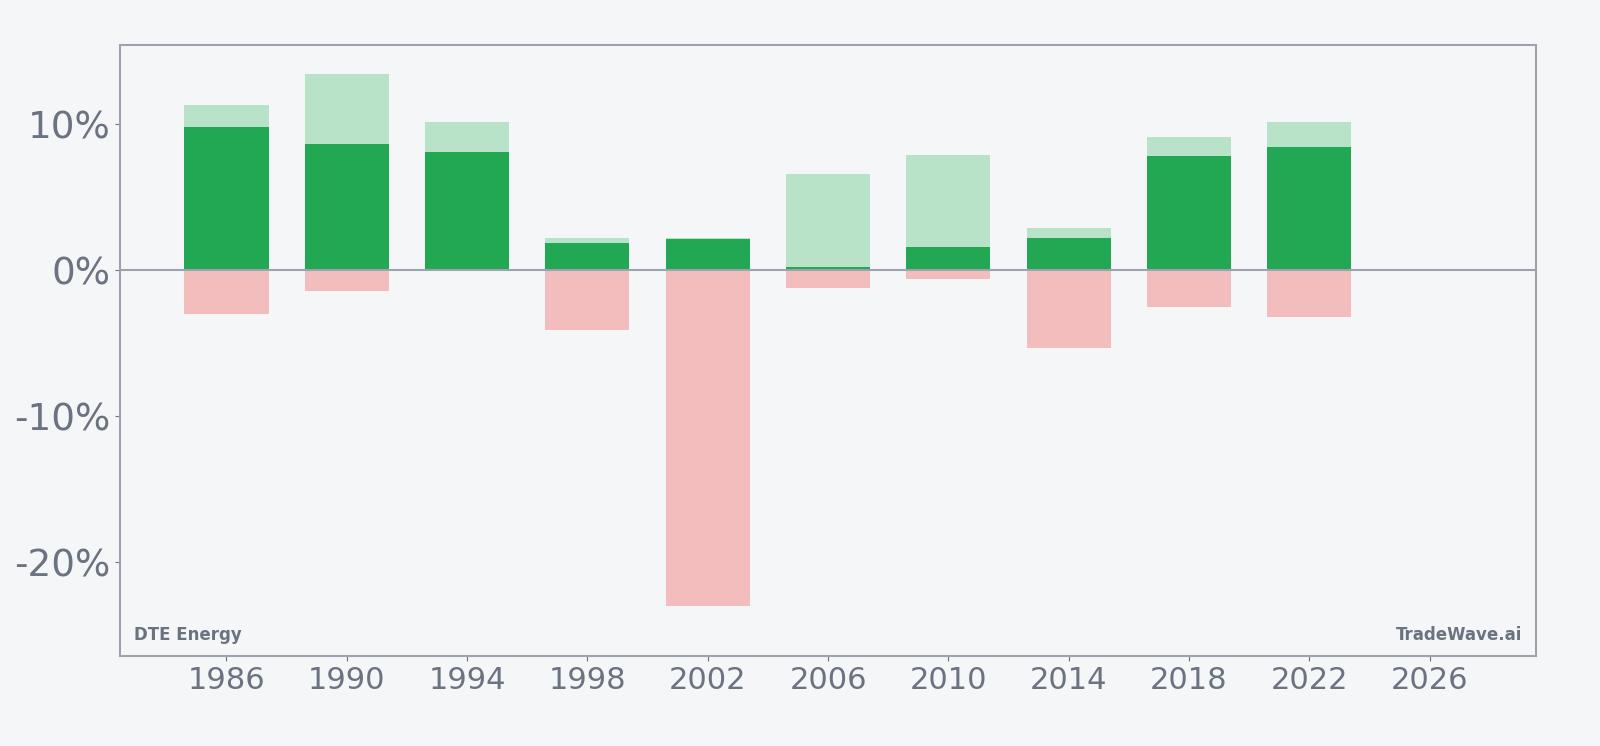
The combined net/MFE/MAE profile shows that while every year finished positive, several windows featured sizable swings in both directions, with large favorable moves often paired with meaningful drawdowns. Add it up: 62% cumulative gains across the 10 midterm-year windows, but with enough volatility inside the path that position sizing and risk controls would have mattered.
History does not guarantee future results; adverse excursions can be large even in winning windows, and past seasonal behavior may not repeat.
Why does DTE Energy (DTE) follow this seasonal pattern?
One likely driver is the way midterm election years concentrate regulatory and infrastructure debates that matter for regulated utilities, including rate cases, grid investment and clean energy incentives. Analysts have also pointed to portfolio repositioning around summer demand and dividend capture in the sector, which can funnel flows into names like DTE during this stretch. The pattern may further reflect how investors handicap long-dated capital projects and policy risk before attention shifts to the presidential election year.
What is driving DTE Energy (DTE) today?
DTE Energy shares last traded around 149.19, up about 1.5% on the day and sitting roughly 1.4% below their 52-week high of 151.29, with the stock also ahead about 4.33% over the past month as it rides a steady uptrend supported by a 50-day moving average near 142.86 and 20-day average volume of roughly 1.51 million shares.
In July 2025, DTE highlighted that it was in advanced talks to supply more than 3 gigawatts of power to Big Tech data centers, with discussions representing up to 7 gigawatts of potential new load, and reaffirmed a full-year 2025 adjusted profit range of $7.09 to $7.23 per share.[1] The same period saw commentary that rising AI-related data center demand could require new battery storage and generation capacity, putting utilities like DTE at the center of the grid and storage build-out theme.[1] Short interest was cited at about 1.88% on a Seeking Alpha page in late July 2025, a relatively low level that suggested limited outright bearish positioning at that time.[2]
The chart below situates the latest move in its recent multi-month context alongside a 60-day seasonal projection.
What should traders watch as this DTE Energy seasonal window approaches?
The 51-day window starting Jul 2 has a rare 10-for-10 record for DTE in midterm election years, but the path has sometimes included double-digit drawdowns before finishing higher. Traders will be watching whether the stock can hold above its 50-day moving average around 142.86 and whether any pullbacks stay shallow relative to the deeper adverse moves seen in years like 2002. On the fundamental side, updates on large-scale data center power contracts, grid investment plans and any new guidance around capital spending or regulation could either reinforce or challenge the historical summer strength narrative.[1] Finally, behavior inside the window will be telling: a pattern of steady higher lows and contained intraperiod downside would echo the historical seasonal bias, while a break of recent support with unusually heavy volume would mark a clear departure from the past 10 midterm-year cycles.
Sources
About this seasonal analysis
Seasonal pattern data is sourced from TradeWave.ai, which analyzes historical price behavior across annual calendar windows going back up to 30 years. Read the full data methodology or the book The 100-Year Pattern by Afshin Moshrefi (2026 edition). Past performance of seasonal patterns does not guarantee future results. This article is for informational purposes only and does not constitute investment advice.