Copart (CPRT) Faces 86% Short-Side Win Record as Jul 20 Midterm Window Opens
Copart is hovering just above its 52-week low as it approaches a midterm-year seasonal window that has usually favored downside moves and sharp intraperiod swings.

What is the seasonal pattern for Copart (CPRT)?
Copart has fallen in 6 of 7 midterm-year windows starting around Jul 20 and lasting 76 trading days, with an average 10.03% gain in winning years for the short setup.
- 6-for-7 record in this window for the short side, with Percent Profitable at 86% based on 6 winners and 1 loser.
- The seasonal window begins on Jul 20 and runs for 76 trading days across the last 7 midterm election years.
- Avg Profit for winning short years is 10.03%, while Avg Profit - All, including the one losing year, is 8%.
- Trade Direction is short, meaning the historical pattern has favored downside or soft drift rather than rallies.
- The TradeWave Ratio of 1.54 suggests price has typically traveled meaningfully in the trade direction within the window.
- Sharpe ratio of 1.04 points to a relatively strong risk-adjusted profile for this specific Copart trading window.
According to historical data from TradeWave.ai, this midterm-year stretch has behaved very differently from an average quarter for Copart, and the next iteration is only weeks away.
How has Copart (CPRT) traded in this midterm-year window?
Copart has moved lower in 6 of the last 7 midterm election years during the 76-day window that starts around Jul 20, making it a historically favorable stretch for short positions. Today the stock closed at 29.70, up 0.7% on the day, leaving it about 40.8% below its 52-week high of 50.11 and just 1.0% above its 52-week low of 29.41.
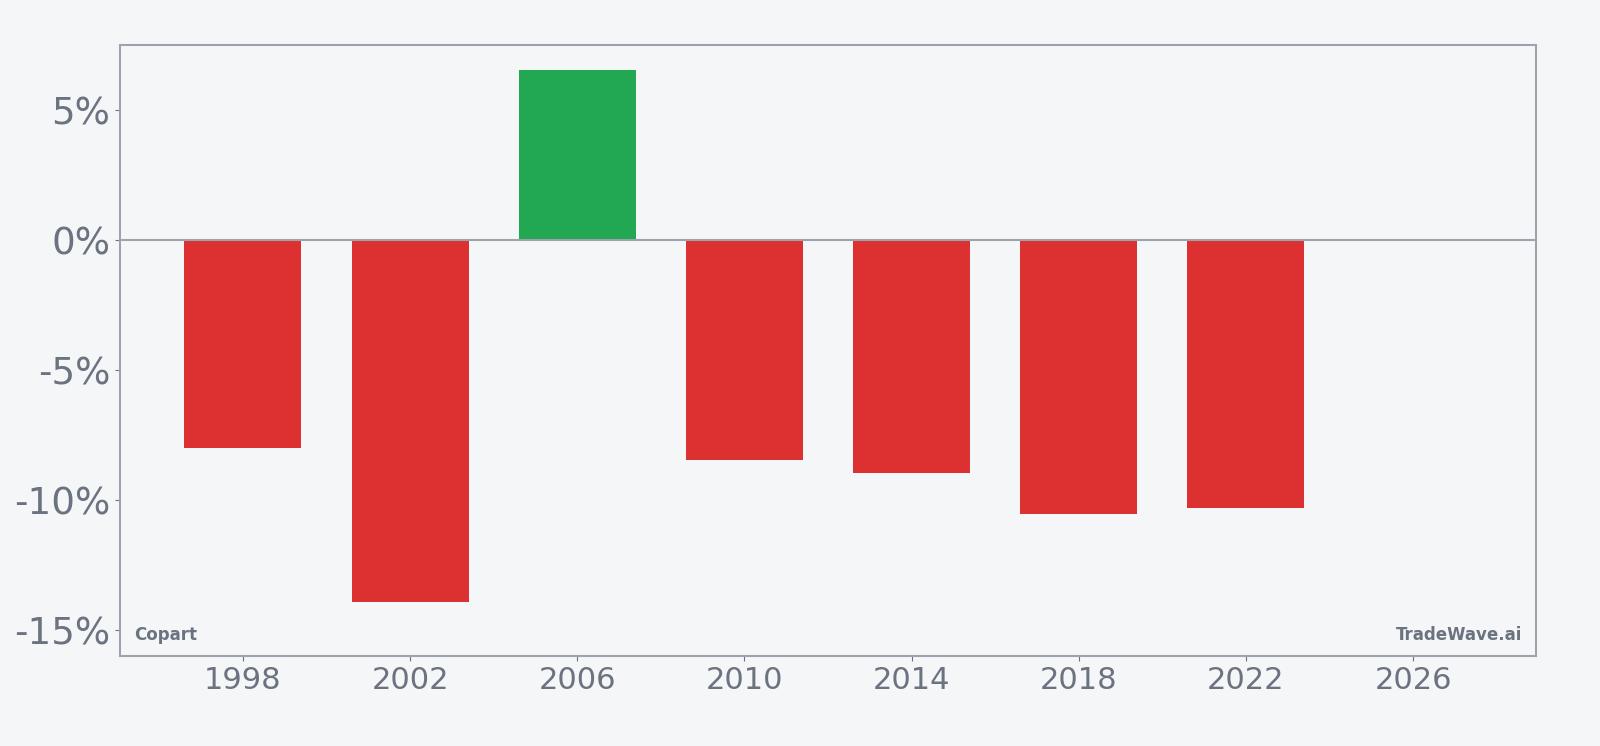
Grouping the data by the presidential election cycle matters here because this window sits in the midterm election year, a phase that often brings policy uncertainty, shifting regulation expectations and more cautious positioning in economically sensitive names like auto salvage and remarketing. Pattern phase equals midterm election year, and calendar phase is also midterm election year, so the historical sample lines up cleanly with today’s backdrop.
This seasonal window begins on Jul 20 and spans 76 trading days. Historically, during this period, Copart has shown a clear downside bias for the short side, with 86% of the midterm-year samples finishing profitable for shorts and only one year going against that direction.
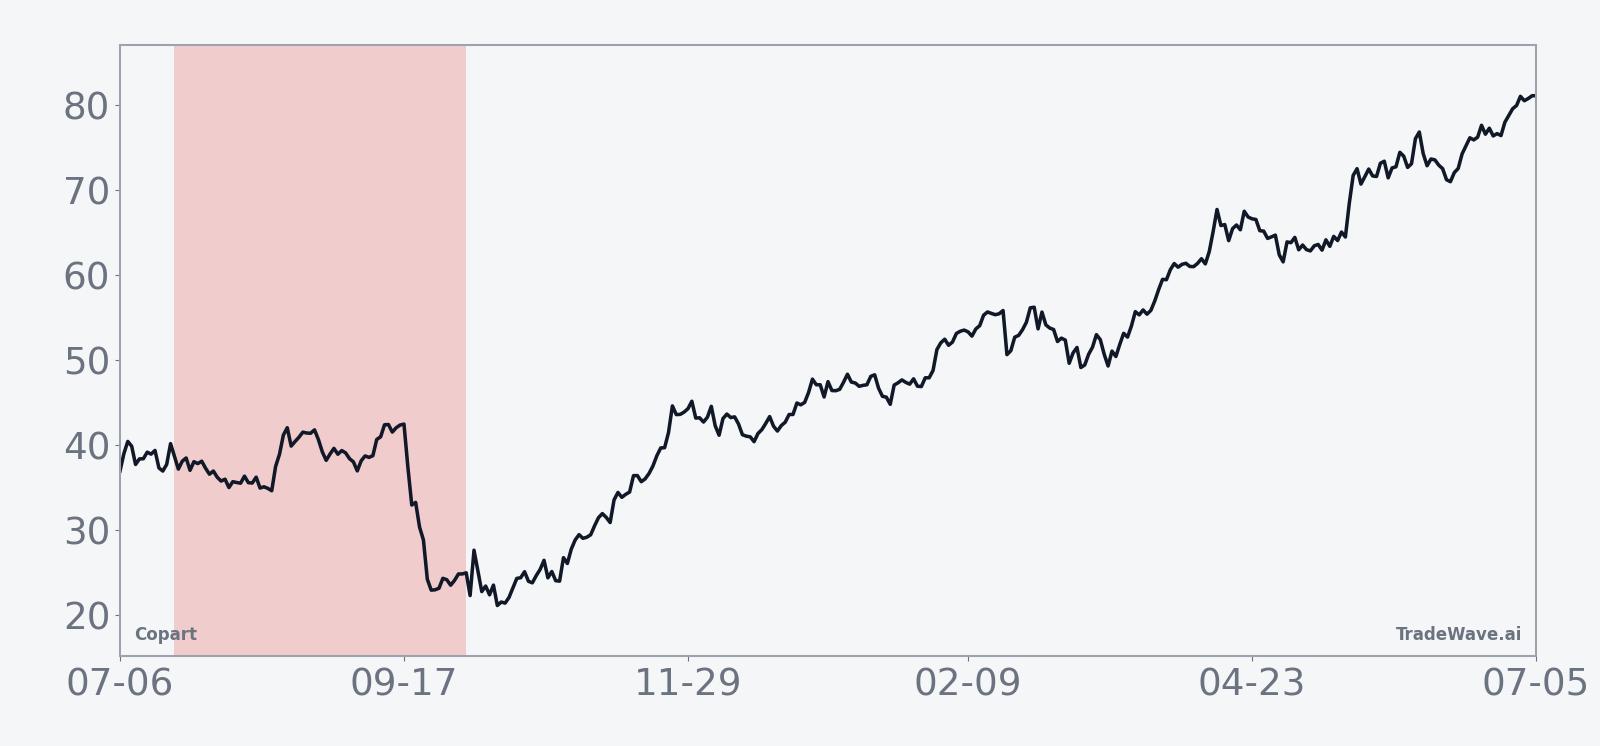
The average winning short year in this Copart trading window has delivered a 10.03% move in the trade direction, while including the lone losing year pulls the all-years average to 8%. That gap between Avg Profit and Avg Profit - All shows that the one unfavorable year did hurt, but not enough to erase the broader midterm-year seasonal trend.
Looking at individual years, 2002 stands out as a strong short-friendly stretch with a net return of -13.92% for the stock and a maximum favorable move of 17.72% from entry, while 2006 was the toughest year for shorts, with Copart rising 6.51% and only a shallow 2.96% worst drawdown against the position. In more recent cycles like 2018 and 2022, the stock again finished lower in this window, with net returns of -10.52% and -10.31% respectively, reinforcing that the pattern has persisted into the modern, higher-priced era.
The maximum favorable excursions in the sample, such as 17.72% in 2002 and 13.77% in 2018, show that when the short side works, it can work quickly and with size. At the same time, maximum adverse moves like -32.0% in 1998 and -30.38% in 2002 highlight that intraperiod rallies against shorts have also been violent, even in years that ultimately finished profitable for the pattern.
Trend statistics back up the idea that this is a short-dominated stretch rather than a coin flip. The pattern shows 73 days where the short trend dominates versus zero for the long side, and a similar skew when looking at the shorter-term trend snapshot, which logs 64 short-trend days and none for longs.
On a cumulative basis, the 65% total return for the short strategy across the seven midterm-year samples points to a steady build-up of gains rather than a single outlier year doing all the work. Add it up and you get a window that has repeatedly rewarded traders who respected the historical seasonality and the election-cycle context.
Yearly net and peak moves highlight how downside wins have often come with sizable countertrend rallies along the way.
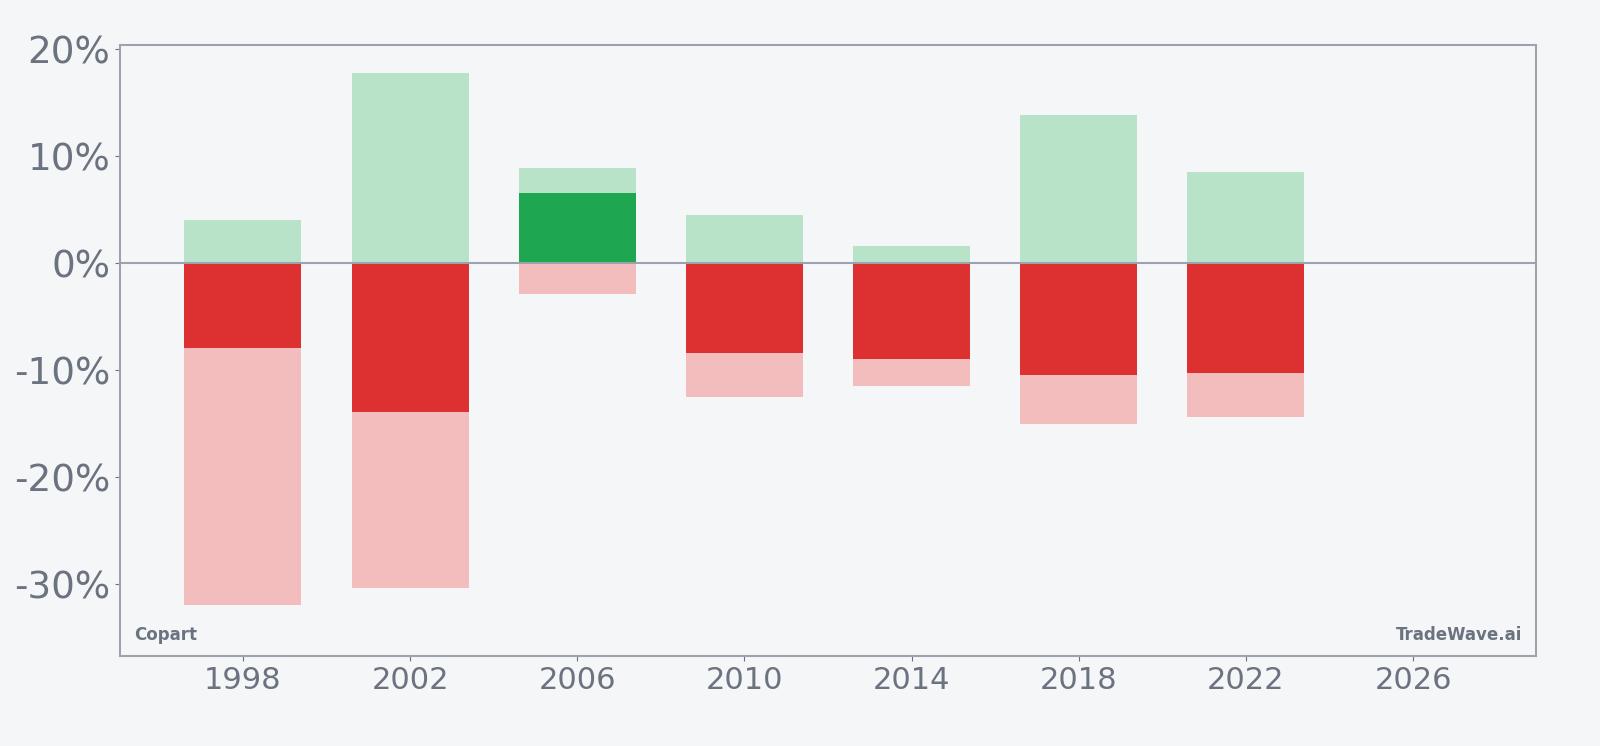
History does not guarantee future results; adverse excursions (MAE) can be large even in winning windows.
Why does Copart (CPRT) follow this seasonal pattern?
One likely driver is the way insurers and salvage operators adjust inventory and pricing in the middle of the year, which can affect volumes and sentiment around Copart’s business. Analysts have also pointed to institutional portfolio repositioning around the midterm election year, when policy risk and regulation debates can push investors to trim exposure to economically sensitive, high-margin names. This pattern may reflect that combination of insurance-cycle dynamics and election-year risk management showing up in Copart’s stock behavior during this specific window.
What is driving Copart (CPRT) today?
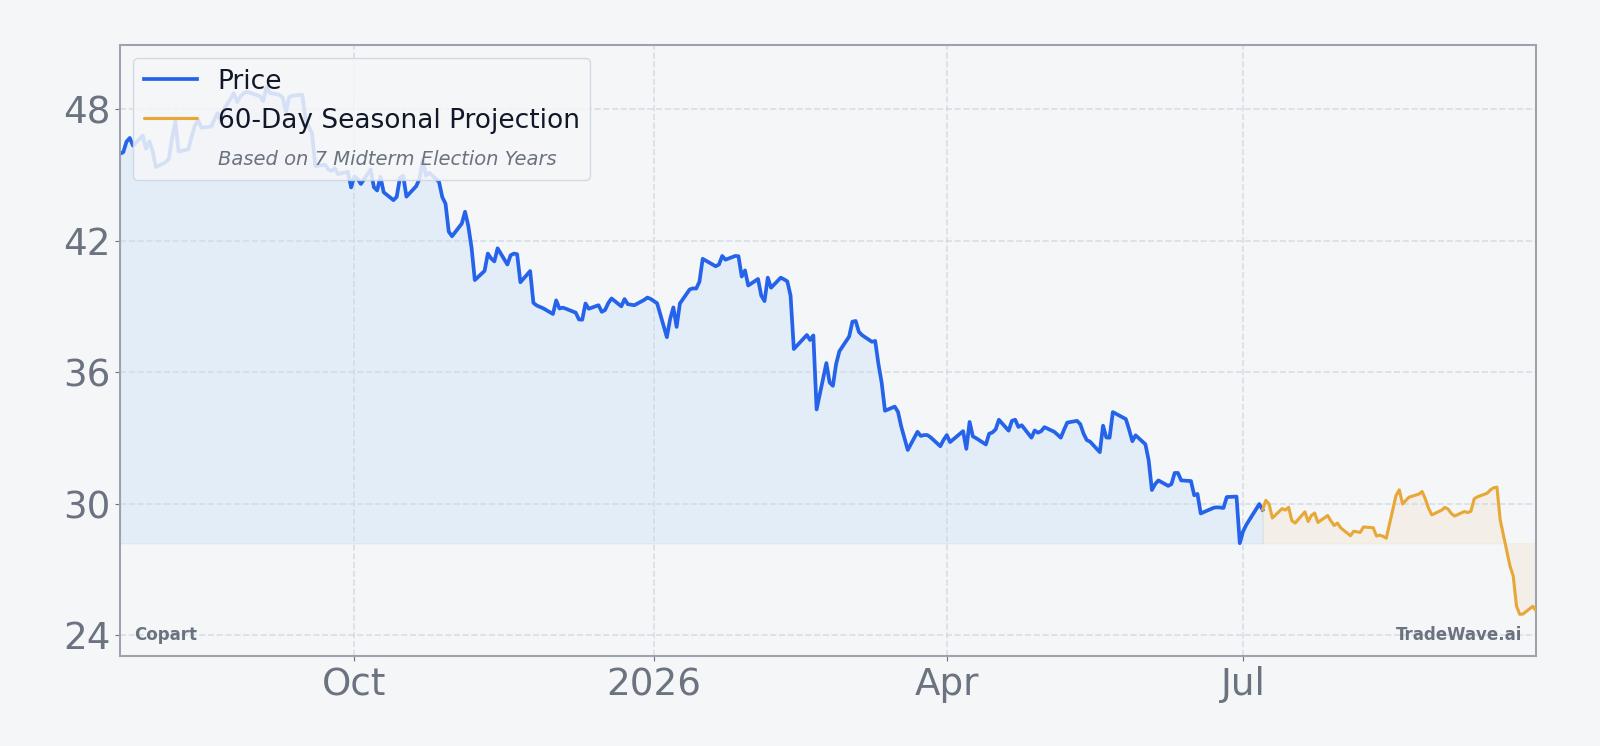
Copart shares finished Wednesday at 29.70, up 0.7% on the session, but the bigger picture is a stock that has dropped 14.3% over the past month and sits roughly 40.8% below its 52-week high, even as it clings to a modest 1.7% gain year to date. The stock is trading just above its 52-week low, with average 20-day volume of about 12.26 million shares and a 50-day moving average up at 32.54, underscoring how far the recent slide has pulled it below its intermediate trend.
Fundamentally, Copart is coming off a Q1 FY26 in which revenue grew 0.7% year over year, average selling prices for salvage vehicles climbed 8%, and the company posted robust gross and net margins of roughly 47.62% and 34.24% respectively.[1] That margin strength has been supported by higher total loss frequency in the insurance industry, which increased 22.6% over the first nine months of 2025 and has kept a steady flow of vehicles moving through Copart’s online auctions.[1]
On the product side, Copart’s VB3 online platform and expansion into “Blue Car” and “Purple Wave” channels are designed to deepen its buyer base and extend its reach into new geographies and asset types, potentially offsetting softer headline revenue growth with mix and efficiency gains.[1] Sector-wise, the automotive salvage and remarketing space continues to benefit from higher salvage values and the structural shift toward digital remarketing, trends that have helped Copart maintain pricing power even as catastrophic weather events have been relatively muted in the latest quarter.[1]
The chart below situates the latest move in its recent multi-month context and overlays a short-term seasonal projection.
What should traders watch as this Copart seasonal window approaches?
First, the calendar: the 76-day midterm-year window kicks off on Jul 20, so price action in the next few weeks will set the starting point for a period that has historically favored shorts. A bounce back toward the 50-day moving average near 32.54 before the window opens would give more room for the kind of downside moves seen in prior cycles, while a continued grind near the 52-week low would change the risk-reward profile.
Second, watch how fundamentals and macro insurance trends evolve into late summer. If total loss frequency stays elevated and salvage prices remain firm, Copart’s earnings backdrop could stay solid even if the stock follows its historical seasonal pattern lower, creating a potential disconnect between fundamentals and price.[1] Any shift in catastrophe activity or regulatory headlines around insurance and auto claims during the midterm election year could also feed into volatility for the name.
Third, monitor intraday swings once the window opens. Past years have shown that even in winning short windows, Copart has seen sharp rallies against the trade, with maximum adverse moves that can reach double digits before the trend reasserts. If this year’s window starts to mirror that behavior, traders will want to track whether downside moves are accompanied by expanding volume and whether bounces are being sold rather than chased.
Finally, the key tell will be whether Copart once again finishes the Jul 20 to early-October stretch lower, in line with 6 of the last 7 midterm-year samples, or whether it delivers another outlier year like 2006 where the stock climbed despite the seasonal backdrop. A sustained break back above the 50-day moving average and a failure of the short side to gain traction during the heart of the window would be a clear sign that this cycle is diverging from the historical Copart seasonal trend.
Sources
- [1] Forbes, “Should You Consider Adding Copart Stock To Your Portfolio?” (Jan 12, 2026).
About this seasonal analysis
Seasonal pattern data is sourced from TradeWave.ai, which analyzes historical price behavior across annual calendar windows going back up to 30 years. Read the full data methodology or the book The 100-Year Pattern by Afshin Moshrefi (2026 edition). Past performance of seasonal patterns does not guarantee future results. This article is for informational purposes only and does not constitute investment advice.