7-of-8 Midterm Wins: HP Inc. (HPQ) Enters 228-Day Window Averaging 19% Gains
HP Inc. is heading toward a historically strong 228-day trading window even as the stock trades well below its 52-week high, setting up a notable test of its midterm-year seasonal pattern.
Price as of Jun 26, 2026: $22.88 (last close).

What is the seasonal pattern for HP Inc. (HPQ)?
HP Inc. has risen in 7 of 8 midterm-year windows starting in early July, with an average gain of 21.94% in winning years.
- 7 wins and 1 loss in this window, with winning years averaging 21.94% gains for HP Inc.
- The upcoming seasonal window begins Jul 2, 2026 and runs for 228 calendar days across the last 8 midterm election years.
- Percent Profitable stands at 88%, with 7 winners and 1 loser in the historical sample.
- Including every year, Avg Profit - All is 19%, showing the lone losing year has not erased the typical upside.
- Maximum favorable moves have reached into the mid-40% range in several years, but adverse excursions have stretched beyond -20% in the weakest cases.
- Trade Direction is long, with a TradeWave Ratio of 1.88 and a Sharpe ratio of 1.1, pointing to a historically strong but still volatile HPQ seasonal trend.
According to historical data from TradeWave.ai, this midterm-year stretch for HP Inc. has behaved very differently from an average calendar year, with a distinct bias that shows up when you group only similar election-cycle years.
How has HP Inc. (HPQ) traded in this midterm-year seasonal window?
HP Inc. has risen in 7 of the last 8 midterm election years during the 228 calendar days that start around Jul 2, averaging 21.94% gains in winning years. Shares finished the prior session at 22.88, leaving the stock about 20.9% below its 52-week high of roughly 28.94 and well above its 52-week low near 16.60. That gap between current price and the upper end of the past year’s range is what makes this historically strong HPQ seasonal trend so interesting as the next window approaches.
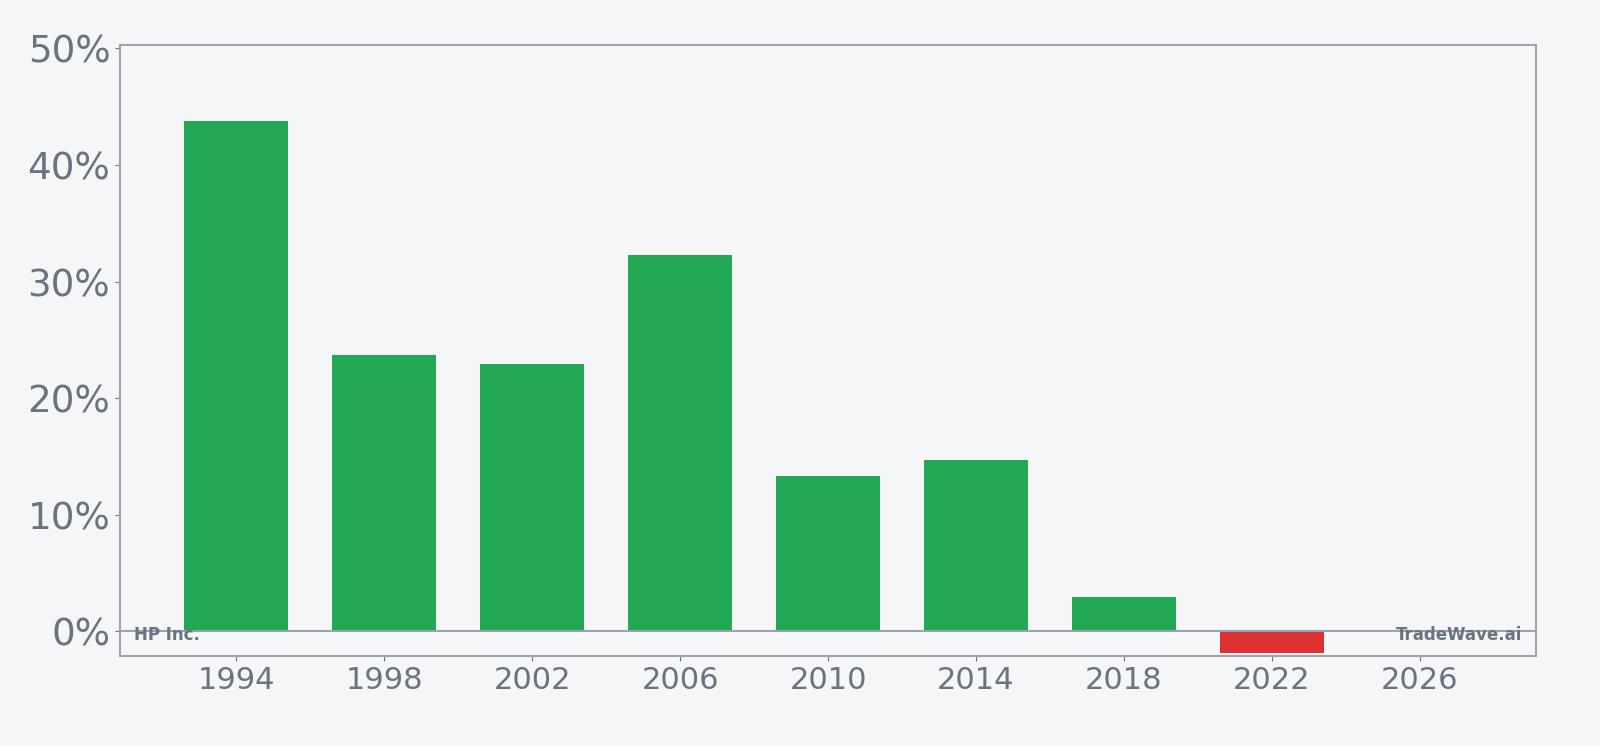
Grouping by the presidential election cycle matters here because this pattern only looks at the last eight midterm election years, not every year on record. Midterm years often feature a different policy and liquidity backdrop than election or pre-election years, and HP Inc.’s historical seasonality in this specific slice of the calendar reflects that distinct environment.
Across those eight midterm-year samples, HPQ’s long-direction pattern has been clearly positive. Percent Profitable is 88%, with 7 winners and just 1 loser, and the all-years average outcome of 19% suggests that even when you include the down year, the typical result has been a sizable gain. The median profit of 18.8% lines up closely with that story, which means the distribution of outcomes has not been skewed by a single outlier year.
The per-year table shows how that plays out in individual cycles. The strongest run came in 1994, when HPQ gained 43.74% over the window, with a maximum favorable move of 46.29% and only a -2.7% worst drawdown from entry. At the other end of the spectrum sits 2022, the lone losing year, where the stock finished the window down 1.87% after suffering a maximum adverse move of -22.98% despite a positive intraperiod rally of 11.98%.
Those maximum favorable and adverse excursions are a reminder that this has been a high-energy HP Inc. trading window, not a slow grind. Several winning years, including 1998, 2002 and 2006, saw maximum favorable moves in the mid-30% to mid-40% range, but they also carried double-digit worst drawdowns along the way. In 1998, for example, HPQ’s best run-up reached 47.17% while the worst pullback from entry hit -17.63% before the stock closed the window up 23.7%.
The historical seasonal trend chart for this window shows that gains have tended to build over the full 228-day stretch rather than arriving in a single burst. The average path slopes higher with some mid-window choppiness, which fits the idea of a long midterm-year regime that spans multiple earnings reports and macro headlines. The cumulative return profile, at 279% across the eight-sample history, reflects that steady bias toward higher prices in this specific HPQ seasonal trend.
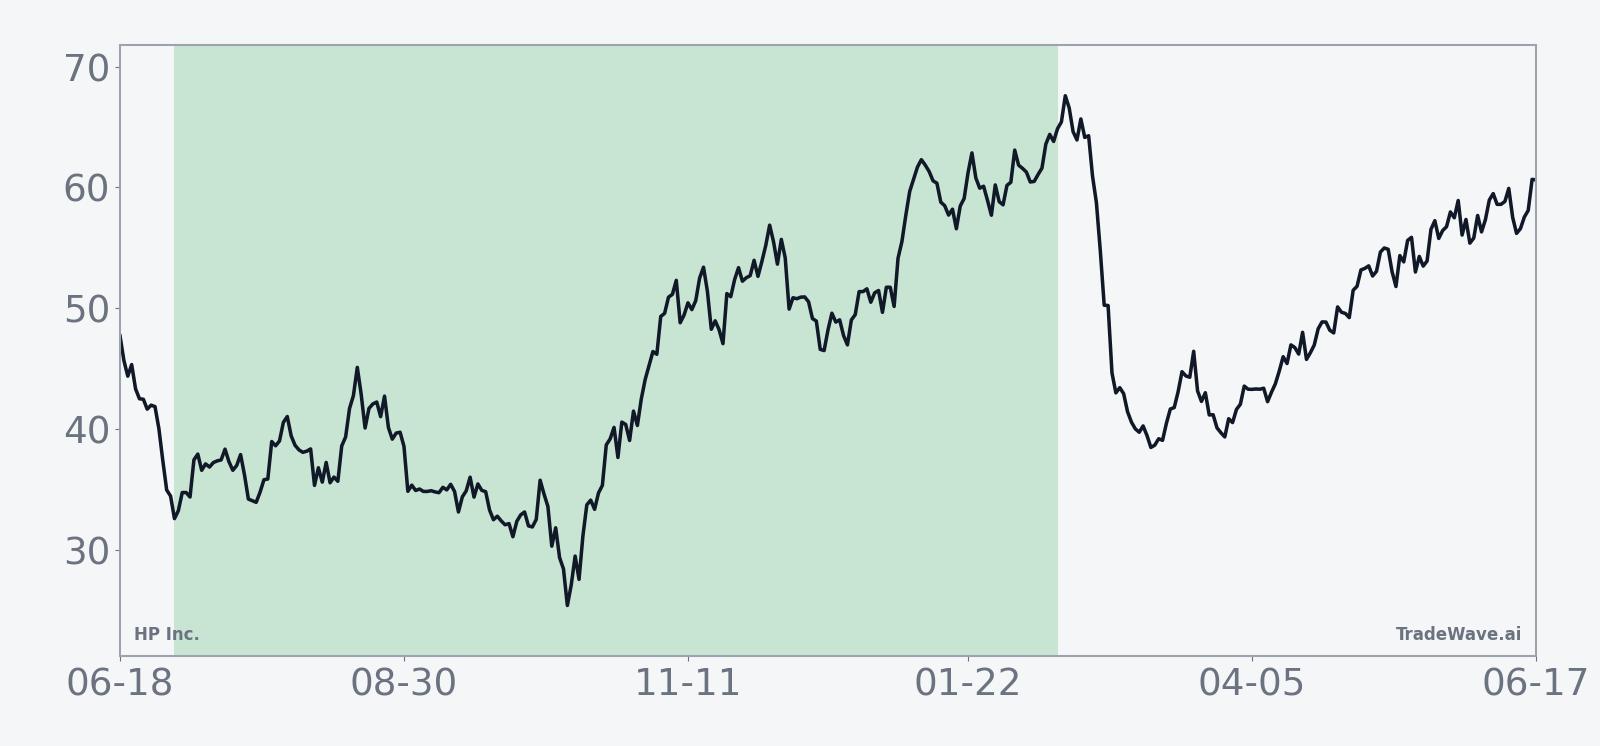
Year-by-year bars with maximum favorable and adverse moves show how often HPQ has swung sharply before settling on its final result.
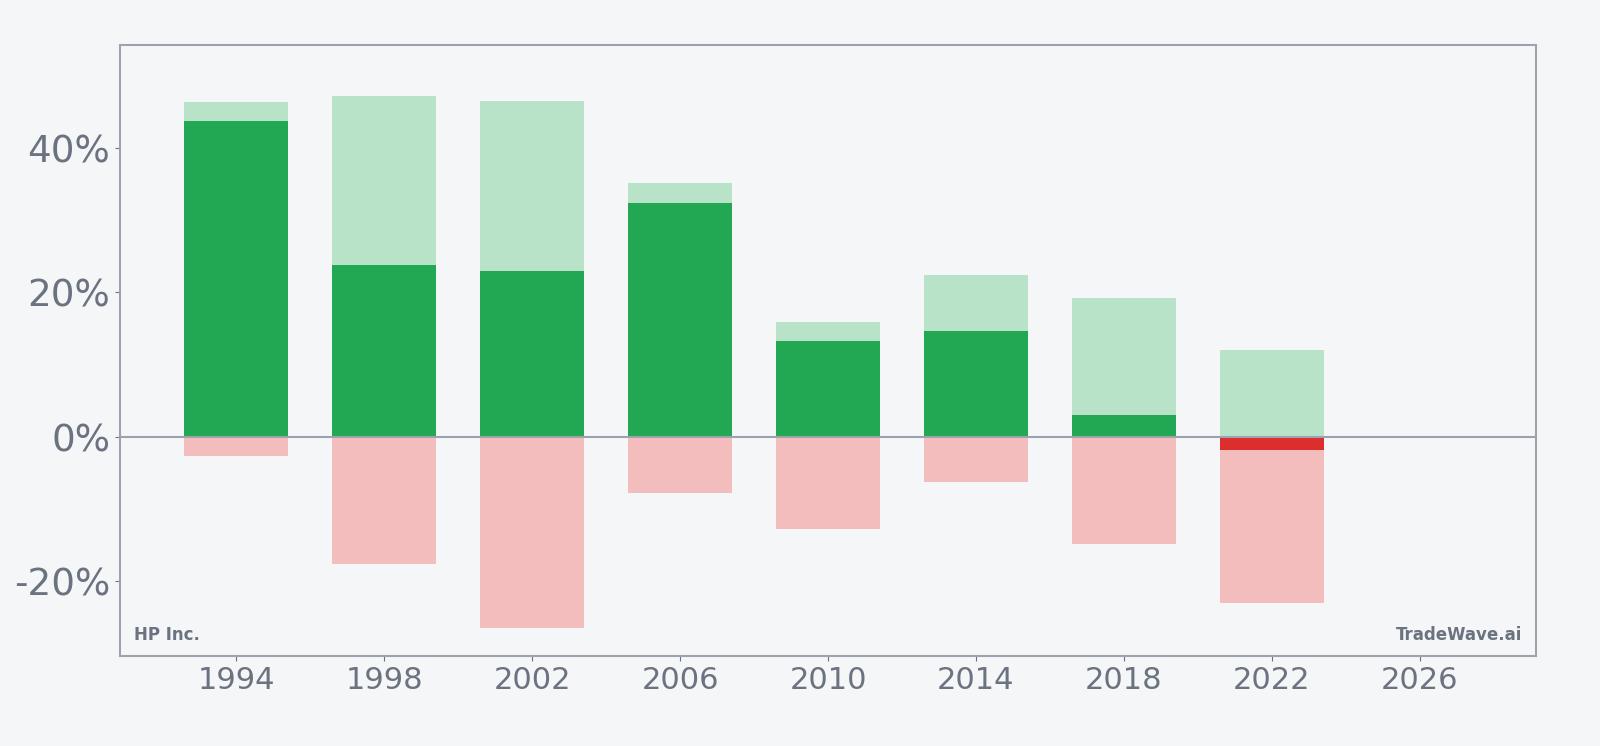
The stacked net, MFE and MAE bars underline the trade-off. In most years, HPQ has delivered a positive final return while also experiencing sizable intraperiod swings, with MAE often in the -10% to -20% range even in winning windows. For traders, that means the historical pattern has rewarded long exposure over the full window but has not spared investors from meaningful drawdowns along the way.
History does not guarantee future results; adverse excursions can be large even in winning windows, and past HPQ seasonal behavior may not repeat.
Why does HP Inc. (HPQ) follow this seasonal pattern?
One likely driver is the way HP’s earnings calendar and PC demand cycles line up with the midterm-year policy backdrop. Midterm years often bring regulatory noise and spending debates, while HP typically sees key product launches and corporate PC refresh decisions cluster around the back half of the year. This pattern may reflect institutional portfolio repositioning into or out of hardware names as visibility on fiscal policy, IT budgets and enterprise upgrade plans improves during that midterm-to-pre-election transition.
What is driving HP Inc. (HPQ) today?
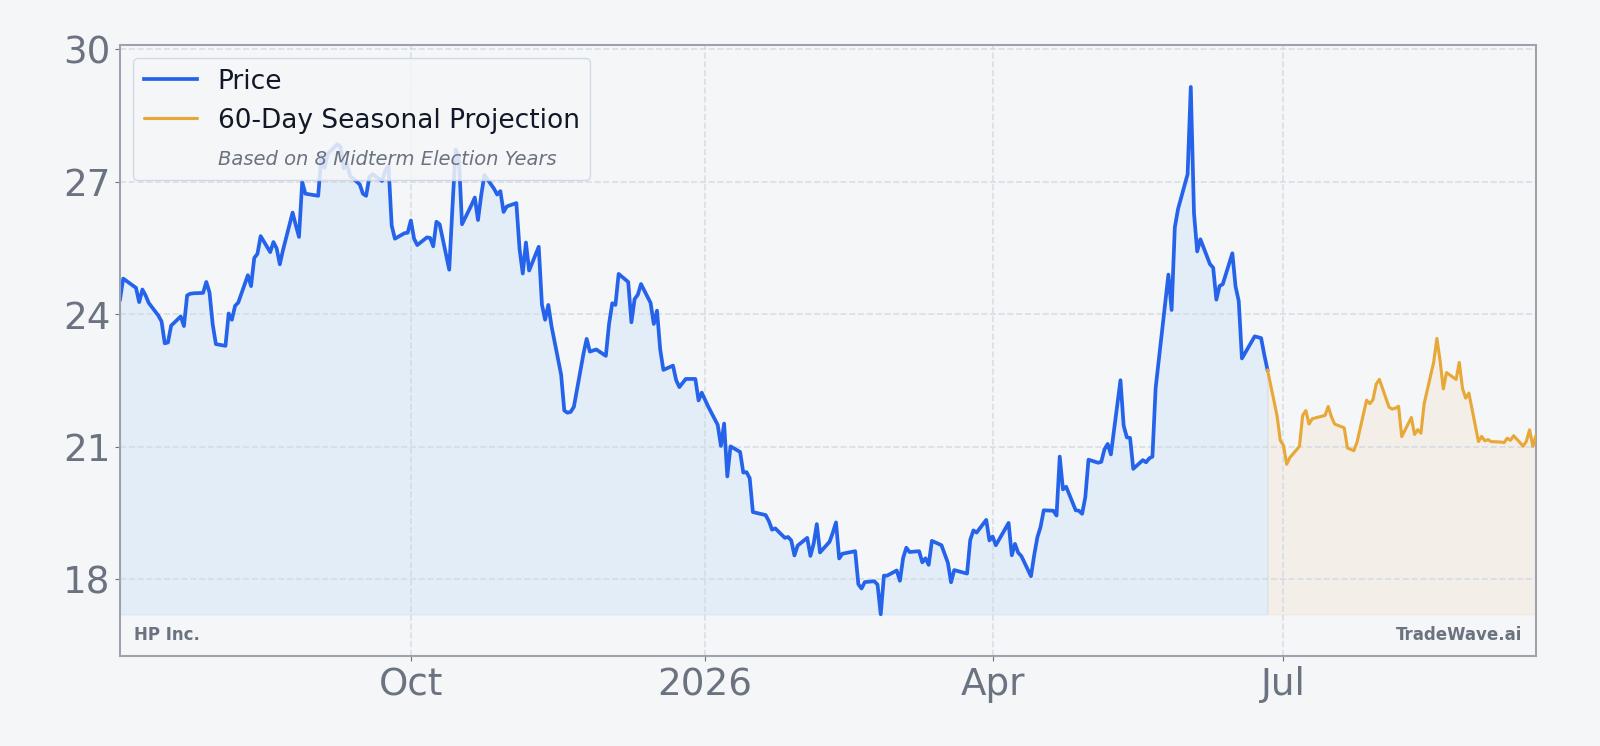
HPQ closed the latest session at 22.88, down 0.17% on the day, after trading between 22.545 and 23.395 on volume of about 16.9 million shares. That leaves the stock roughly 20.9% below its 52-week high near 28.94 and about 37.9% above its 52-week low around 16.60, with the 50-day moving average sitting close by at 22.35 and 20-day average volume near 21.7 million shares. The one-month return of -6.28% shows that HP Inc. has been under modest pressure into the end of June, even as the broader PC sector continues to lean on AI PC demand and the Windows 11 upgrade cycle for support.
In Aug 2025, HP reported adjusted EPS of $0.75 on revenue of $13.93 billion for its fiscal third quarter, with personal systems revenue up 6% to $9.93 billion and printing revenue down 4% to $4.0 billion.[1] Management pointed to AI-powered PC adoption and the Windows 11 refresh as key growth drivers and guided for fourth-quarter adjusted EPS between $22.55 and $23.39, excluding restructuring and other items.[1] That backdrop of a structurally improving PC refresh cycle remains a key part of the HPQ story as investors weigh how much of the AI PC and operating system upgrade tailwind is already in the price.
HP has also been navigating a shifting trade and supply-chain landscape. In Aug 2025, the company said it had shifted nearly all North America-bound production out of China to Southeast Asia, Mexico and some U.S. sites in response to evolving U.S. trade policy and tariffs.[1] That move helped reduce geopolitical risk but also introduced new cost and pricing dynamics that can affect margins and, by extension, how investors value HPQ heading into a long seasonal window.
The chart below situates the latest pullback against HPQ’s past year of trading and a short-term seasonal projection.
What should traders watch as this HPQ seasonal window approaches?
First, the calendar. The 228-day HP Inc. trading window tied to midterm election years begins on Jul 2, 2026 and runs deep into the following pre-election phase, a period that has historically been friendlier to risk assets. Traders watching HPQ’s seasonal pattern will want to see whether the stock can stabilize above the 50-day moving average and start closing the gap toward the mid-20s as the window opens, or whether the recent one-month softness extends into July.
Second, the policy and PC demand backdrop. Any fresh commentary on AI PC adoption, corporate IT budgets or the pace of the Windows 11 upgrade cycle could either reinforce or undercut the historical tendency for HPQ to trend higher across this midterm-to-pre-election stretch.[1] On the policy side, midterm-year debates over spending, trade and regulation can influence enterprise confidence and hardware orders, which in turn feed into HP’s earnings trajectory.
Third, price behavior inside the window relative to the historical MFE and MAE profile. In prior cycles, HPQ has often experienced double-digit drawdowns even in years that finished strongly higher, so traders may focus on how deep any early pullbacks run once the window starts. A pattern of shallower adverse moves than the historical -10% to -20% range, combined with constructive reactions to earnings and macro headlines, would line up with the bullish seasonal script. Conversely, a quick slide that resembles the 2022-style -22.98% worst drawdown would signal that this iteration of the window is tracking closer to the outlier year than the typical winner.
Add it up: HP Inc. is heading into a historically strong midterm-year seasonal window with a solid long-direction track record, but the path has rarely been smooth. For traders, the next few weeks will be about watching how HPQ trades around key support levels, how the PC refresh story evolves, and whether price action inside the window confirms or contradicts the stock’s 7-for-8 seasonal record.
Sources
About this seasonal analysis
Seasonal pattern data is sourced from TradeWave.ai, which analyzes historical price behavior across annual calendar windows going back up to 30 years. Read the full data methodology or the book The 100-Year Pattern by Afshin Moshrefi (2026 edition). Past performance of seasonal patterns does not guarantee future results. This article is for informational purposes only and does not constitute investment advice.