AI Data Center Boom Meets a Perfect 8-for-8 Midterm Run for Amphenol (APH)
Amphenol is heading into a historically powerful midterm-year seasonal window just as the stock trades near record highs on AI data-center optimism.
Price as of Jun 25, 2026: $165.15 (last close).

What is the seasonal pattern for Amphenol (APH)?
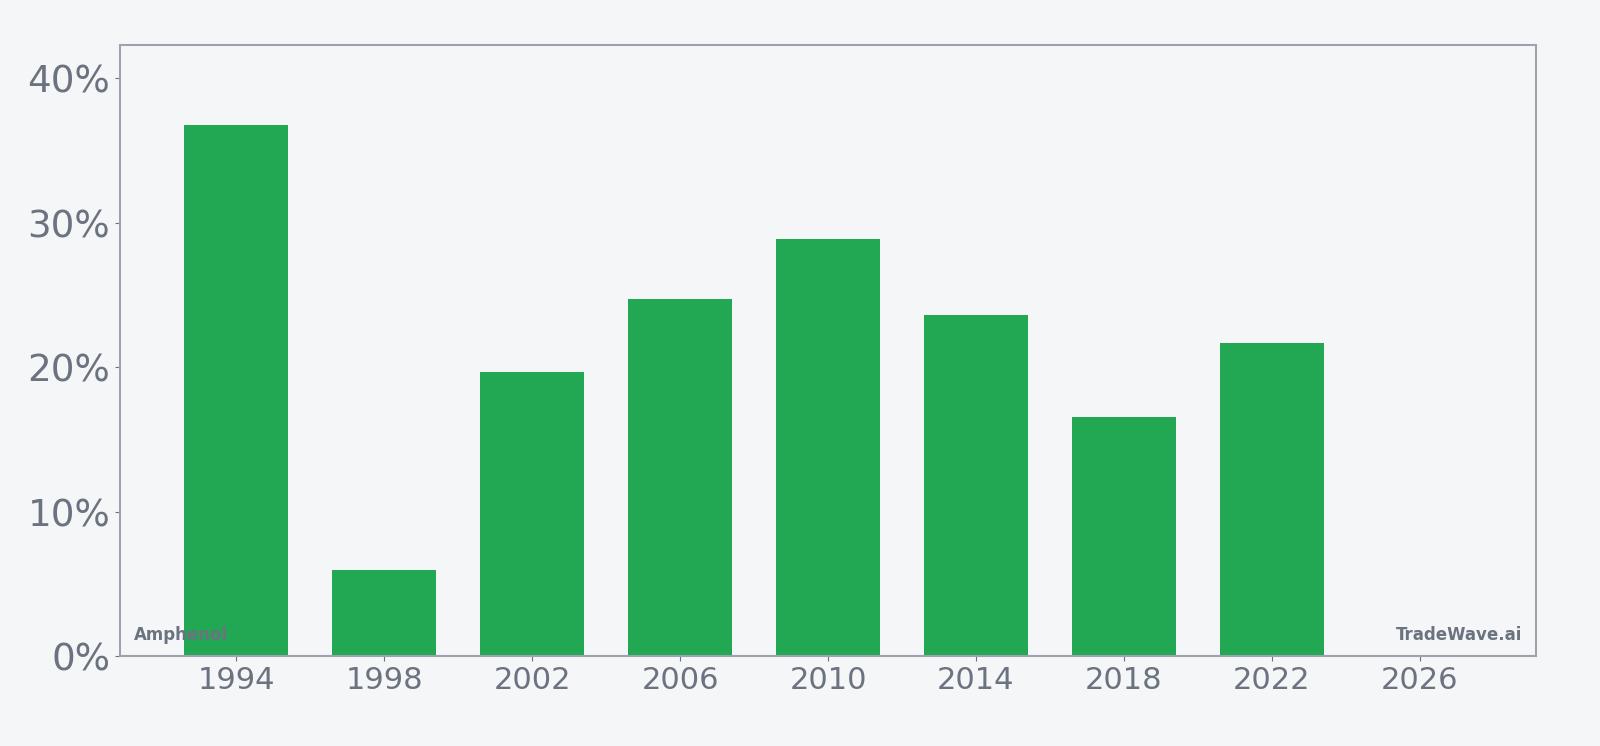
Amphenol has risen in 8 of 8 midterm-election-year windows starting in July, with an average gain of 22.25% in winning years.
- 8 for 8 in this window, with Amphenol averaging 22.25% gains across all winning years.
- Seasonal window begins Jul 11, 2026 and runs for 273 calendar days, spanning late midterm year into the pre-election year.
- Percent Profitable is 100%, with 8 winners and 0 losers across the last eight midterm-election-year cycles.
- Average winner gain of 22.25% comes alongside a 21.95% annualized return and a Sharpe ratio of 2.14 for this pattern.
- The TradeWave Ratio of 2.29 signals that price has typically traveled meaningfully in the long direction within the window.
- Intraperiod swings have included sharp rallies and occasional deep drawdowns, with some years seeing adverse moves larger than 20% before finishing higher.
According to historical data from TradeWave.ai, this is not just another stretch on the calendar for Amphenol. TradeWave.ai’s multi-decade seasonal database flags the upcoming midterm-year window as one of the stock’s most consistently positive regimes.
How strong is Amphenol (APH) in this midterm-year seasonal window?
Amphenol has posted gains in every one of the last eight midterm-election-year windows that start in July and run roughly nine months, averaging a 22.25% advance with a 21.95% annualized return. The next iteration of that 273-day window begins on Jul 11, 2026, with shares last changing hands at 165.15, about 2.1% below their 52-week high of 168.75. This combination of a clean 8-for-8 record and a stock already pressing against the top of its range gives the upcoming Amphenol trading window unusual weight for investors tracking historical seasonality.
Grouping the data by the presidential election cycle matters here because this window always lands in the back half of a midterm election year and then runs deep into the year before the presidential election, a phase that has often coincided with clearer policy visibility and stronger risk appetite across U.S. equities. For Amphenol, that backdrop has lined up with multi-quarter spending cycles in communications, broadband and defense hardware, which helps explain why this specific slice of the calendar has behaved differently from an average year.
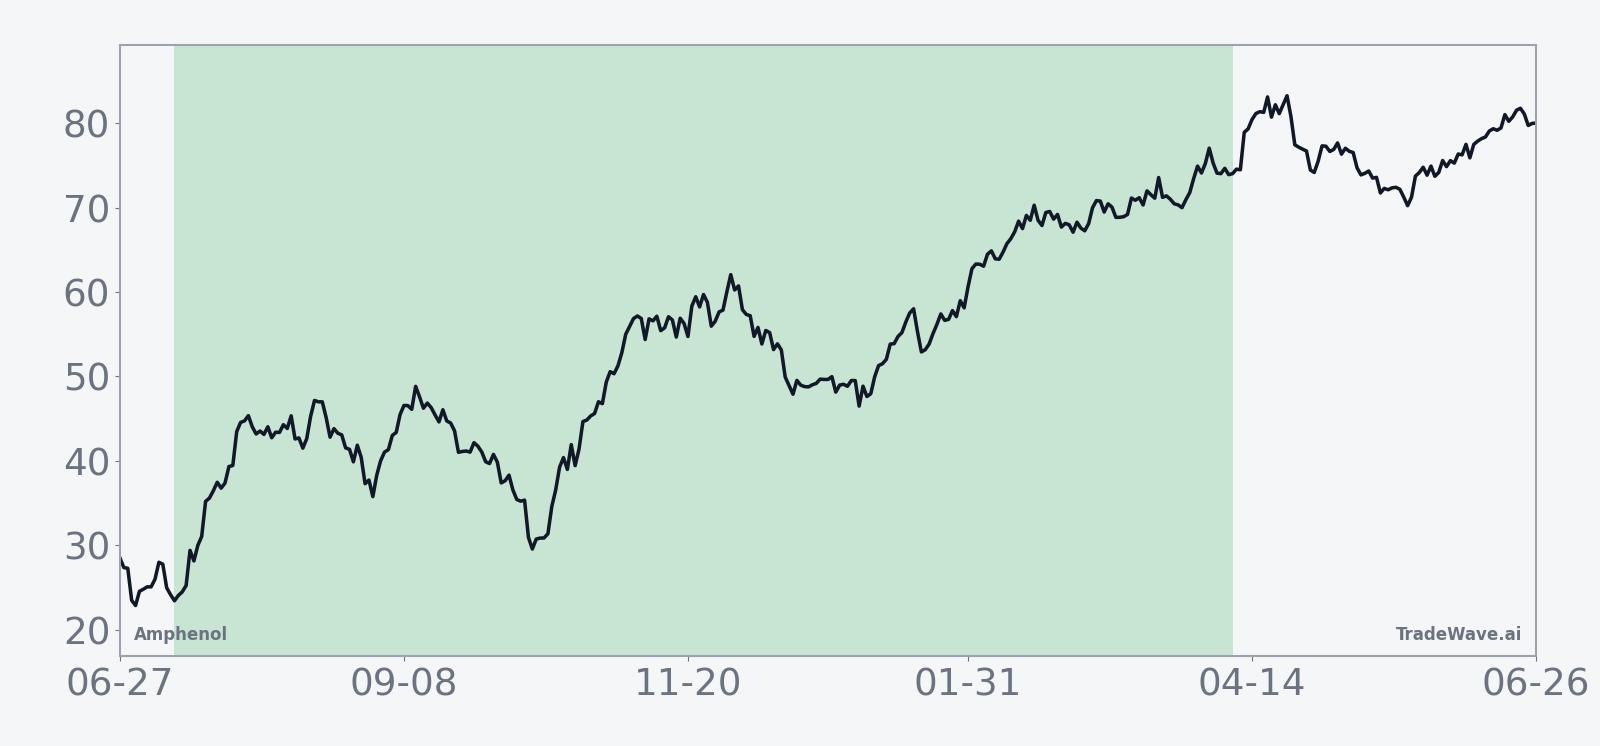
The historical seasonal trend line slopes higher for most of the 273-day stretch, with gains tending to build steadily rather than arriving in a single spike. Trend statistics show 74 days where the average path is meaningfully higher in the long direction versus only 1 day favoring shorts, and even on a stricter filter the pattern still tilts long on 67 days versus 5 short. That profile suggests a bias toward persistent upside rather than a one-off event, which is unusual for a single-stock seasonal pattern.
Year-by-year bars that include both peak rallies and worst drawdowns help show how much room Amphenol has historically had to run inside this window.
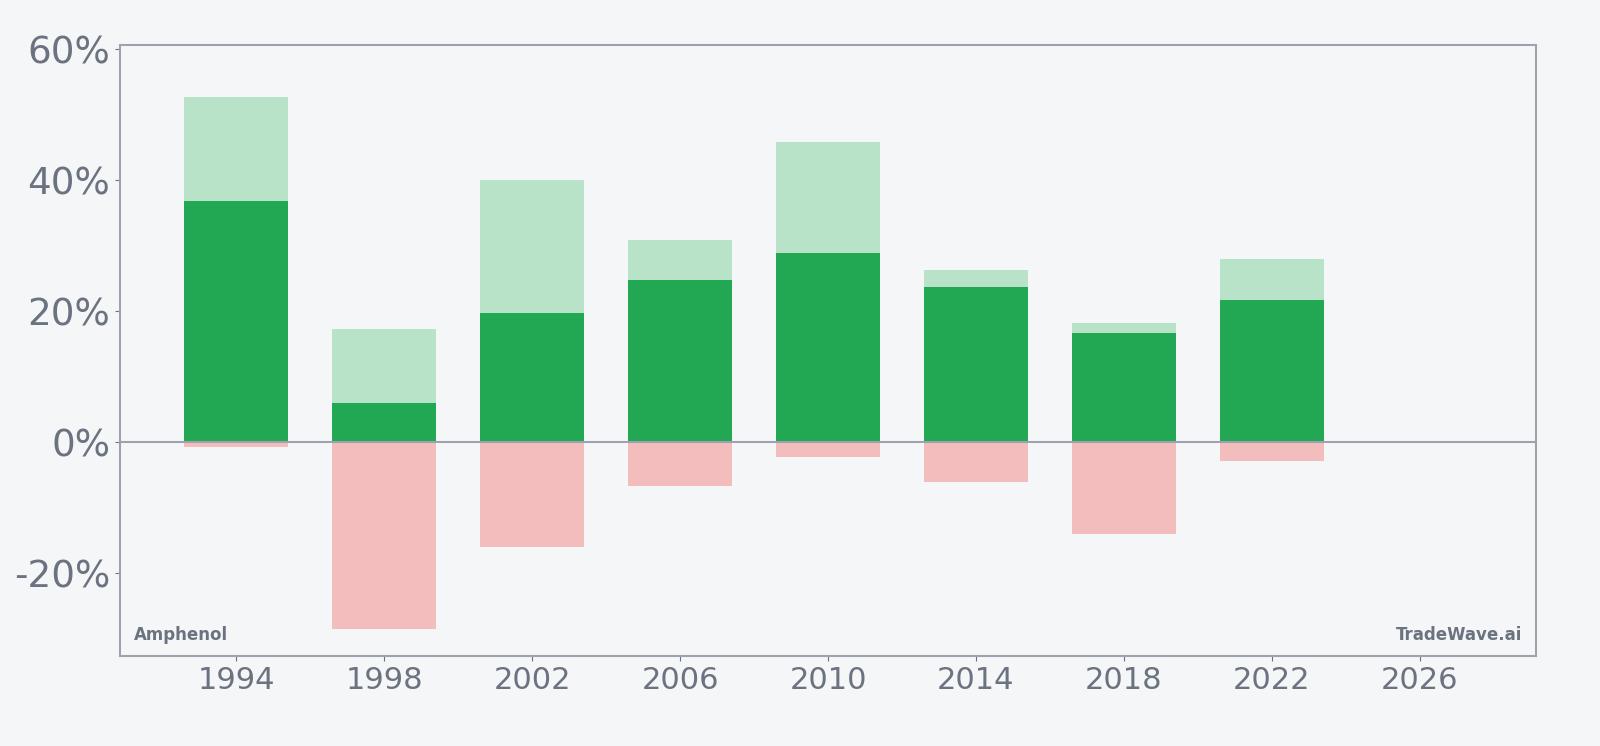
Per-year data show how that strength has played out in practice. The strongest run came in 1994, when Amphenol gained 36.8% in the window and at one point was up 52.79% from the entry before a modest pullback. The weakest net outcome was still positive, a 5.97% gain in 1998, but that year also carried the deepest intraperiod drawdown, with the stock down as much as 28.47% from the start before recovering. Other cycles, such as 2010 and 2014, delivered gains of 28.87% and 23.64% respectively, with maximum adverse moves contained to single digits, while 2022 saw a 21.7% net gain with a worst drawdown of just 2.91%.
The cumulative return chart for this pattern climbs from left to right with only shallow pauses, reflecting a 389% total gain across the eight midterm-year windows. Combined with a Sharpe ratio of 2.14, that consistency stands out even among strong seasonal setups. Add it up: eight midterm-election-year cycles, eight winners, and no historical example in this sample of the window finishing in the red.
History does not guarantee future results; even in all-winning samples like this, adverse excursions within the window can be large and uncomfortable before any recovery.
Why does Amphenol (APH) follow this seasonal pattern?
One likely driver is the way Amphenol’s end markets line up with the policy and spending rhythm around U.S. midterm elections, as infrastructure, broadband and defense budgets often become clearer heading into the year before the presidential vote. Analysts have also pointed to multi-quarter capital-expenditure cycles in data centers and communications equipment, which can bunch orders into the same late-year and early-year stretch that this window captures.[1] The pattern may also reflect institutional portfolio repositioning into high-quality industrial and communications names as political uncertainty fades and earnings visibility improves.
What is driving Amphenol (APH) today?
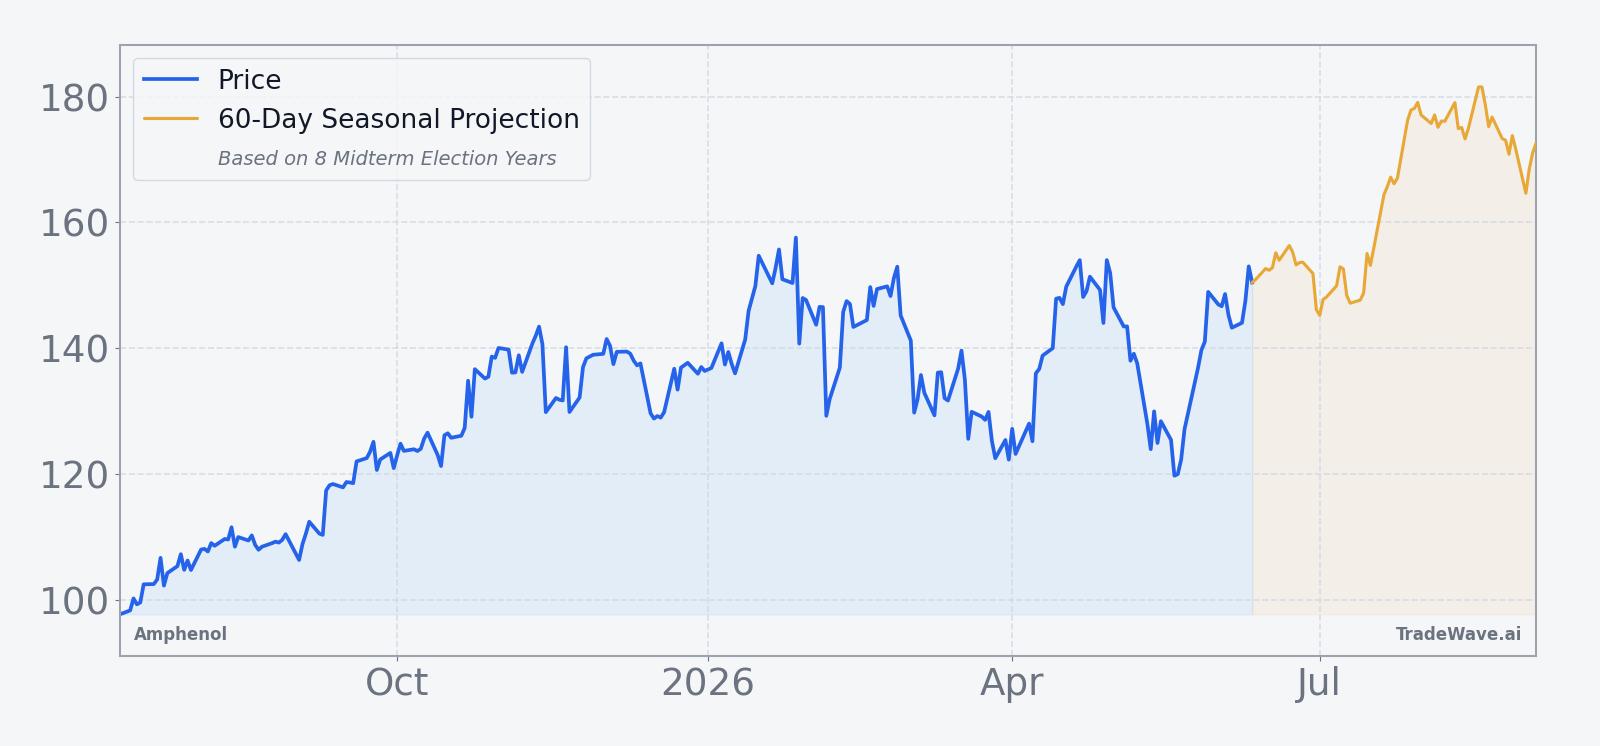
Amphenol closed the latest session at 165.15, up 1.46% on the day, leaving the stock about 2.1% below its 52-week high of 168.75 on heavy volume relative to its 20-day average of roughly 10 million shares. The stock has been in a powerful uptrend, trading well above its 50-day moving average of 143.87, as investors crowd into hardware suppliers tied to AI-driven data center buildouts and higher AI rack content.[1] In prior coverage, analysts highlighted expectations for triple-digit AI revenue growth into 2026, framing Amphenol as a key picks-and-shovels play on the AI infrastructure boom rather than a pure-play chip name.[1]
Beyond AI, Amphenol’s communications and defense interconnect businesses have been bolstered by a series of acquisitions that expand its reach in broadband connectivity and military-grade cable assemblies.[2][3] In Aug 2025, the company was reported to be in final-stage talks to acquire CommScope’s broadband connectivity and cable unit for about $10.5 billion including debt, a move that would deepen its exposure to fiber and broadband buildouts.[2] Later that month, Amphenol agreed to buy Trexon for about $1 billion, adding roughly $290 million of expected 2025 sales and strengthening its position in defense interconnects.[3] Those deals, while dated, help explain why the stock has become a broader bet on communications and defense infrastructure rather than a narrow component supplier.
The chart below situates the latest move in its recent multi-month context, alongside a short-term seasonal projection.
What should traders watch as this Amphenol seasonal window approaches?
First, the calendar: the midterm-year window opens on Jul 11 and runs for 273 calendar days, so any pullback or consolidation into that date will shape how stretched or reset the stock is when the historical pattern kicks in. Second, levels: with Amphenol sitting just below its 52-week high, traders will be watching whether the stock can hold above its 50-day moving average around 143.87 on any volatility, since prior winning windows have often tolerated drawdowns before resuming higher. Third, macro and policy catalysts: AI data-center capex announcements, broadband funding decisions and defense budget headlines will matter more than usual because they directly touch the demand drivers that have historically lined up with this window.[1][2][3] Finally, behavior inside the window itself will be the real test; if Amphenol can once again absorb intraperiod swings and finish the stretch higher, it would extend an 8-for-8 record that has quietly made this one of the more striking single-stock seasonal trends on the S&P 500.
Sources
About this seasonal analysis
Seasonal pattern data is sourced from TradeWave.ai, which analyzes historical price behavior across annual calendar windows going back up to 30 years. Read the full data methodology or the book The 100-Year Pattern by Afshin Moshrefi (2026 edition). Past performance of seasonal patterns does not guarantee future results. This article is for informational purposes only and does not constitute investment advice.