Duke Energy (DUK) Has Risen in 10 of 10 Midterm Summer Windows as July Run Nears
Duke Energy is heading toward a 39-day midterm-year seasonal window that has never been negative in the last 10 cycles, just as the stock trades near a 52-week high and investors weigh a massive grid investment push.
Price as of Jun 25, 2026: $127.11 (last close).

What is the seasonal pattern for Duke Energy (DUK)?
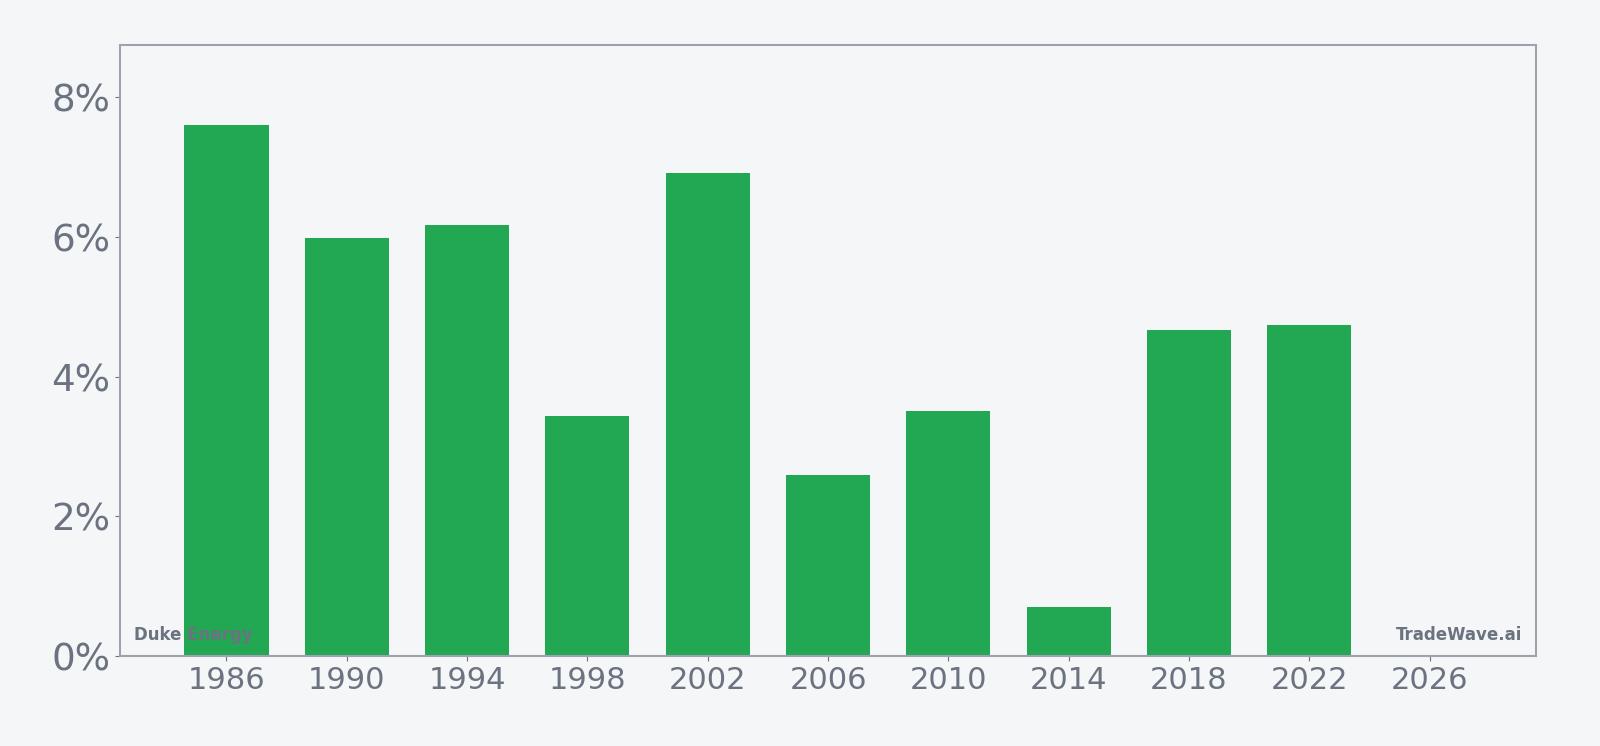
Duke Energy has risen in 10 of 10 midterm-year summer windows starting around Jul 10, with an average gain of 4.63% in winning years.
- 10 for 10 in this window, with Duke Energy averaging 4.63% gains in winning years across the last 10 midterm election cycles.
- The upcoming pattern runs 39 trading days from Jul 10, 2026, and has historically favored long positions in DUK during midterm summers.
- Percent Profitable is 100%, with 10 winners and 0 losers in this specific midterm-year seasonal slice.
- Median profit of 4.7% and a cumulative return of 56% across all 10 windows point to a steady bullish seasonal trend.
- The TradeWave Ratio of 2.48 and Sharpe ratio of 1.99 indicate historically strong upside moves relative to volatility in this window.
- Intraperiod drawdowns have varied widely, including one year with a roughly 30% adverse move, so the path to gains has not always been smooth.
According to historical data from TradeWave.ai, this midterm-year summer stretch has behaved very differently from an average month on the calendar for Duke Energy. The next section walks through how that pattern has played out in prior cycles and what it means for the upcoming 39-day window.
How has Duke Energy (DUK) traded in past midterm-year summer windows?
Duke Energy has risen in every one of the last 10 midterm election years during the 39 trading days starting Jul 10, posting an average gain of 4.63% for long positions. The stock finished the latest session at $127.11, up 0.5% on the day and about 3.8% below its 52-week high of $132.20, leaving it near the upper end of its recent range.
Grouping the data by the presidential election cycle matters here because utilities often respond to policy and rate expectations that ebb and flow with Washington’s calendar. Midterm years tend to feature regulatory noise and rate-case positioning, while the following pre-election year has historically leaned more risk-on for equities, so a midterm-to-pre-election summer window can capture a distinct phase in that policy rhythm.
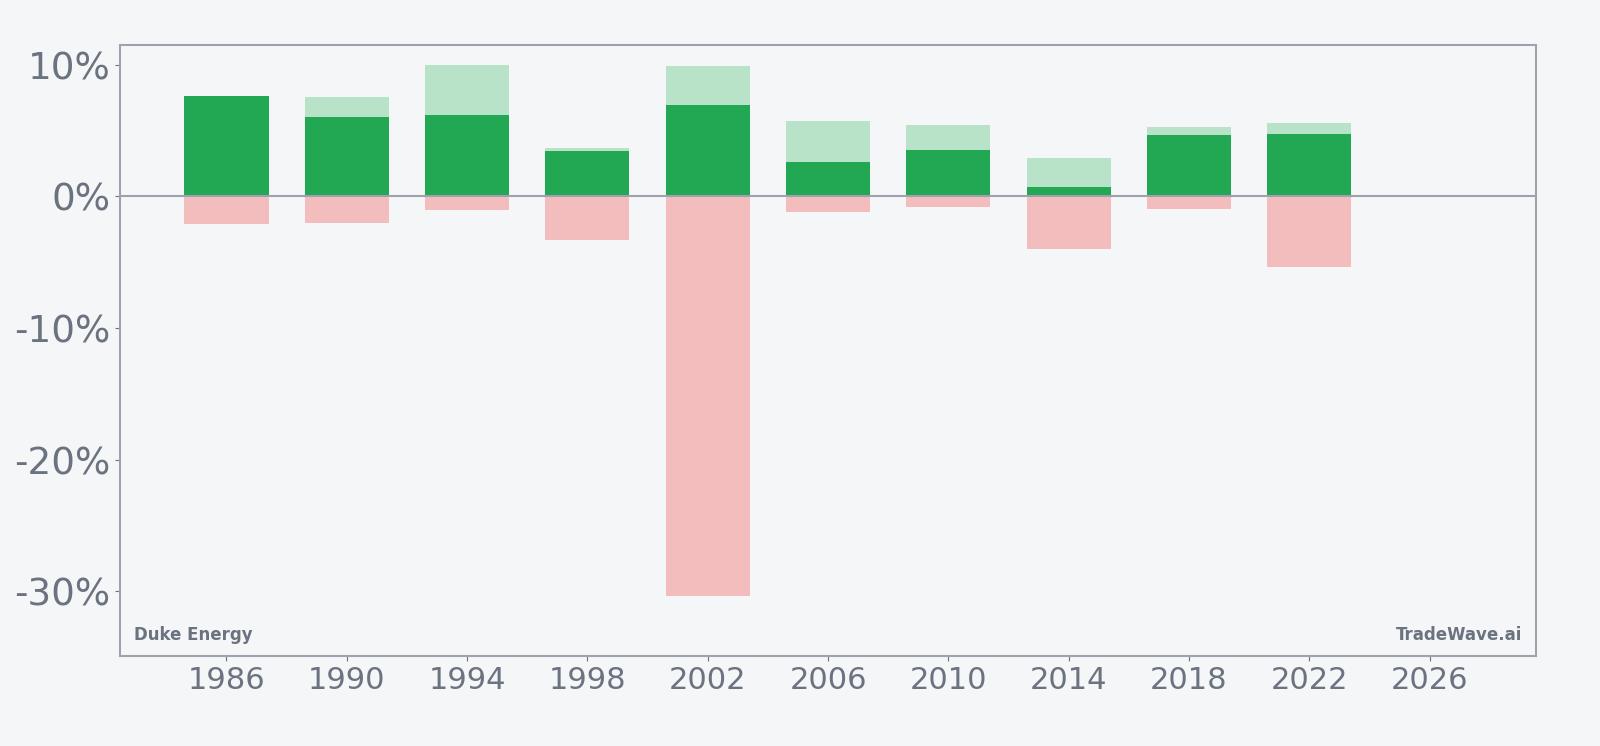
A second view layers in both the best and worst intraperiod swings for each year.
Across the 10 midterm-year samples, the long trade direction has been clear: every window finished positive, with a cumulative return of 56% and a median gain of 4.7%. Average winners at 4.63% line up closely with the all-years average, which is also 5% when rounded, underscoring how few outliers there have been on the upside.
The maximum favorable move inside the window has often exceeded the final gain, which is what the TradeWave Ratio of 2.48 is flagging. In several years, Duke Energy rallied between roughly 5% and 10% at some point during the 39 days, even if it gave back part of that move by the close.
The maximum adverse move has been more uneven. Most years saw modest drawdowns of around 1% to 4%, but 2002 stands out with an intraperiod drop of about 30.38% before finishing the window higher. That single episode shows how a long-biased seasonal edge can still coexist with sharp, temporary downside in a stressed tape.
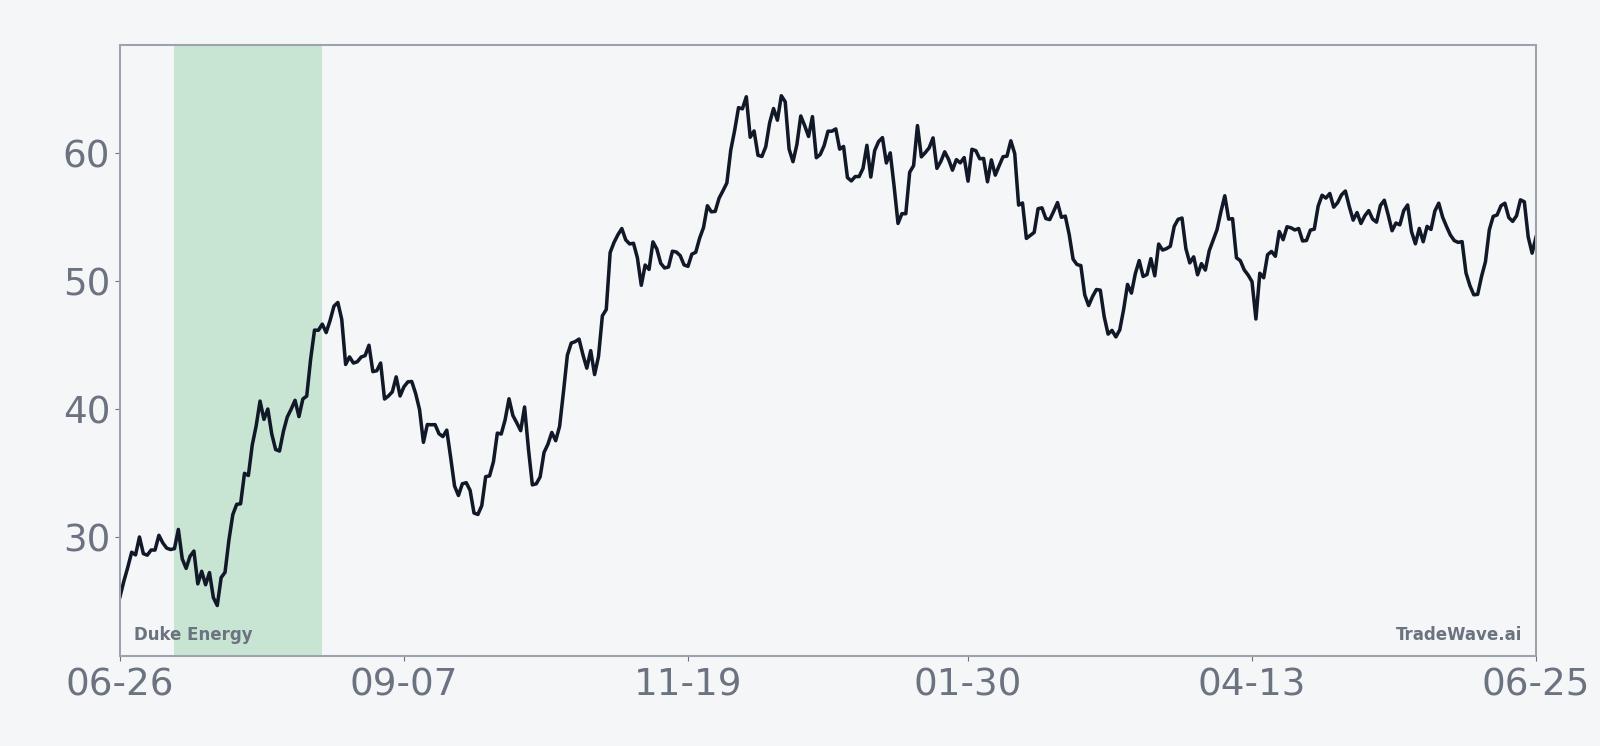
The trend chart suggests the typical DUK seasonal pattern in this window is a grind higher rather than a straight-line spike. Gains tend to build gradually through the middle of the window, with less evidence of a single “all-or-nothing” day driving the outcome.
The cumulative return profile across cycles reinforces that message. Add it up and the 56% cumulative gain across these ten midterm-year windows reflects consistent, moderate advances rather than a handful of outsized wins masking frequent losses.
History does not guarantee future results; adverse excursions can be large even in winning windows, and a 100% hit rate over 10 samples does not eliminate the risk of a break in the pattern.
Why does Duke Energy (DUK) follow this seasonal pattern?
This midterm-year summer pattern may reflect a mix of rate-case timing, capital spending updates and sector rotation into defensive yield as Washington’s policy agenda stalls mid-cycle. Analysts have pointed to utilities’ tendency to firm up after early-year volatility once regulators and investors have clearer visibility on capex and allowed returns.[1] For Duke Energy, a heavy grid investment pipeline and periodic asset sales can cluster news and positioning around this part of the calendar, reinforcing the historical seasonal trend.
What is driving Duke Energy (DUK) today?
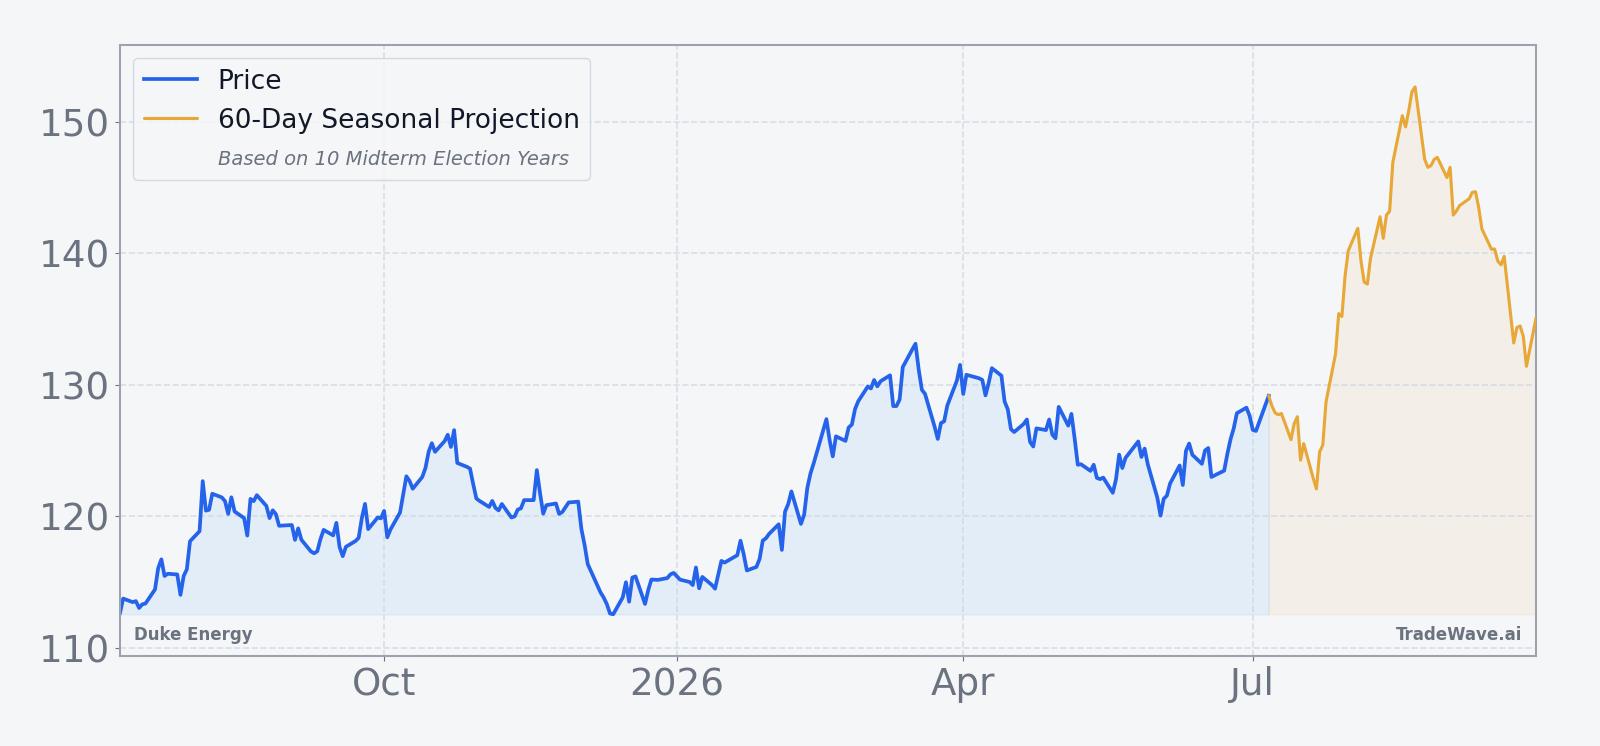
Duke Energy shares closed at $127.11 on Friday, up 0.58 on the day, leaving the stock about 3.8% below its 52-week high of $132.20 and roughly 18% above its 52-week low of $107.69. The one-month return sits at 1.4%, with trading volume near its 20-day average of about 3.7 million shares and the price modestly above the 50-day moving average of $124.14, a setup that keeps DUK in a gentle uptrend rather than a momentum surge.
In August 2025, Duke boosted its five-year capital expenditure plan to $87 billion to meet rising power demand, while also agreeing to sell a Florida utility stake to Brookfield for about $6 billion to help fund that build-out and reduce holding company debt.[1] The company signaled that updated capital plans for 2026 to 2030, with projected spending of $95 billion to $105 billion and a 30% to 50% equity funding mix, would arrive in February 2026, setting up a multi-year debate over balance-sheet leverage, rate cases and dilution risk.[1]
That capex push sits against a macro backdrop of record U.S. power consumption forecasts for 2025 and 2026, driven by data centers, electrification and population growth, which has encouraged utilities to accelerate investment in transmission lines and generation capacity.[1] For a regulated giant like Duke, the tug-of-war between higher earnings from a larger rate base and the financing cost of that build-out is likely to remain the main fundamental driver as the stock approaches its historically strong midterm-year seasonal window.
The chart below situates the latest move in its recent multi-month context and overlays a short-term seasonal projection.
What should traders watch as this seasonal window approaches?
First, the calendar: the 39-day midterm-year window begins on Jul 10, 2026, so any sharp move into that date will shape how stretched or under-owned DUK looks as the historical pattern kicks in. A flat or modestly higher drift into early July would be more in line with prior cycles than a sudden breakout to fresh highs.
Second, levels matter. On the upside, traders will be watching whether DUK can sustain a move through the 52-week high near $132, while on the downside, the 50-day moving average around $124 and the low $120s zone are likely to be key reference points if volatility picks up inside the window. How the stock behaves around those bands will show whether this midterm-year seasonal trend is reinforcing the existing uptrend or meeting resistance from valuation and funding concerns.
Third, the policy and capex calendar will stay in focus. Any new detail on Duke’s 2026 to 2030 capital plan, rate-case progress or the phased sale of its Florida utility stake to Brookfield could either amplify or blunt the historical seasonal bias, especially if regulators or investors push back on the scale or funding mix of the grid build-out.[1] Traders will be looking to see whether strong demand and supportive rate decisions keep the utilities sector’s seasonal outlook aligned with the bullish DUK pattern, or whether financing costs and regulatory friction start to dominate the narrative.
Sources
About this seasonal analysis
Seasonal pattern data is sourced from TradeWave.ai, which analyzes historical price behavior across annual calendar windows going back up to 30 years. Read the full data methodology or the book The 100-Year Pattern by Afshin Moshrefi (2026 edition). Past performance of seasonal patterns does not guarantee future results. This article is for informational purposes only and does not constitute investment advice.