IBM Nears Seasonal Window After 8 Straight Midterm Summer Rallies
IBM is nearing a 44-day midterm-year seasonal window that has never produced a loss, just weeks after a sharp June spike and heavy options activity.
Price as of Jun 25, 2026: $258.27 (last close).

What is the seasonal pattern for IBM (IBM)?
IBM has risen in 8 of 8 midterm-year summer windows starting around Jul 5, with an average gain of 6.58% in winning years.
- 8 for 8 in this window, averaging 6.58% gains in winning years across the last 8 midterm election cycles.
- The upcoming 44-day trading window begins Jul 5, 2026 and has historically favored long positions in IBM.
- Percent Profitable is 100%, with 8 winners and 0 losers in the historical sample.
- Average profit across all years is 7%, with a TradeWave Ratio of 1.3 and a Sharpe ratio of 1.1, pointing to a solid risk-adjusted profile.
- Intraperiod swings have been meaningful, with some years showing double-digit peak gains but also notable drawdowns before finishing higher.
- This IBM seasonal trend lines up with the midterm-to-pre-election transition, a phase when policy clarity and enterprise IT budgets often improve.
According to historical data from TradeWave.ai, this midterm-year summer stretch has behaved very differently from an average month on the calendar for IBM. The next section walks through how that pattern has played out and where the risks have clustered in prior cycles.
How has IBM (IBM) traded in past midterm-year summer windows?
IBM has risen in 8 of the last 8 midterm election years during the 44 calendar days starting Jul 5, averaging 6.58% gains for long positions. The stock finished Friday at 258.27, about 22.3% below its 52-week high of 332.46 and well above the 52-week low of 212.34. Options desks have flagged heavy call buying and nearly 200,000 contracts trading around late-May headlines, a sign that speculative positioning has already built up ahead of the next leg in the move.[10] Put together, a clean bullish seasonal window, a pullback from the highs, and aggressive options flow create a setup that traders will be watching closely into July.
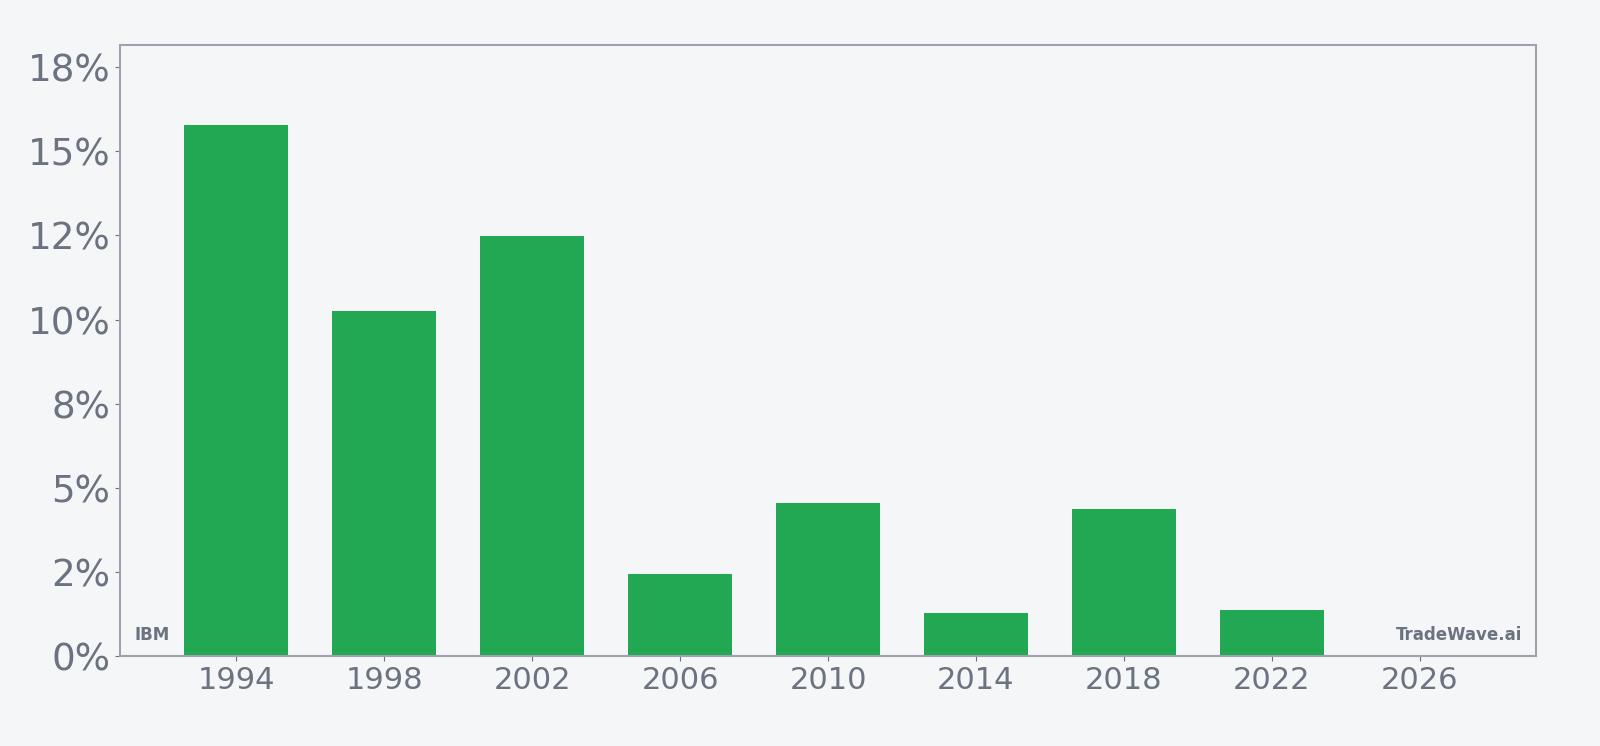
Grouping the data by the presidential election cycle matters here because IBM’s strongest seasonal stretch in this study shows up specifically in midterm election years, not in a generic July or August average. Midterm years often bring a clearer policy path and more predictable federal spending, which can stabilize enterprise IT budgets and support large-cap tech and software names like IBM.
Historically, this 44-day IBM trading window has been a straightforward long setup. Percent Profitable is 100%, with 8 winners and 0 losers, and the average profit across all years clocks in at 7%. The median gain of 4.47% suggests that while a couple of years delivered double-digit returns, the typical outcome has still been a solid mid-single-digit move rather than a one-off outlier.
The per-year table shows how that plays out. The strongest year in the sample was 1994, when IBM gained 15.79% in the window, with a best intraperiod run-up of 17.13% and a worst drawdown of 3.11% from the entry. At the other end of the spectrum, 2014 still finished higher but only by 1.3%, with a modest 4.45% peak gain and a 1.79% pullback at the worst point. Even in 2022, a choppy year for broader markets, IBM added 1.39% in this slice of the calendar while enduring a 9.08% intraperiod drawdown.
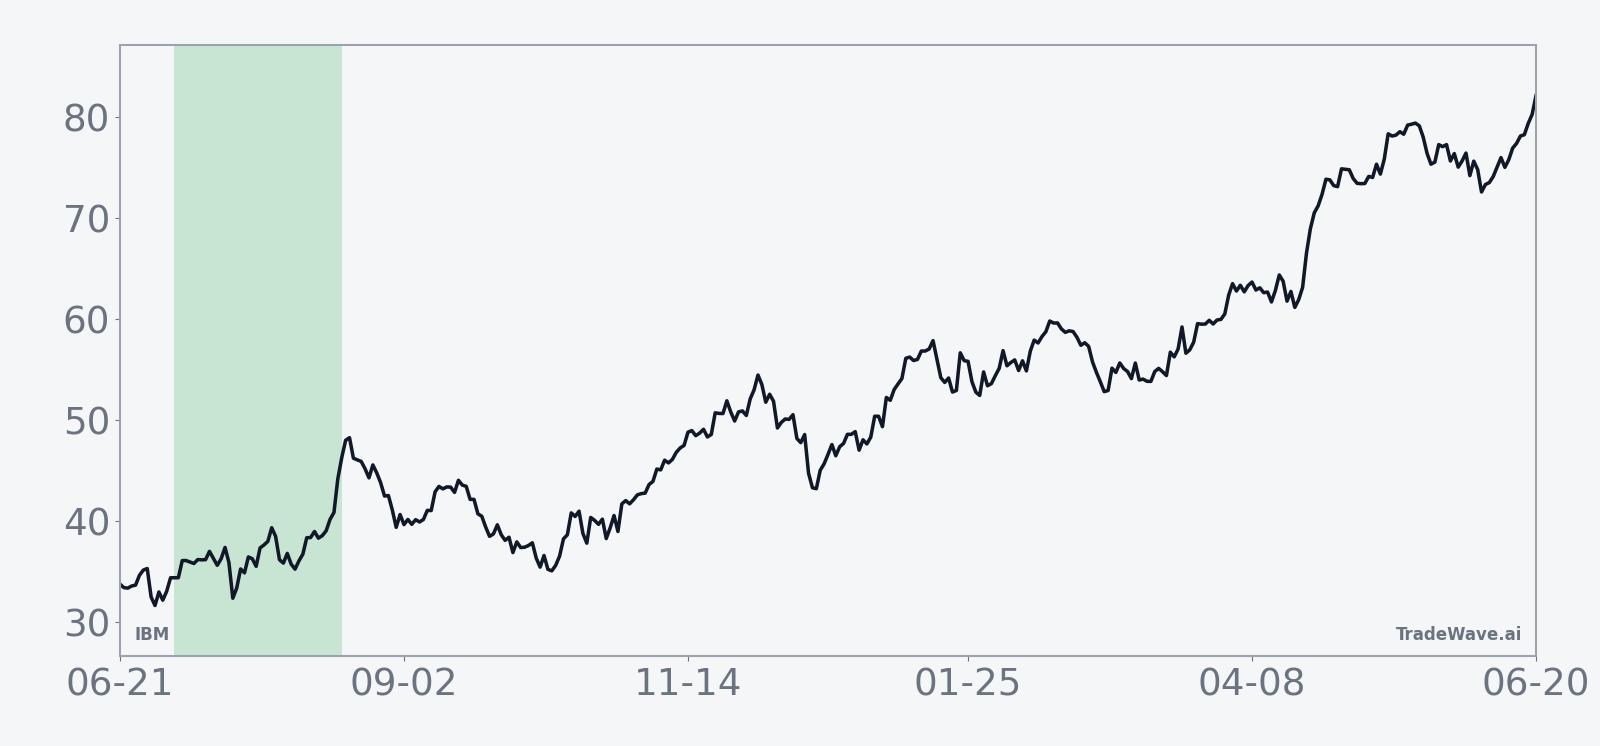
The historical seasonal average trend for this IBM window slopes higher fairly steadily rather than spiking in a single burst. The pattern tends to show early gains that continue to grind upward into the back half of the window, with only brief pauses or shallow pullbacks along the way. That profile fits a “drift higher” regime more than a high-volatility trading range.
A closer look at yearly net returns alongside peak run-ups and worst drawdowns shows how much room IBM has historically had to move inside this window.
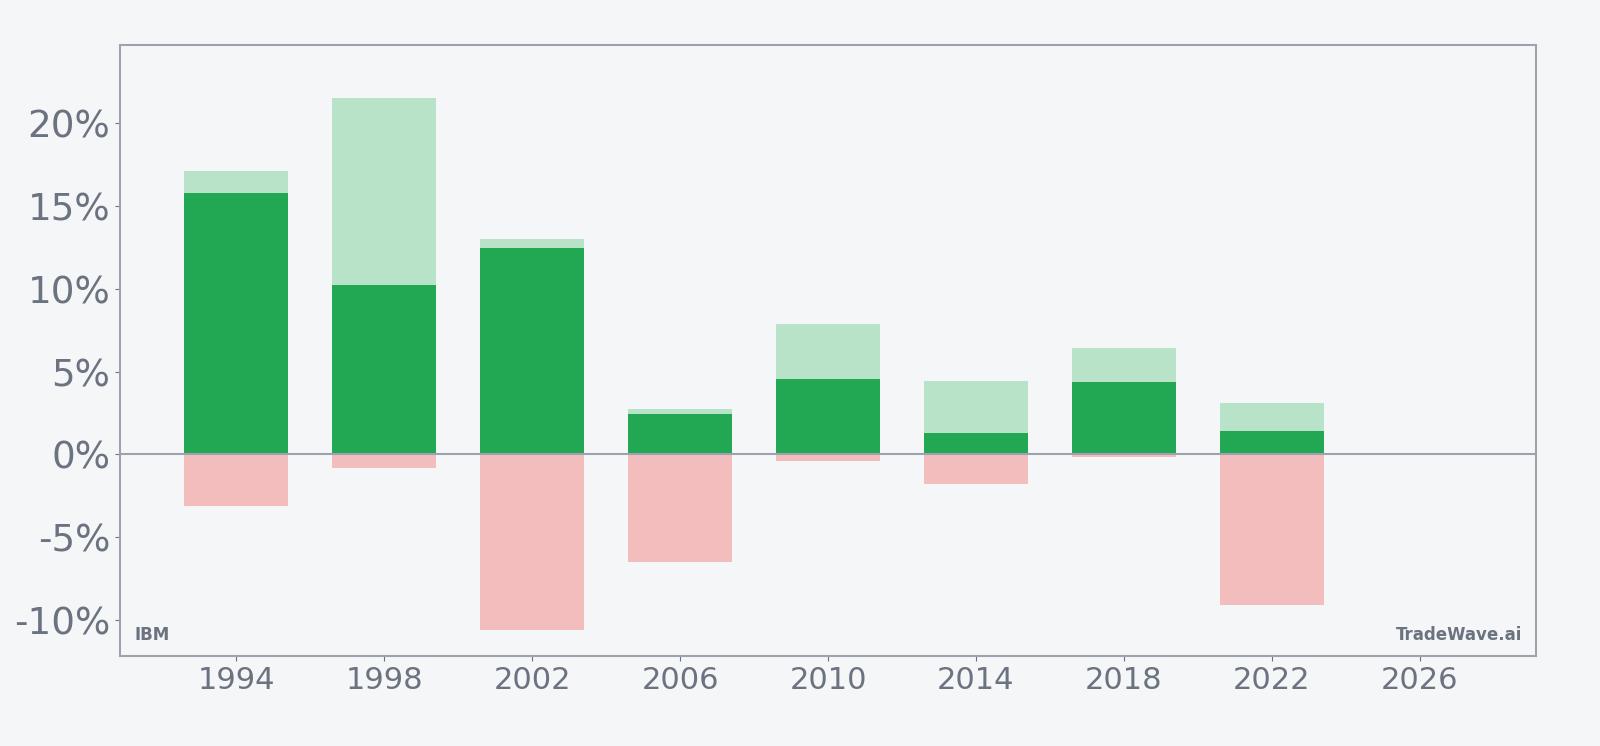
The combined net/MFE/MAE bars show that upside potential has often been larger than the final gains, with several years posting double-digit peak advances before settling back. At the same time, adverse excursions have occasionally been deep, with MAE readings near or above 9% in 2002 and 2022 even though both windows ultimately finished positive. Add it up: this has been a consistently bullish IBM seasonal window, but one where traders have had to sit through real volatility to capture the full move.
History does not guarantee future results; adverse excursions can be large even in winning windows, and past IBM seasonal behavior may not repeat.
Why does IBM (IBM) follow this seasonal pattern?
One likely driver is the way midterm election years line up with corporate and government IT budgeting, which can unlock second-half spending after policy and funding questions clear. Analysts have also pointed to sector rotation into more defensive, cash-generative tech names like IBM when macro uncertainty peaks in mid-cycle years, supporting this specific midyear window.[11] The pattern may also reflect institutional portfolio rebalancing around midyear, as managers lean into enterprise software and hybrid cloud exposure ahead of the typically stronger pre-election year.
What is driving IBM (IBM) today?
IBM closed Friday at 258.27, down 1.8% on the day, after trading between 256.00 and 268.76 on volume of about 8.4 million shares. The stock sits roughly 22.3% below its 52-week high of 332.46 and about 21.6% above its 52-week low of 212.34, with the 50-day moving average near 251.21 and 20-day average volume around 11.9 million shares. On Jun 1, 2026, IBM shares surged about 15% in a single session after a political video resurfaced and a bullish Barclays forecast highlighted quantum and software upside, a move that came with a notable spike in trading activity and options volume.[9][10] That burst followed a solid but not spectacular Q1 2026 earnings report in April, where IBM beat on revenue and EPS but kept its full-year outlook steady, leaving some investors debating how much of the AI and hybrid cloud story is already in the price.[3][7]
Macro and policy catalysts are also in play as this midterm election year unfolds. IBM is positioned at the intersection of enterprise AI adoption and government-backed quantum computing, including a roughly $1 billion U.S. Commerce Department grant that investors see as a multi-year tailwind for its hardware and research footprint.[8] At the same time, the Anthropic partnership and WatsonX platform keep IBM tied to the broader AI spending cycle, which has been a key narrative for software and hybrid cloud peers since late 2025.[5] Against that backdrop, the upcoming seasonal window is less about a sleepy summer drift and more about how a historically strong IBM trading window interacts with a crowded AI and quantum thesis.
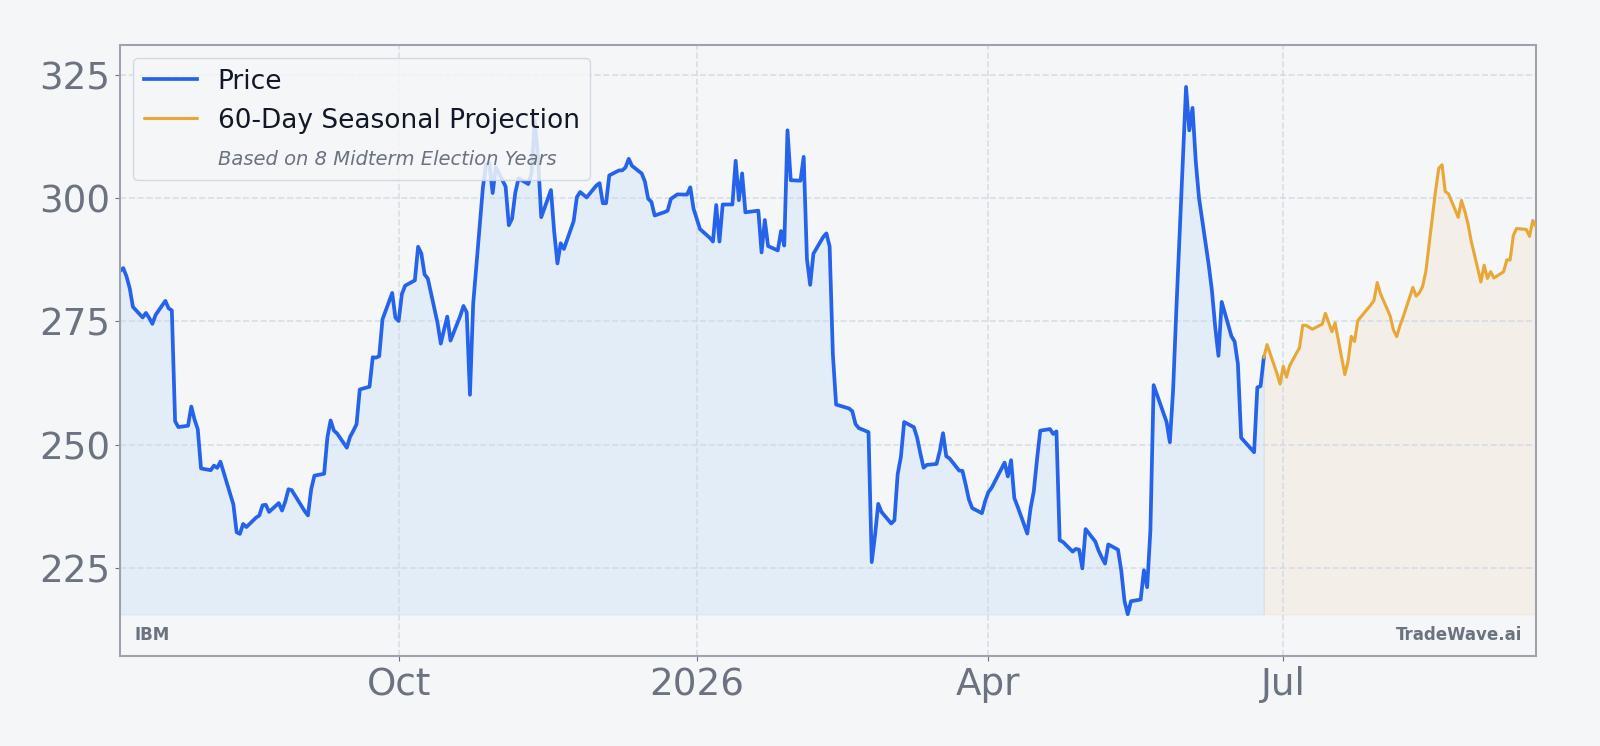
The chart below situates the latest pullback and June spike within IBM’s past year of trading, alongside a 60-day seasonal projection.
What should traders watch in IBM (IBM) during this window?
Into and through the Jul 5 start date, the first watchpoint is whether IBM respects the 250 to 260 area that roughly brackets the 50-day moving average and the recent post-spike consolidation. A firm base there would echo prior midterm-year windows where the stock absorbed early volatility before grinding higher. A decisive break below that zone, especially if accompanied by MAE-style drawdowns similar to 2002 or 2022, would signal that this cycle may be testing the limits of the historical pattern.
Second, traders will be tracking options flow and volume around any new AI, quantum, or policy headlines. The late-May and early-June burst in call buying and contract volume showed how quickly positioning can build when IBM is in the news, and whether that speculative interest persists or fades will shape how the seasonal window plays out.[9][10] Sustained heavy call activity and strong volume on up days would rhyme with prior strong years in the sample, while a sharp drop-off in activity could leave the stock more vulnerable to pullbacks even inside a historically bullish stretch.
Finally, the policy calendar matters. As the midterm election year moves toward its back half and investors start to look ahead to the pre-election year, any clarity on federal tech spending, AI regulation, or additional quantum funding could reinforce IBM’s role as a defensive AI and infrastructure play. If IBM behaves in line with its historical seasonality, strength during this 44-day window would support the idea that large-cap enterprise tech can still lead into the pre-election year. A clear divergence, especially if it comes with deeper-than-usual drawdowns, would be an early sign that this midterm cycle is breaking from the usual script.
Sources
- CNBC, "IBM is trying to rebound after results disappointed initially. What analysts and investors are saying," Oct 23, 2025
- MarketWatch, "IBM’s stock is sliding. Here’s why these analysts see an opportunity to buy," Jul 24, 2025
- Yahoo Finance (GuruFocus), "IBM Stock Tumbles. Solid Quarter Can't Offset Tepid Forecast," Apr 23, 2026
- CNBC, "IBM tops third-quarter estimates and lifts guidance, but stock drops," Oct 22, 2025
- Forbes, "What’s Happening With IBM Stock?," Oct 7, 2025
- MarketWatch, "Why is IBM’s stock down after an earnings beat? Here’s one quibble," Jul 23, 2025
- Barron's, "IBM Earnings Beat Estimates. The Stock Is Still Falling," Apr 22, 2026
- Yahoo Finance, "IBM shares surge 15% after Trump video resurfaces," Jun 1, 2026
- Business Insider, "IBM stock shoots higher after bullish Barclays forecast hits back at SaaSpocalypse fears," Jun 1, 2026
- Forbes, "IBM Stock Isn't Dying. It's On Sale," Feb 24, 2026
About this seasonal analysis
Seasonal pattern data is sourced from TradeWave.ai, which analyzes historical price behavior across annual calendar windows going back up to 30 years. Read the full data methodology or the book The 100-Year Pattern by Afshin Moshrefi (2026 edition). Past performance of seasonal patterns does not guarantee future results. This article is for informational purposes only and does not constitute investment advice.