Brown & Brown (BRO) Rallies Off Lows as July Midterm Window With 100% Win Rate Nears
Brown & Brown is heading toward a midterm-year summer stretch that has never been negative in the last 10 cycles, even as shares trade well below their 52-week high.

What is the seasonal pattern for Brown & Brown (BRO)?
Brown & Brown has risen in 10 of 10 midterm-year summer windows during this 47-day pattern, with an average gain of 5.68% in winning years.
- 10 for 10 in this window, with Brown & Brown averaging 5.68% gains in winning years across the last 10 midterm election cycles.
- The upcoming 47-day window begins Jul 3, 2026 and has historically been a bullish seasonal stretch for BRO in midterm election years.
- Percent Profitable is 100%, with 10 winners and 0 losers in the historical sample for this insurance broker stock pattern analysis.
- Average profit of 5.68% in winning years compares with a cumulative 72% gain across all 10 midterm-year windows.
- Intraperiod swings have been meaningful, with some years showing double-digit peak run-ups and notable drawdowns before finishing higher.
- The BRO seasonal trend clusters gains through the heart of the window, suggesting a historically favorable summer trading window for this sector name.
According to historical data from TradeWave.ai, this midterm-year summer stretch has behaved very differently from an average month on the calendar for Brown & Brown. The next section walks through how that pattern has played out and what it means for the upcoming window.
How has Brown & Brown (BRO) traded in past midterm-year summer windows?
Brown & Brown has risen in all 10 of the last midterm election years during this 47-day summer window, averaging a 5.68% gain for long positions. The stock last traded at about $62, leaving it roughly 43.2% below its 52-week high of $109.14 and about 15.4% above its 52-week low of $53.81. That combination of a clean 10-for-10 historical record and a stock sitting in the middle of its range gives this upcoming Brown & Brown trading window unusual weight for investors watching the insurance sector seasonal outlook.
The pattern is built around the presidential election cycle, focusing on the midterm election year rather than a simple calendar average. Grouping by the election cycle matters because policy risk, regulation and fiscal stance often shift in predictable ways around midterms, and sector stocks like Brown & Brown can feel those shifts in premium pricing, demand for coverage and capital markets activity.
This seasonal window begins on Jul 3, 2026 and spans 47 trading days. Historically, during this period in midterm election years, Brown & Brown has shown a strong bullish tendency for long trades, with every single instance finishing higher than the entry price. The trade direction for this pattern is explicitly long, so the historical rallies are favorable outcomes for the setup, while any hypothetical down year would have been a losing season for the pattern.
Across the 10 midterm-year samples, Percent Profitable sits at 100%, with 10 winners and 0 losers. Average profit in winning years is 5.68%, and because there are no losing years in the sample, the all-years average lines up closely with that figure. Add it up and the cumulative return across these ten 47-day slices is 72%, a striking record for a single recurring summer window in an otherwise steady insurance stock.
The per-year table shows how that has played out in individual cycles. The weakest outcome came in 1990, when BRO gained just 0.92% over the window, while the strongest was 2022, when the stock rallied 13.38% between entry and exit. In between, years like 1994 and 2018 delivered solid mid-single to high-single-digit gains, reinforcing the sense that this BRO seasonal trend has been consistently positive rather than dependent on one outlier year.
Intraperiod volatility has still mattered. In 2002, for example, Brown & Brown finished the window up 1.77%, but at one point it was down as much as 20.53% from the entry before recovering. That worst drawdown is the maximum adverse excursion, or MAE, the deepest intraperiod dip from the starting price. On the upside, several years saw maximum favorable excursions, or MFE, in the low to mid-teens, such as 20.01% in 1986 and 14.42% in 2022, showing how far the stock has sometimes run before the window closed.
The TradeWave Ratio (TWR) for this pattern is 2.13, which describes how far price typically travels in the trade direction within the window, independent of the final close. A Sharpe ratio of 1.27 indicates that, based on end-of-window outcomes, the risk-adjusted average return has been attractive for a short seasonal trade. Together, those metrics suggest that while the path can be bumpy, the payoff for staying with the long direction through the full 47 days has historically been favorable.
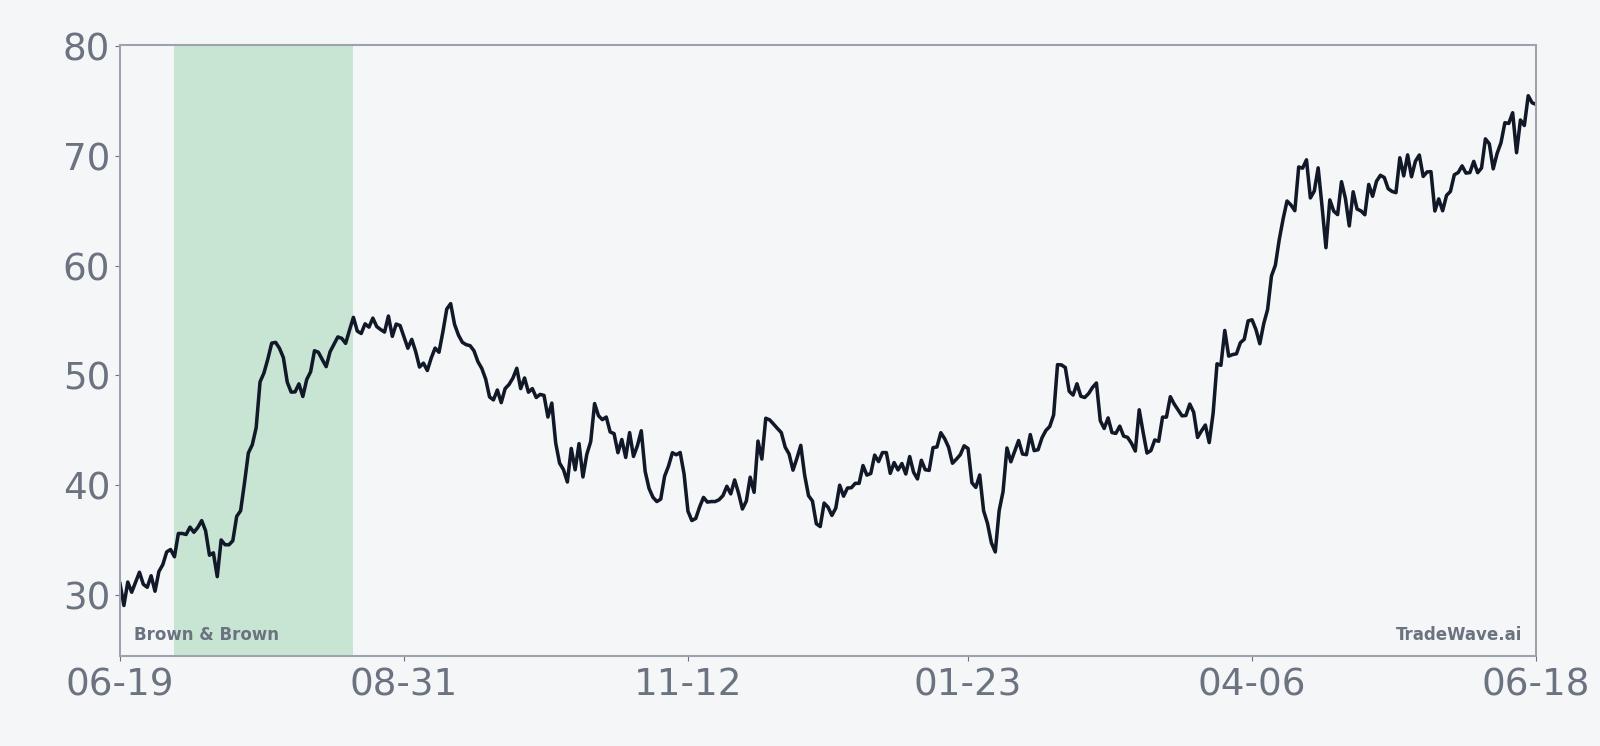
Looking at the historical seasonal average, the typical path shows gains building gradually rather than in a single burst. The trend line tends to grind higher through the middle of the window, with some choppiness early on and a tendency for returns to consolidate toward the end. That profile fits a stock pattern analysis where institutional investors may be adding exposure over several weeks rather than chasing a one-day catalyst.
The cumulative return chart for this pattern reinforces that story. Instead of a jagged, mean-reverting line, the cumulative curve slopes steadily higher across the ten midterm-year samples, with only modest pauses. The clustering of positive outcomes suggests that this is not just one lucky decade but a recurring seasonal behavior tied to the midterm-year backdrop.
Year-by-year bars that combine net returns with maximum favorable and adverse excursions show the trade-off clearly. In most years, the peak run-up within the window has been meaningfully larger than the final net gain, which means traders who tried to time exits perfectly needed to sit through some giveback. At the same time, the MAE bars remind investors that even in a 10-for-10 winning window, intraperiod drawdowns of 4% to more than 20% have occurred, underscoring the need to size positions with volatility in mind.
Ten for ten with a 5.68% average gain is a rare record for any stock’s midterm-year summer window, and that is the seasonal backdrop Brown & Brown carries into July.
Why does Brown & Brown (BRO) follow this seasonal pattern?
One likely driver is the way insurance demand and pricing intersect with the midyear corporate calendar, as companies renew policies and adjust coverage ahead of the fall budgeting season. Analysts have also pointed to institutional portfolio repositioning around midterm-year policy debates, which can favor defensive financials like insurance brokers during this stretch. The pattern may reflect a mix of those flows, with Brown & Brown benefiting as investors seek steady cash-flow names while Washington’s midterm agenda comes into focus.
Yearly net and peak moves highlight upside persistence amid typical drawdowns.
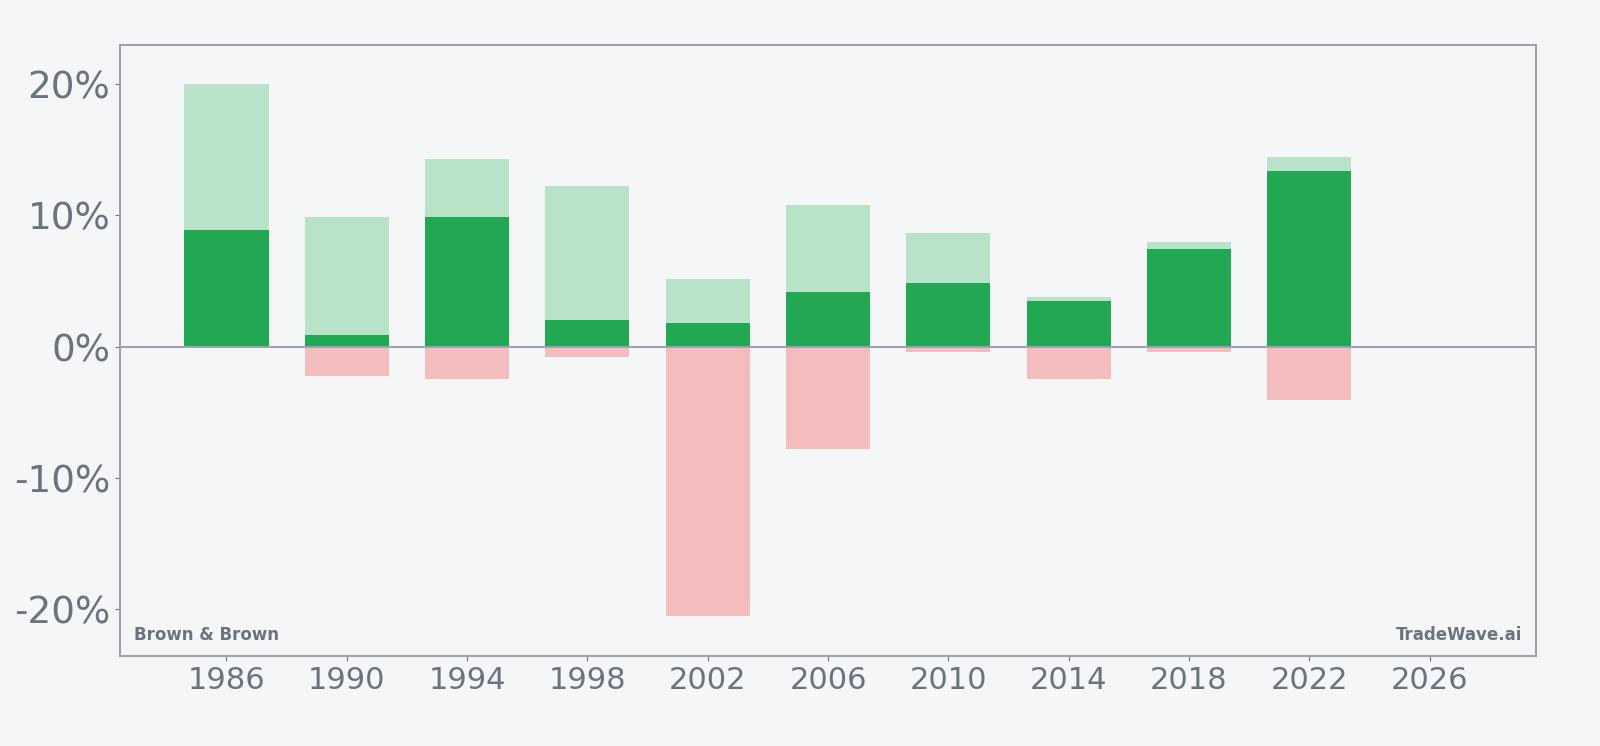
History does not guarantee future results; adverse excursions (MAE) can be large even in winning windows.
What is driving Brown & Brown (BRO) today?
Brown & Brown shares closed at $62.10 on Jun 24, up 2.8% on the day, extending a roughly 8.44% gain over the past month as the stock rebounds from its 52-week low near $53.81. That still leaves BRO trading well below its 52-week high around $109.14, with the 50-day moving average near $59.82 and 20-day average volume of about 3.32 million shares, a setup that looks more like a rebuilding phase than a late-stage melt-up.
The chart below situates the latest move in its recent multi-month context alongside a 60-day seasonal projection.
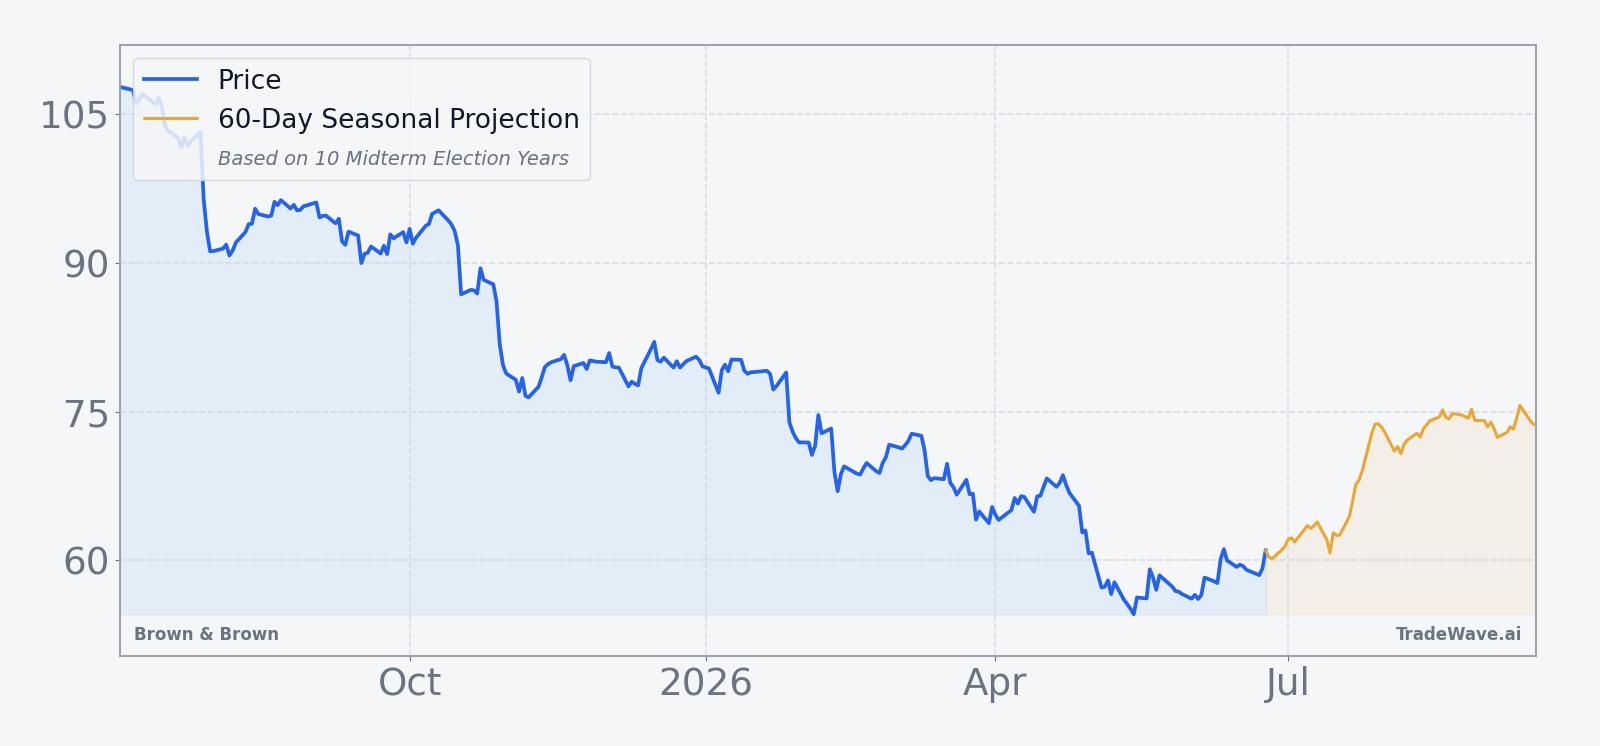
With no near-term earnings date or major company-specific catalysts flagged in the data, the near-term story for BRO is more about positioning than headlines. The stock has been climbing back above its 50-day moving average on rising volume, which suggests investors are gradually rebuilding exposure ahead of the historically strong July–August seasonal window. For traders who track historical seasonality, the key question is whether that quiet accumulation continues as the calendar flips into the midterm-year summer stretch that has so often rewarded long exposure.
Sources
About this seasonal analysis
Seasonal pattern data is sourced from TradeWave.ai, which analyzes historical price behavior across annual calendar windows going back up to 30 years. Read the full data methodology or the book The 100-Year Pattern by Afshin Moshrefi (2026 edition). Past performance of seasonal patterns does not guarantee future results. This article is for informational purposes only and does not constitute investment advice.