Tyson Foods (TSN) Faces Record-High Beef Costs as 10-for-10 Midterm Summer Slide Nears
Tyson Foods is heading toward a historically weak 45-day midterm-year summer stretch just as the stock grinds higher for 2026 and chicken strength offsets beef pressure.

What is the seasonal pattern for Tyson Foods (TSN)?
Tyson Foods has fallen in 10 of 10 midterm-year summer windows during this 45-day stretch, with an average gain of 7.96% in winning years for the short side.
- 10 for 10 in this window for short trades, with Tyson shares declining every midterm-year summer in the sample.
- Window runs 45 trading days from Jul 8, 2026, covering the heart of the midterm-year summer for TSN.
- Percent Profitable is 100%, with 10 winners and 0 losers for the short direction across the last 10 midterm election years.
- Avg Profit for the short side is 7.96%, with a cumulative return of 111% across all 10 windows.
- TradeWave Ratio of 1.72 suggests price has typically moved meaningfully in the trade direction within the window before rebasing.
- Historical maximum adverse excursions have at times been deep, so even winning short windows have seen sharp countertrend rallies along the way.
According to historical data from TradeWave.ai, this upcoming midterm-year summer stretch has behaved very differently from an average month on the calendar for Tyson Foods, and the next iteration is about to open again.
How has Tyson Foods (TSN) traded in past midterm-year summer windows?
Tyson Foods has fallen in every one of the last 10 midterm election years during this 45-day summer window, with shorts averaging a 7.96% gain as the stock drifted lower. Today the shares closed at 57.81, up 0.7% on the session and roughly 15.4% below their 52-week high of 68.32, after climbing about 5% so far in 2026.[2] That mix of modest year-to-date strength and a clean 10-for-10 bearish seasonal record gives this specific July-to-August stretch unusual weight on the trading calendar.
Because this pattern is grouped by the presidential election cycle, it only looks at the last 10 midterm election years, not 10 consecutive calendar years. That matters for a stock like Tyson Foods, where policy, regulation and consumer-income trends around midterms can shape meat demand, input costs and margin expectations in a way that repeats from cycle to cycle more than from one random year to the next.
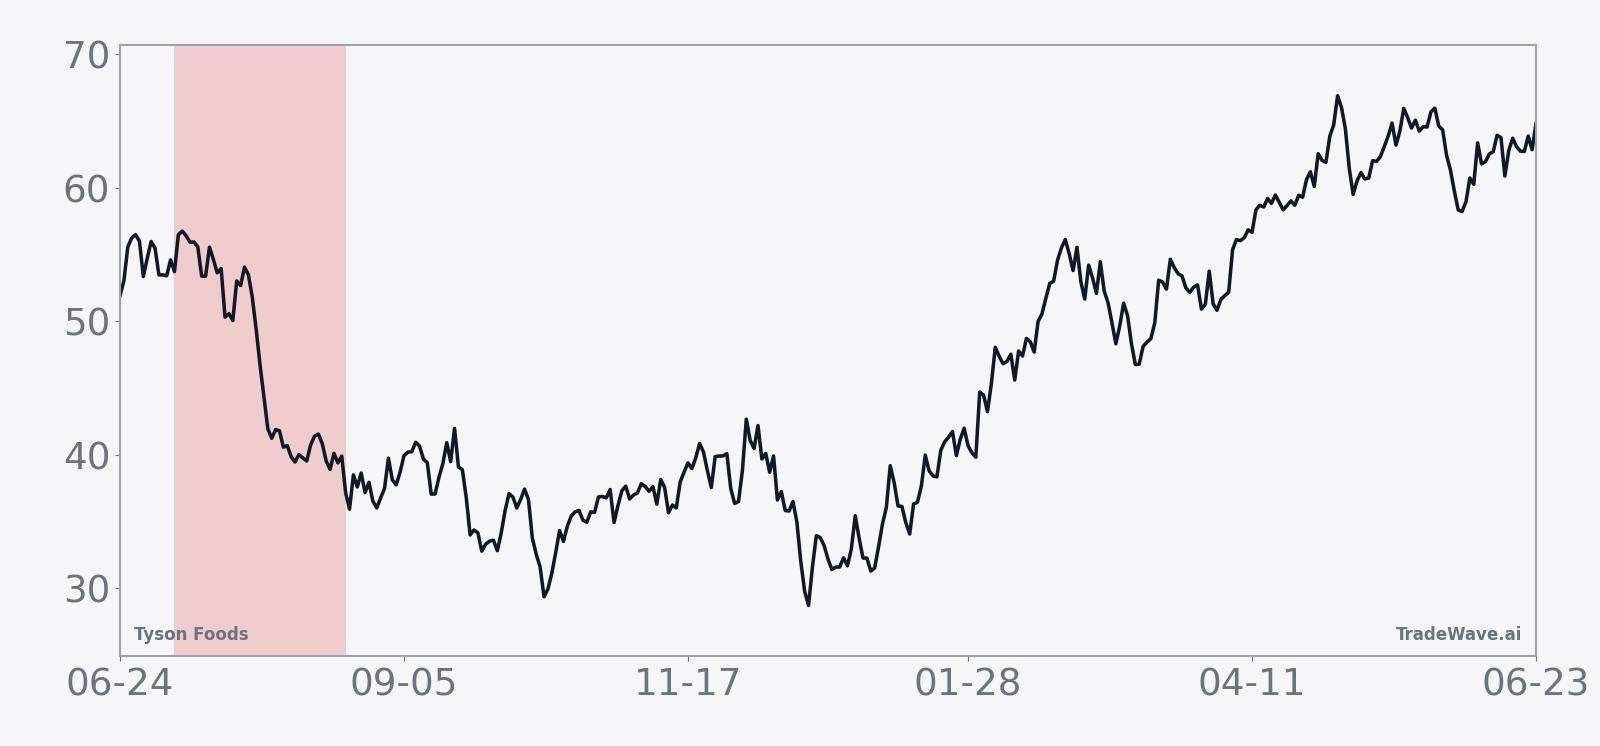
The historical seasonal trend line for this window slopes steadily lower, with most of the average decline accruing in the middle third of the 45-day span. Early days often show a brief sideways or slightly higher drift before the typical mid-window softening, then a slower grind into the close of the pattern. For a short setup, that profile has meant more favorable entries near the start and a tendency for the bulk of the move to materialize before the final week.
Across individual years, the strongest short outcome came in 2002, when TSN dropped 20.34% during the window, while the mildest decline was 0.79% in 1994. In several cycles, such as 1990 and 2018, the stock saw double-digit percentage losses that rewarded patience for traders positioned with the seasonal trend. Even the smaller moves, like the 3.55% decline in 2010, still finished in the short direction, preserving the 10-for-10 record.
Intraperiod swings have been meaningful. Maximum favorable excursions, the best point-to-peak moves in the short direction, reached as much as 25.54% in 2002 and 19.92% in 1990, showing how far TSN has sometimes trended lower before bouncing. At the same time, maximum adverse excursions, the worst drawdowns against the short, have run as deep as 17.5% in 1986 and 14.77% in 2018, underscoring that sharp countertrend rallies have been part of the playbook even in ultimately profitable short windows.
The yearly bar chart with net, best-case and worst-case moves shows how consistently this window has leaned bearish while still delivering sizable swings in both directions.
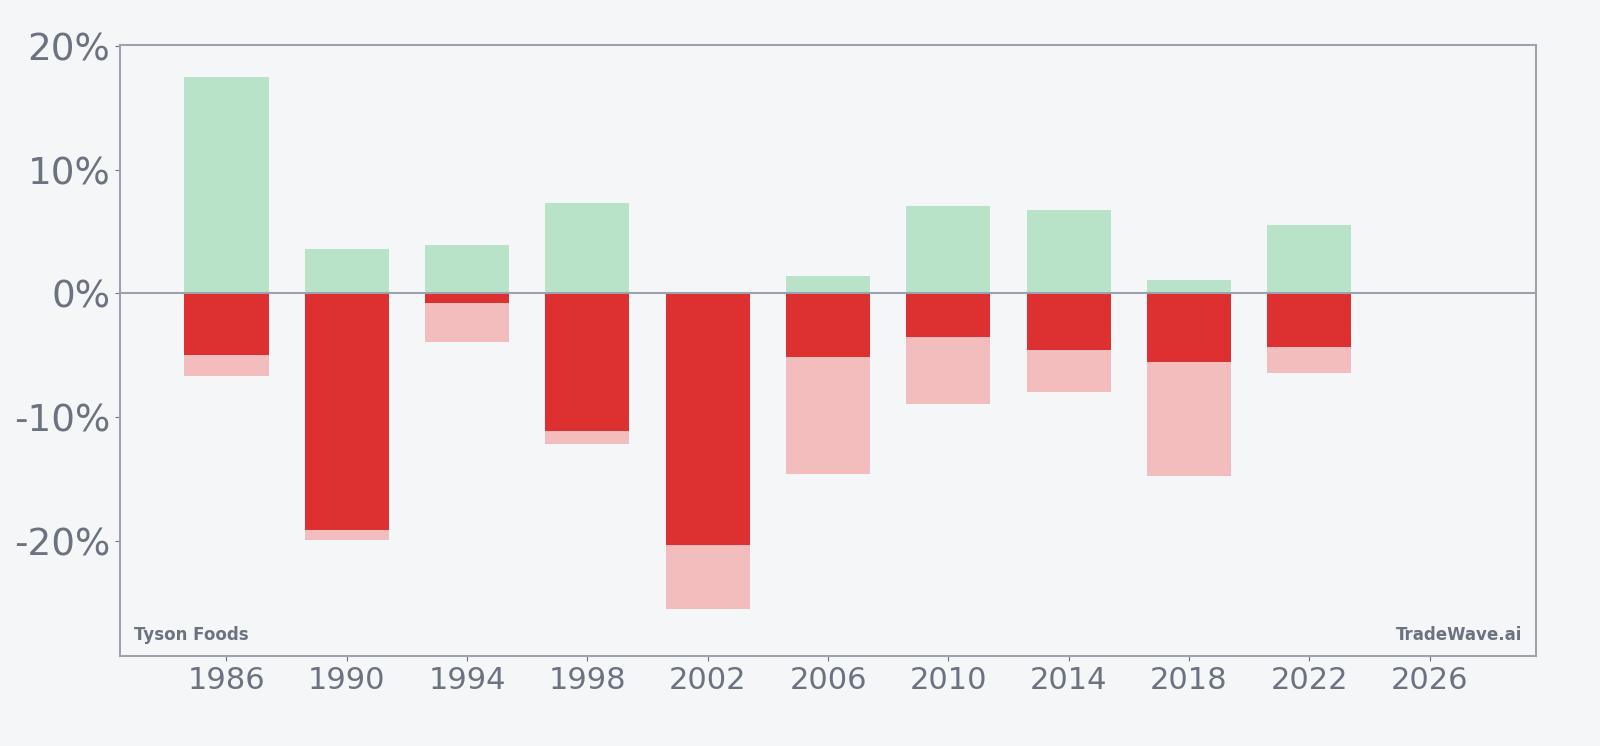
The stacked net, maximum favorable and maximum adverse bars cluster on the negative side for final outcomes, but the height of both the favorable and adverse components highlights a high-variance environment. Shorts have historically been rewarded, yet they have had to sit through sizable squeezes in several years before the pattern reasserted itself. Add it up: 10 straight midterm-year summers have finished in the short direction, with a cumulative 111% gain for the pattern, but the path has rarely been smooth.
History does not guarantee future results, and even in windows where every past year has favored the short side, adverse excursions can be large before the final outcome is known.
Why does Tyson Foods (TSN) follow this seasonal pattern?
One likely driver is the way midterm-year summers line up with Tyson’s fiscal calendar, when investors digest spring earnings and updated guidance while watching feed costs and cattle supplies into the back half of the year.[2] Analysts have also pointed to shifting protein demand and policy uncertainty around food prices and trade, which can weigh on sentiment for meat producers during this part of the cycle.[2] The pattern may reflect a recurring period when expectations reset lower after early-year optimism, especially if beef headwinds or cost pressures look set to persist into the pre-election year.
What is driving Tyson Foods (TSN) today?
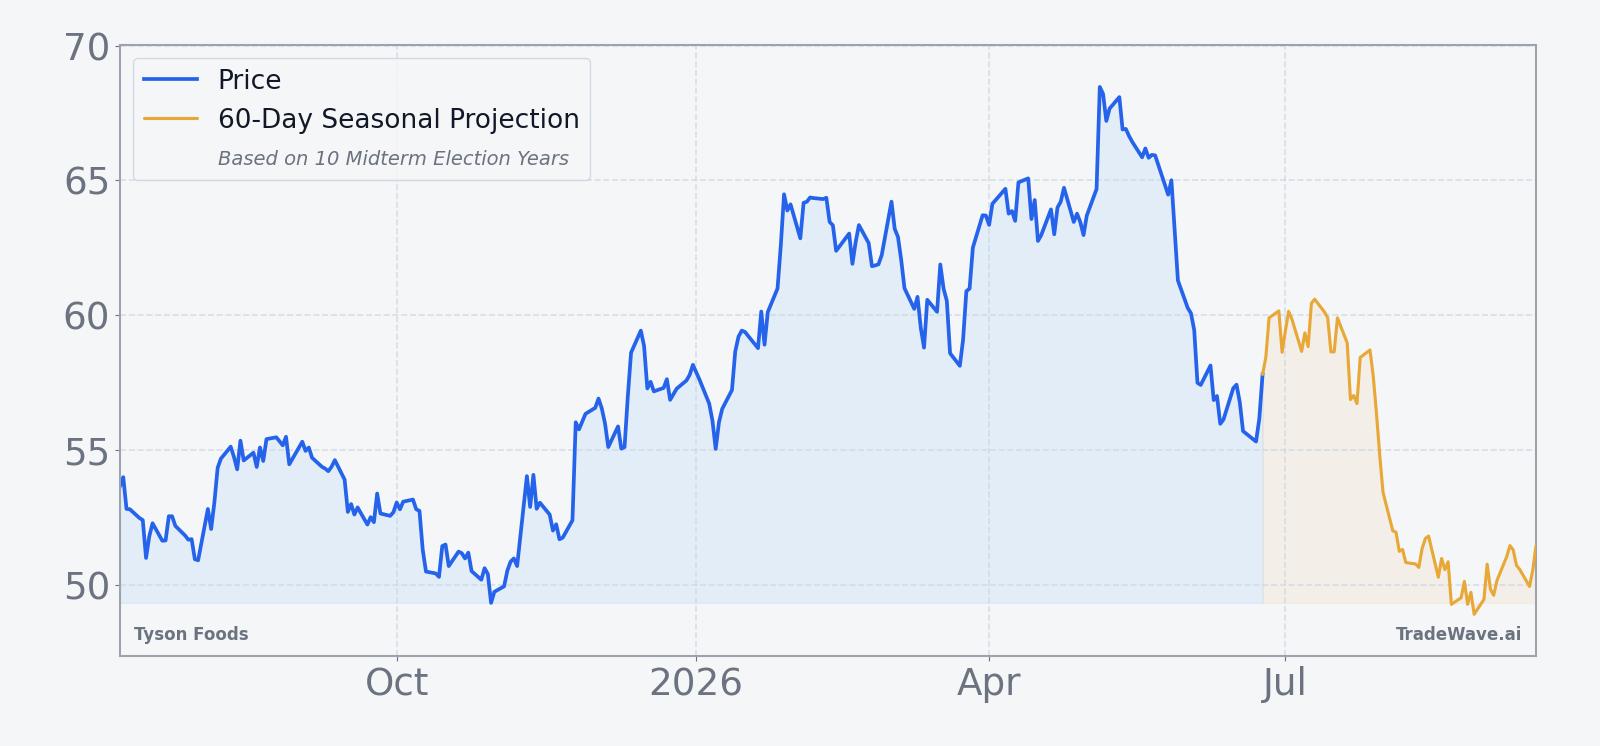
Tyson Foods closed Thursday at 57.81, up 0.39 on the day, leaving the stock about 15.4% below its 52-week high and modestly above its 52-week low of 48.07 as it works through a choppy 2026 tape.[2] Shares are up roughly 5% year to date, helped by a stronger chicken business that has offset ongoing beef pressure and kept investors engaged even as the broader consumer staples group has lagged.[2] In early May, Tyson reported adjusted earnings per share of $0.87 on $13.65 billion in sales for its fiscal second quarter, topping Wall Street estimates and prompting management to raise its adjusted operating income forecast to a range of $2.2 billion to $2.4 billion for the year.[2]
That earnings beat leaned heavily on resilient chicken demand, which has benefited from consumers trading down from high-priced beef into more affordable proteins.[2] Reuters reported that Tyson also lifted its annual adjusted operating income guidance for the chicken segment to between $1.9 billion and $2.05 billion for fiscal 2026, reinforcing the idea that poultry is doing the heavy lifting while beef margins remain under strain from tight cattle supplies.[2] In November 2025, Reuters and Forbes both highlighted how historically low U.S. cattle herds and record beef prices were pressuring Tyson’s beef business, even as chicken sales surged, a backdrop that still shapes investor thinking about segment mix and earnings quality in 2026.[4][5][10]
Macro demand trends remain supportive. Mizuho, which initiated coverage with an outperform rating and a $72 price target in March 2026, cited structural growth in global protein consumption and argued that rising meat demand should benefit Tyson over the long run despite shifting food culture and the rise of GLP-1 weight-loss drugs.[1] The OECD has projected global meat consumption to increase by tens of millions of tonnes over the next decade, a tailwind that helps frame Tyson as a secular growth story even as near-term margins swing with feed costs and cattle availability.[1] Against that backdrop, the upcoming midterm-year seasonal window stands out as a potential counterweight to the fundamental narrative, especially if investors use summer liquidity to rebalance exposure after a solid first half.
The chart below situates the latest move in its recent multi-month context and overlays the 60-day seasonal projection around the upcoming window.
What should traders watch as this Tyson Foods seasonal window approaches?
First, the calendar. The 45-day window begins on Jul 8 and runs deep into August, overlapping a period when liquidity often thins and earnings headlines can amplify moves. Traders will be watching whether TSN continues to grind higher into the start date or stalls below the 60 level, which has acted as a rough pivot in recent months. A firm bid into early July would set up a sharper contrast with the historical pattern, while early weakness could suggest the seasonal script is starting to play out ahead of schedule.
Second, the policy and macro calendar. Any fresh data on food inflation, consumer spending or trade policy that affects meat exports could influence how closely this midterm-year window tracks its historical path. If beef prices stay elevated and cattle supplies remain tight, investors may keep rewarding Tyson’s chicken strength, but a shift in feed costs or demand could quickly change the earnings narrative.[2][4] How management frames the balance of chicken growth and beef headwinds in any mid-summer updates will matter for whether the stock behaves like prior midterm summers or breaks the streak.
Finally, price behavior inside the window will be the real tell. In past cycles, the most profitable short years have seen TSN roll over decisively in the middle of the window after a brief early drift. If the stock instead holds above recent support levels or pushes back toward the low 60s without the typical mid-window fade, that would be an early sign that this midterm-year pattern may be weakening. Conversely, a familiar sequence of early stability followed by a July or early August slide would line up closely with the 10-for-10 record and keep the TSN seasonal trend front and center for traders focused on the protein sector’s summer playbook.
Sources
- [1] CNBC: Growing demand for meat will boost this stock, Mizuho says (Mar 26, 2026).
- [2] Reuters: Tyson Foods profit beats estimates on strength in chicken business (May 4, 2026).
- [3] Reuters: Tyson Foods raises annual revenue forecast on resilient chicken demand (Aug 4, 2025).
- [4] Reuters: Tyson Foods forecasts annual revenue rise as chicken demand offsets beef woes (Nov 10, 2025).
- [5] Forbes: Tyson warns of plummeting consumer beef purchases as chicken sales soar (Nov 10, 2025).
- [6] The Wall Street Journal: Tyson Foods Raises Revenue Outlook (Aug 4, 2025).
- [10] Reuters: Tyson Foods to close US beef plant as cattle supplies dwindle (Nov 21, 2025).
About this seasonal analysis
Seasonal pattern data is sourced from TradeWave.ai, which analyzes historical price behavior across annual calendar windows going back up to 30 years. Read the full data methodology or the book The 100-Year Pattern by Afshin Moshrefi (2026 edition). Past performance of seasonal patterns does not guarantee future results. This article is for informational purposes only and does not constitute investment advice.