Dominion Energy (D) Has Rallied in 10 of 10 Midterm Summers as a 44-Day Bullish Window Nears
Dominion Energy is nearing a historically strong 44-day midterm-year seasonal window just as shares trade near a 52-week high and a proposed NextEra mega-merger looms.

What is the seasonal pattern for Dominion Energy (D)?
Dominion Energy has risen in 10 of 10 midterm-year summer windows during this 44-day stretch, with an average gain of 5.91% in winning years.
- 10 for 10 in this window, averaging 5.91% gains in winning years across the last 10 midterm election cycles.
- The upcoming 44-day window starts Jul 9, 2026 and has historically favored long positions in Dominion Energy.
- Percent Profitable is 100%, with 10 winners and 0 losers in the historical sample.
- Average winner gains of 5.91% come with a TradeWave Ratio of 1.27 and a Sharpe ratio of 0.98, pointing to solid risk-adjusted returns.
- Intraperiod drawdowns have at times been sharp, with adverse moves as deep as about 22% in one year even though the window still finished positive.
- The pattern is specific to midterm election years, tying Dominion’s seasonal strength to a distinct phase of the presidential policy cycle.
According to historical data from TradeWave.ai, this midterm-year summer stretch has behaved very differently from an average month on the calendar for Dominion Energy. The next section walks through what that election-cycle seasonality has looked like in practice, and how it frames the weeks ahead.
How has Dominion Energy (D) traded in this midterm-year summer window?
Dominion Energy has posted gains in all 10 midterm election years during this 44-day summer window, averaging a 5.91% rise with a long trade direction. Shares finished Thursday at 69.13, up about 1.0% on the day and sitting roughly 0.4% below their 52-week high of 69.43, so the stock is heading into this pattern from a position of strength.[1]
Grouping the data by presidential election cycle matters here because utilities often trade off policy expectations, rate paths and regulatory headlines rather than pure macro growth. Midterm years tend to feature heavier legislative noise and regulatory maneuvering, which can reshape how defensive sectors like utilities behave compared with the calmer pre-election year that follows.
This seasonal window begins on Jul 9, 2026 and spans 44 trading days. Historically, during this period in midterm election years, Dominion Energy has shown a consistently bullish tendency for long positions, with no losing years in the sample.
The trade direction for this pattern is explicitly long. Percent Profitable sits at 100%, with 10 winners and 0 losers, so every midterm-year iteration in the lookback delivered a positive net return by the end of the window. Average profit in those winning years is 5.91%, while the median outcome is a 5.26% gain, suggesting the typical result has been a mid-single-digit advance rather than a one-off outlier.
On a risk-adjusted basis, the Sharpe ratio of 0.98 indicates that these returns have come with volatility but not chaos. The TradeWave Ratio of 1.27 captures how far price typically travels in the trade direction within the window, independent of the final close, and it points to meaningful upside excursions for longs before the period ends.
Looking at individual years, the strongest outcome came in 1986, when the stock gained 20.17% during the window, with the maximum favorable move matching that 20.17% run-up and essentially no adverse excursion. At the other end of the spectrum, 1990 delivered a modest 1.14% net gain, with a best intraperiod rally of 4.26% and a worst drawdown of 1.99%, showing that even the softest year still finished in the green.
Drawdowns can still bite. In 2002, Dominion Energy ended the window up 3.29%, but the worst intraperiod move was a 22.39% drop from the entry level before the stock recovered. More recent cycles such as 2014 and 2022 saw maximum adverse moves of 6.49% and 5.65% respectively, paired with net gains of 0.71% and 6.0%, which underlines that even “all winner” windows can involve uncomfortable volatility along the way.
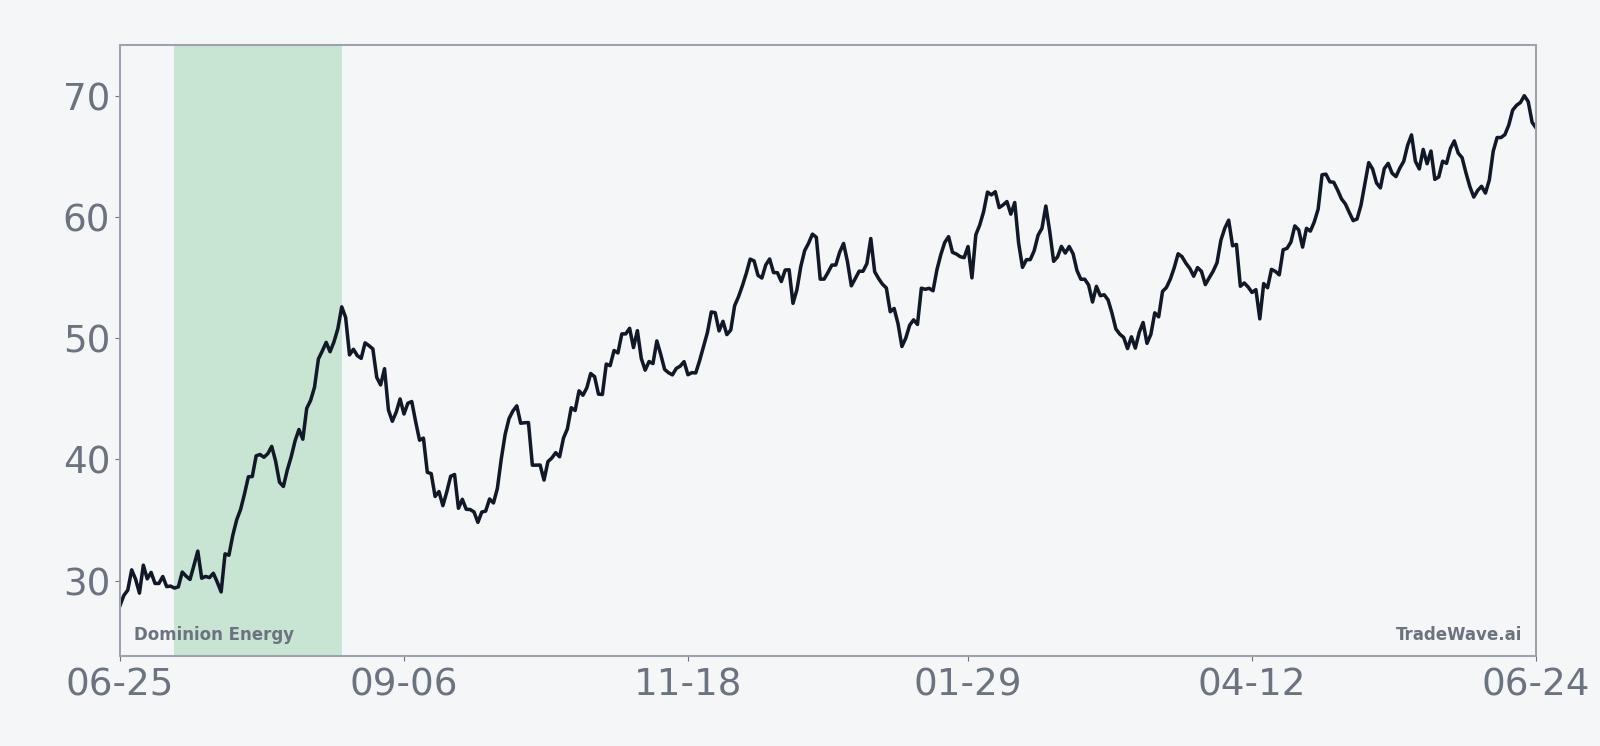
The historical seasonal trend chart for this midterm-year window shows a generally upward-sloping average path, with gains tending to build gradually rather than in a single burst. The pattern suggests that strength often emerges early in the window, consolidates, and then grinds higher into the back half, though individual years have varied around that template.
The cumulative return profile across the last 10 midterm election years adds up to a 75% total gain for this specific slice of the calendar. That steady climb, rather than a jagged or flat line, signals that the bullish bias has been persistent across cycles rather than dominated by one or two outsized winners.
Year-by-year bars with intraperiod swings show how often Dominion has rallied and how deep the temporary drawdowns have run.
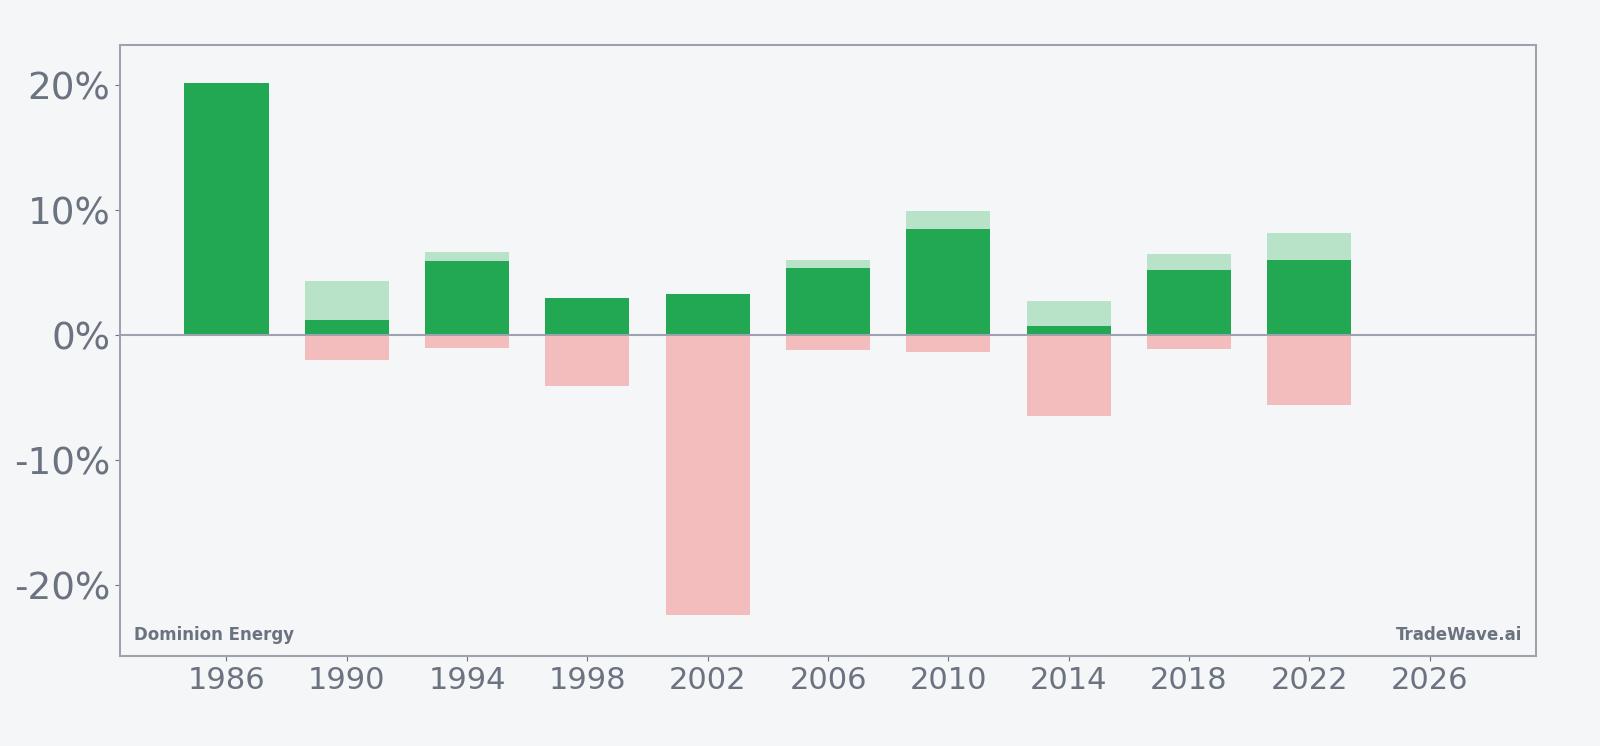
History does not guarantee future results; adverse excursions can be large even in winning windows, so traders should size risk with the possibility of double-digit drawdowns in mind.
Why does Dominion Energy (D) follow this seasonal pattern?
One likely driver is the way utility regulation and rate cases cluster around the midyear policy calendar, which can concentrate headline risk and relief rallies into this part of the midterm election year. Analysts have also pointed to institutional portfolio repositioning as investors rebalance defensive exposure ahead of the typically stronger pre-election year. For a regulated utility like Dominion, that mix of policy timing, rate expectations and sector rotation can translate into a repeatable mid-summer trading window.
What is driving Dominion Energy (D) today?
Dominion Energy closed at 69.13 on Jun 25, up 0.68 on the day for a 1.0% gain, with the stock trading about 0.4% below its 52-week high of 69.43 and well above its 52-week low near 50.27.[1] The move comes as investors continue to digest NextEra Energy’s proposed all-stock deal to acquire Dominion in a transaction valued at roughly $67 billion, a combination that would create the country’s largest utility if regulators sign off.[1][8] The merger story has pulled Dominion into the center of a broader energy M&A wave, with traders weighing potential deal spread, regulatory risk and the possibility of alternative outcomes if the transaction faces pushback.[1][8]
The chart below places the latest uptick against Dominion’s past year of trading and a 60-day seasonal projection.
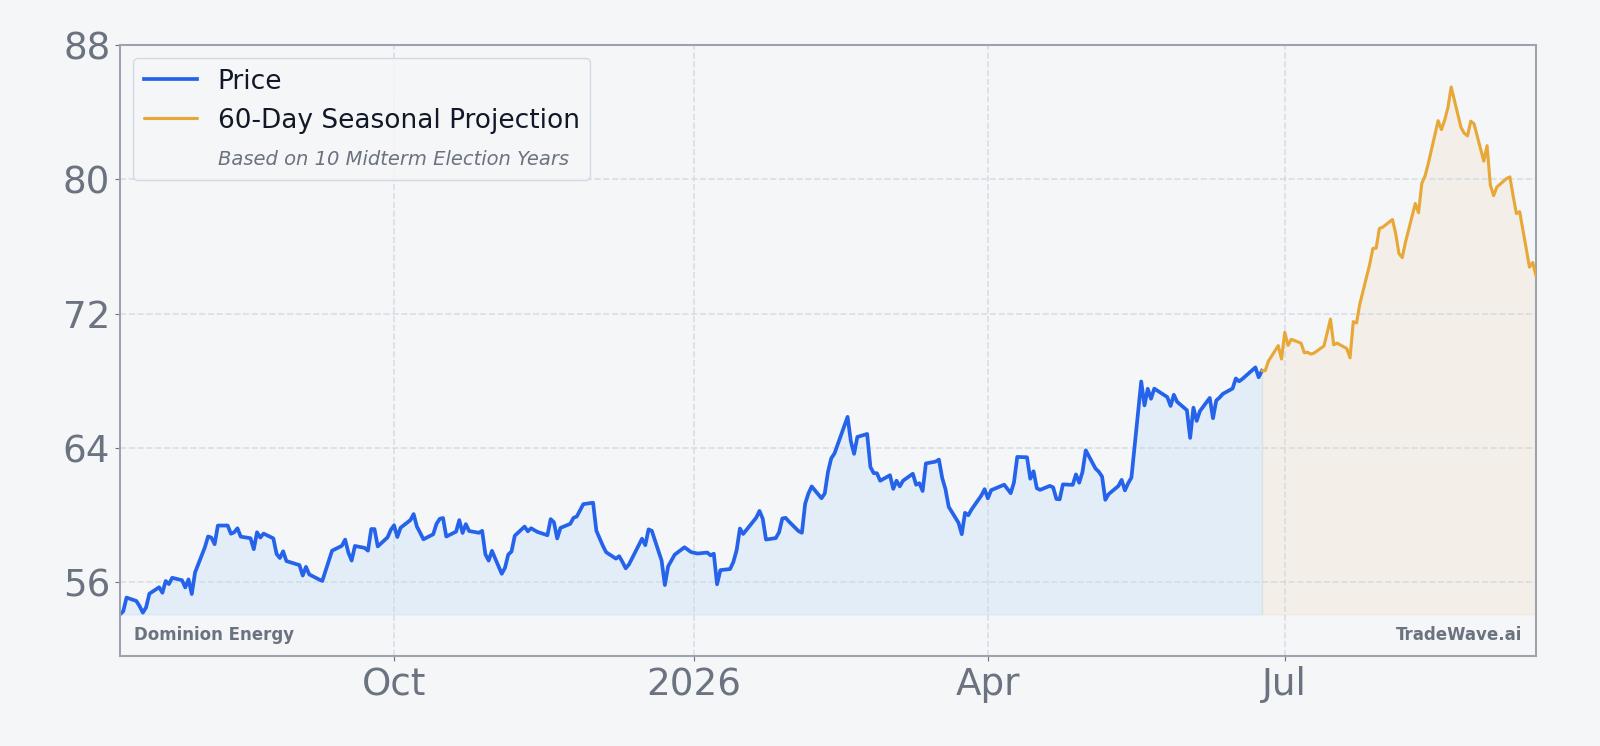
Beyond the merger, Dominion still carries regulatory baggage from its renewable portfolio. In Dec 2025, shares dropped after the Trump administration halted the Coastal Virginia Offshore Wind project, one of five East Coast wind developments put on hold, underscoring how federal decisions can quickly reshape the company’s growth narrative.[9] That backdrop makes the upcoming seasonal window more interesting: the historical pattern has been strongly positive even in years when policy headlines were noisy, suggesting that midterm-year summer trading has often rewarded investors who could look through near-term shocks.
What should traders watch as this seasonal window approaches?
First, the calendar. The 44-day midterm-year window starts on Jul 9 and runs into late August, so any sharp move in Dominion around that time will be unfolding inside a slice of the year that has historically leaned bullish for longs. Traders will be watching whether price respects that pattern by grinding higher from levels near the current 52-week high, or whether deal headlines or rate volatility overwhelm the usual seasonal tailwind.
Second, policy and regulatory milestones. The proposed NextEra merger will face scrutiny from federal and state regulators, and any signals on antitrust, grid reliability or ratepayer impact could jolt Dominion’s tape.[1][8] A friendly tone could reinforce the historical seasonal strength, while tougher rhetoric or delays might test how resilient this midterm-year pattern really is.
Third, levels and volatility. On the upside, traders will focus on whether Dominion can sustain breaks above the recent high near 69.4 and build a base in the low 70s during the window. On the downside, prior years show that even winning windows have tolerated double-digit intraperiod drawdowns, so a slide back toward the mid-60s would not, by itself, contradict the historical pattern as long as the stock can recover before the window closes.
Finally, the broader sector and macro backdrop. Large utility M&A, shifting expectations for interest rates and ongoing uncertainty around offshore wind regulation all feed into how investors treat regulated utilities as a group.[1][8][9] If the sector remains a preferred defensive haven into the back half of the midterm year, that could align neatly with Dominion’s 10-for-10 seasonal record. If risk appetite rotates away from utilities, traders may find that this time the calendar tailwind has to work harder to show up on the chart.
Sources
- [1] Reuters, "NextEra to discuss paying about $76 per share for Dominion, Bloomberg News reports," May 17, 2026.
- [8] CNBC, "An AI trade involving energy and infrastructure that's doubled your money, topping Nvidia," May 21, 2026.
- [9] CNBC, "Stocks making the biggest moves midday: Dominion Energy, Paramount, Rocket Lab, Stanley Black & Decker and more," Dec 22, 2025.
About this seasonal analysis
Seasonal pattern data is sourced from TradeWave.ai, which analyzes historical price behavior across annual calendar windows going back up to 30 years. Read the full data methodology or the book The 100-Year Pattern by Afshin Moshrefi (2026 edition). Past performance of seasonal patterns does not guarantee future results. This article is for informational purposes only and does not constitute investment advice.