10-for-10 Midterm Streak: Amgen (AMGN) Nears 22-Day July Window With 100% Profitable Years
Amgen is approaching a historically strong 22-day July trading window just as shares hover near record territory and regulatory scrutiny stays in focus.
Price as of Jun 29, 2026: $360.55 (last close).

What is the seasonal pattern for Amgen (AMGN)?
Amgen has risen in 10 of 10 midterm-year July windows during this 22-day stretch, with an average gain of 7.02% in winning years.
- 10 for 10 in this window, with Amgen averaging 7.02% gains across all winning years.
- The upcoming 22-day trading window starts Jul 5 and covers the last 10 midterm election years.
- Percent Profitable is 100%, with 10 winners and 0 losers in the historical sample.
- Average profit in winning years is 7.02%, alongside a Sharpe ratio of 1.32 for end-of-window returns.
- The TradeWave Ratio of 1.6 signals that price has typically traveled meaningfully in the long direction within the window.
- Intraperiod swings have included double-digit drawdowns in some years, so the path has not always been smooth even when the window finished higher.
According to historical data from TradeWave.ai, this midterm-year July stretch has behaved very differently from an average month for Amgen, with a clear directional bias that traders rarely discuss.
How has Amgen (AMGN) traded in this midterm-year July window?
Amgen has finished higher in every one of the last 10 midterm election years during the 22 calendar days starting around Jul 5, averaging a 7.02% gain for long positions. Today the stock closed at 360.55, up 0.6% on the day and about 6.5% below its 52-week high of 385.45, leaving it near the upper end of its one-year range. That combination of a clean 10-for-10 win record and a price sitting not far from record territory makes this upcoming Amgen trading window hard for seasonal traders to ignore.
Because this pattern is grouped by the presidential election cycle, it only looks at midterm election years, which tend to feature heavier policy noise and more volatile risk appetite than other phases. The current calendar year is a midterm election year, and this July window also sits close to the transition into the year before the presidential election, a phase that has often seen stronger risk-on behavior in equities more broadly.
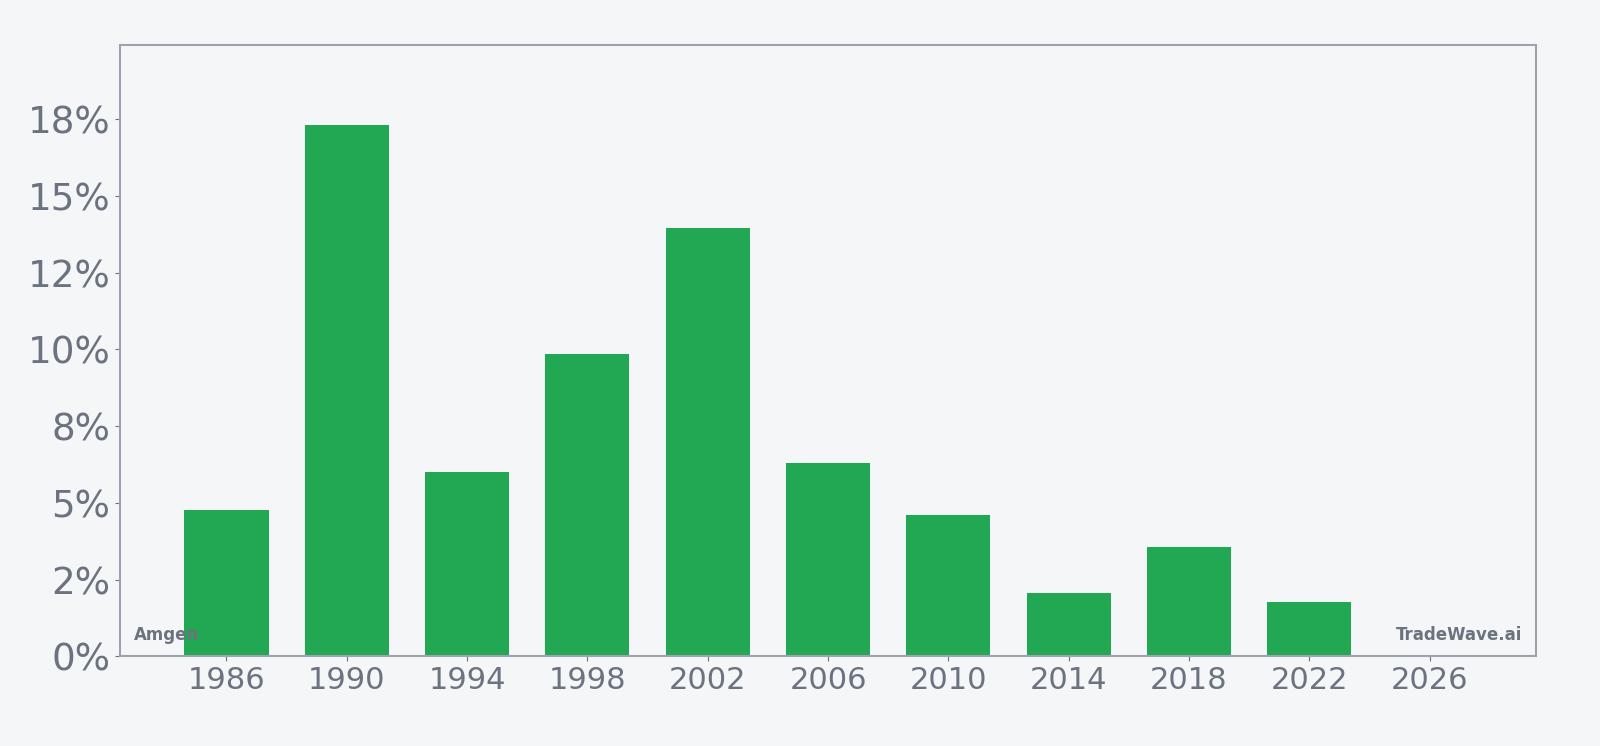
Historically, the trade direction for this Amgen seasonal pattern has been long. Percent Profitable is 100%, with 10 winners and 0 losers across the last 10 midterm election years, and the average profit across those years is 7.02%. Median profit of 5.39% shows that even the middle-of-the-pack outcomes have been solid, while a cumulative return of 95% across the sample underscores how much this specific slice of the calendar has contributed to long exposure over time.
The distribution of outcomes is not just about the average. The strongest year in the sample was 1990, when Amgen gained 17.32% during the window, with a maximum favorable move of 17.96% and only a shallow 0.64% intraperiod dip from entry. At the other end of the spectrum, 2014 delivered a modest 2.07% net gain, and 2022 added just 1.79%, reminding traders that even a perfect win record can include quieter years.
Intraperiod swings have sometimes been sharp. In 2002, Amgen finished the window up 13.95%, but the worst drawdown from entry reached 19.7% before the stock recovered. In 1986, the stock gained 4.78% over the window, yet the maximum adverse move was 10.11%, showing that even winning years have included double-digit downside before the pattern played out.
The maximum favorable excursions tell a different story. Several years, including 1998 and 2002, saw peak run-ups in the mid-teens, with maximum favorable moves of 16.94% and 13.95% respectively. That combination of sizable upside bursts and occasional deep drawdowns is consistent with a biotech name that can react sharply to trial headlines, regulatory developments, or sector-wide flows during the summer.
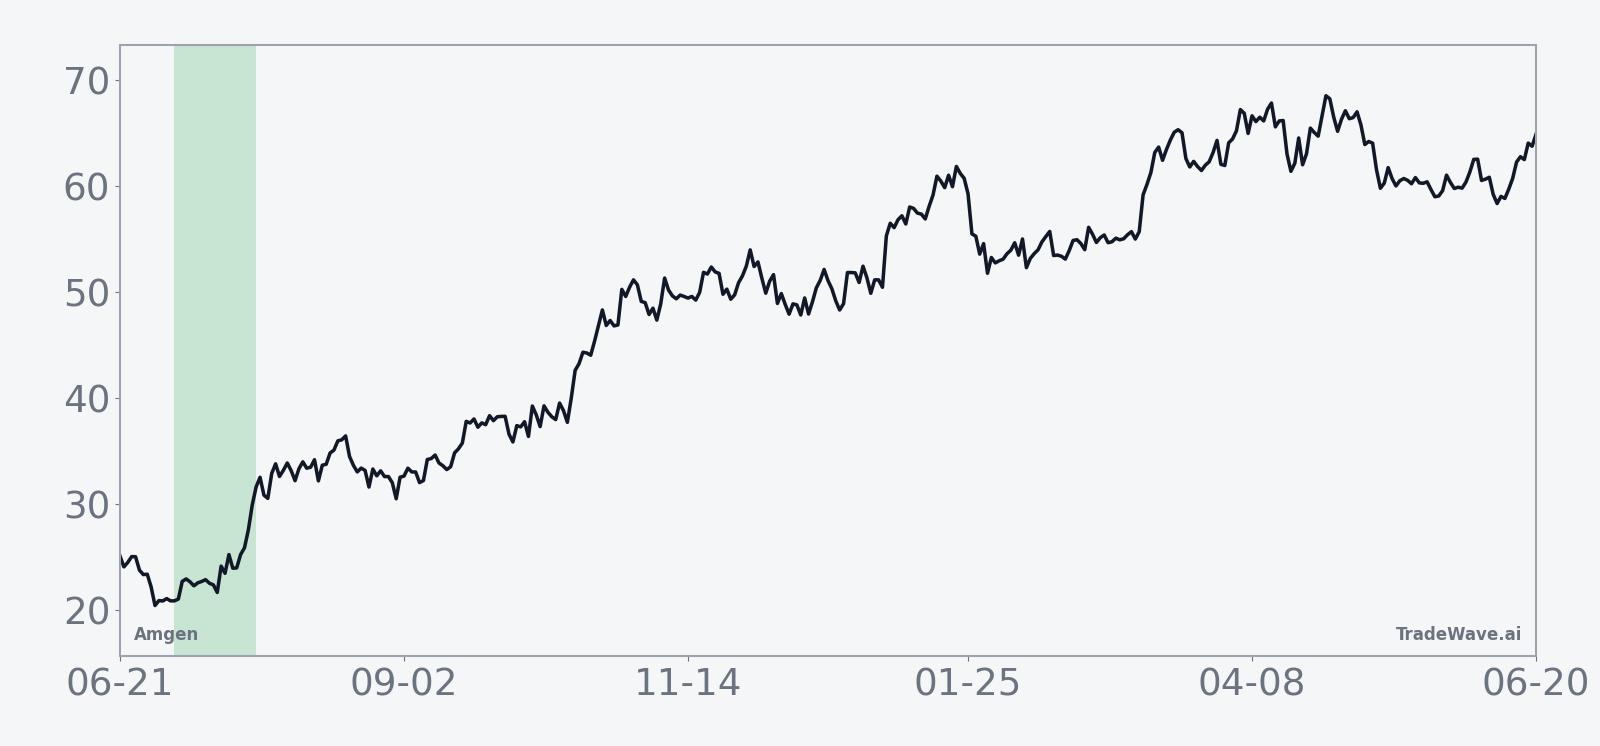
The historical seasonal trend chart shows a pattern of early gains that tend to build through the middle of the window before flattening out toward the end. The typical path is not a straight line, but the bias has been for strength to cluster in the first half of the period, which may matter for traders thinking about timing within the window.
The combined net, peak run-up, and worst drawdown bars put that upside bias and volatility into a single picture.
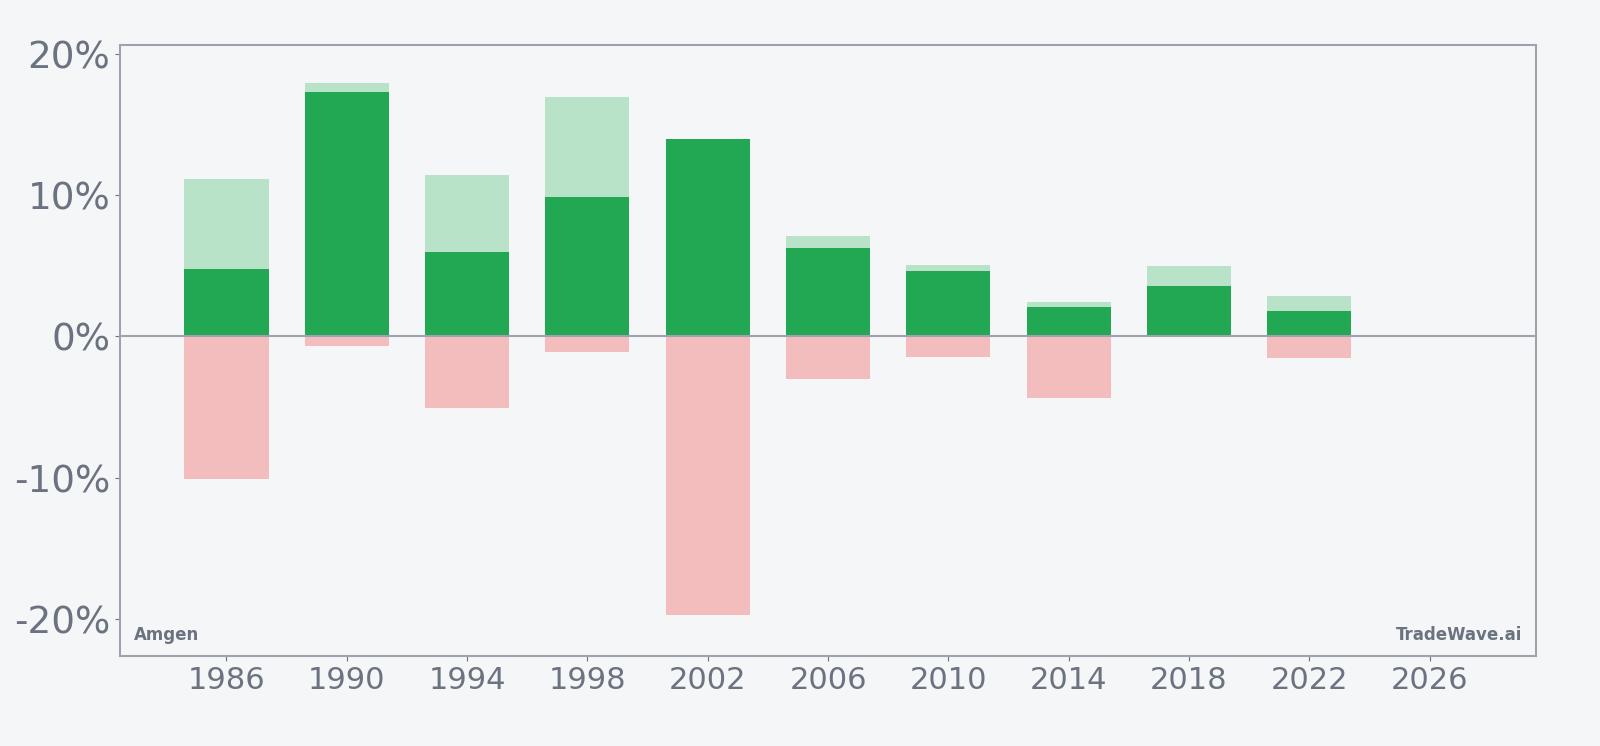
The stacked net, maximum favorable, and maximum adverse bars highlight a clear pattern: every year has finished positive, but several have featured sizable intraperiod drawdowns alongside strong rallies. Add it up and this has been a bullish but bumpy window for long exposure, not a low-volatility grind higher.
History does not guarantee future results; adverse excursions can be large even in winning windows, and traders should size risk accordingly.
Why does Amgen (AMGN) follow this seasonal pattern?
One likely driver is the way Amgen’s earnings calendar and clinical news flow cluster around midyear, which can concentrate trading interest into early July as investors position for second-half guidance and trial updates. Analysts have also pointed to broader sector rotation in healthcare during midterm election years, when policy debates around drug pricing and reimbursement can temporarily ease or intensify. This pattern may reflect a mix of those fundamental catalysts with institutional portfolio rebalancing as managers adjust biotech exposure heading into the back half of the year.
What is driving Amgen (AMGN) today?
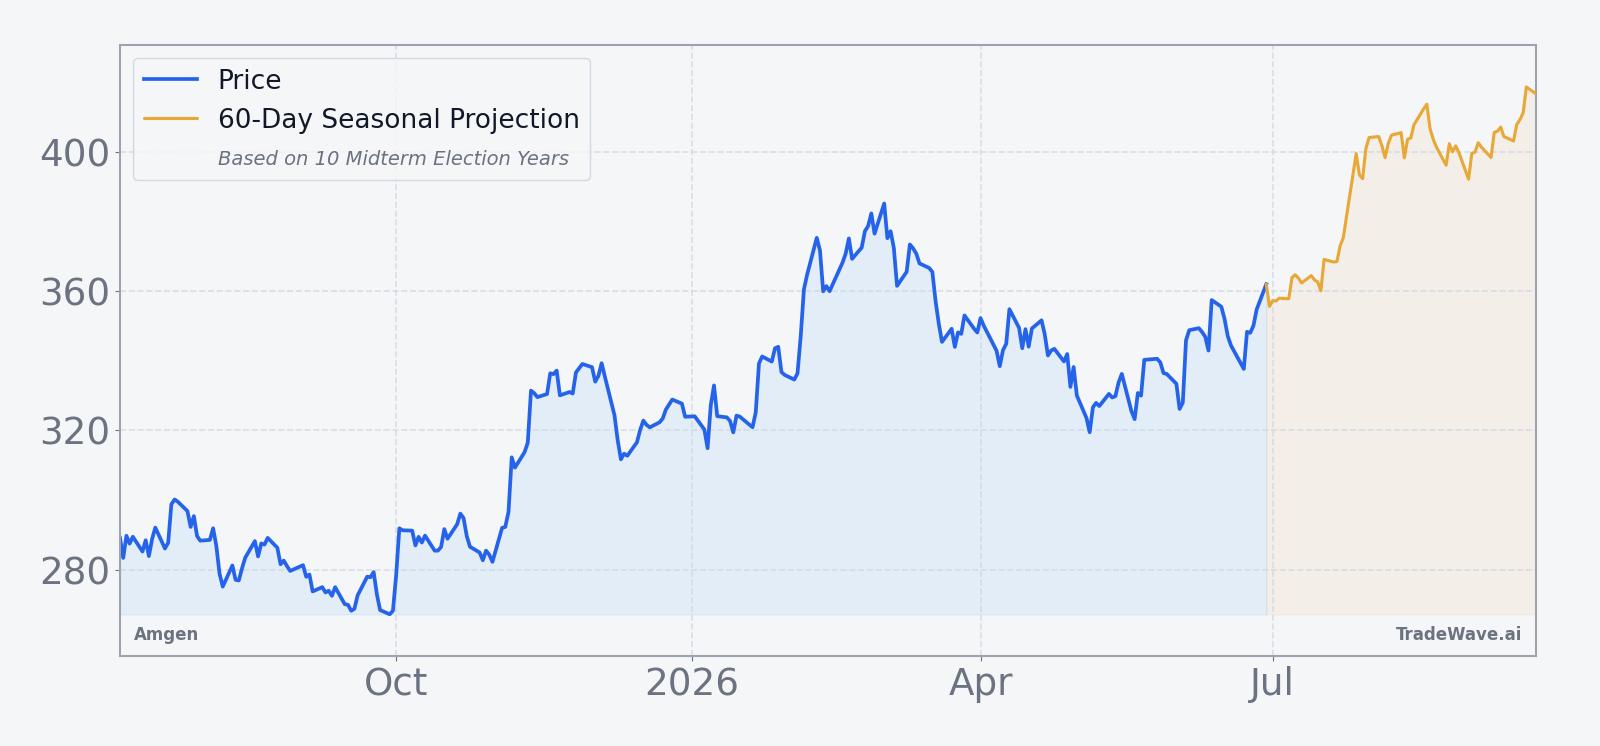
Amgen closed Monday at 360.55, up 0.6% on the session, leaving the stock about 6.5% below its 52-week high of 385.45 and well above its 52-week low of 258.40. The move extends a roughly 7.05% gain over the past month, as investors continue to weigh the company’s obesity-drug pipeline potential against pockets of regulatory and product risk in the broader portfolio.[1]
The chart below situates the latest move in its recent multi-month context, alongside a 60-day seasonal projection path.
In May 2026, Japanese regulators reinstated prescribing of Amgen’s rare-disease drug Tavneos with new safety warnings after reported patient deaths, a reminder that regulatory risk remains a live issue for the company.[5] That development followed a stretch of stronger financial performance: in February 2026, Amgen reported fourth-quarter revenue of $9.9 billion, up 9% year over year and ahead of Wall Street estimates, and guided 2026 adjusted EPS to a range of $21.60 to $23.00 alongside revenue of $37 billion to $38.4 billion.[2] Earlier, in August 2025, the company had already raised its 2025 outlook after posting higher profit and revenue, helped by growth across key products and rising investor focus on its experimental weight-loss drug MariTide.[1][3]
Those pipeline hopes sit inside a much larger macro story. The global obesity treatment market is expected to grow sharply, with some estimates pointing to potential sales of $150 billion in coming years, which has kept attention on MariTide’s mid-stage data expected in the fourth quarter of 2025 and on how Amgen can compete with incumbents in the GLP-1 space.[1] At the same time, legacy products such as Prolia face biosimilar competition, and sector-wide pricing pressure continues to shape revenue trajectories for large-cap biotech and pharmaceutical names.[1]
For traders watching the upcoming seasonal window, the backdrop is a stock that has already rerated higher on earnings beats and obesity optionality, but that still carries headline risk from regulators and competition. The historical midterm-year July pattern has favored longs, yet the path has often involved sharp swings that can be amplified when trial updates, safety headlines, or macro risk-off episodes hit during the same stretch.
What should traders watch in this Amgen seasonal window?
The first marker is timing. The 22-day window begins Jul 5, so price action in the days just before entry can shape how much room there is for the historical pattern to play out. A push back toward the 52-week high near 385 in early July would mean the stock enters the window from a position of strength, while a pullback toward the 50-day moving average around 338.43 would reset expectations and potentially change how traders interpret any subsequent rally.
Second, watch how Amgen trades around policy and macro headlines tied to the midterm election year. Historically, this phase of the presidential cycle has featured more noise around healthcare regulation and fiscal priorities, which can spill into large-cap biotech valuations. If the stock can hold above recent support levels during any policy-driven volatility and still show the kind of early-window strength seen in prior cycles, that would be a sign the historical seasonal trend is tracking.
Third, monitor news flow around MariTide and other pipeline assets, even though the key mid-stage obesity data is not expected until the fourth quarter of 2025.[1] Any incremental commentary on trial design, safety, or competitive positioning could influence how aggressively investors are willing to lean into the seasonal pattern, especially with the obesity-treatment market narrative still evolving.
Finally, the behavior of intraperiod swings will matter as much as the final outcome. In past midterm-year July windows, Amgen has sometimes suffered double-digit drawdowns before finishing higher, so traders may focus on how quickly any dips are bought and whether rallies stall near prior highs or extend beyond them. If the stock spends most of the window grinding sideways with shallow pullbacks, that would mark a clear departure from the more volatile historical profile, even if the final return ends up positive.
Sources
- Reuters: "Amgen profit rises, weight-loss data expected in 4th quarter" (Aug 5, 2025).
- Reuters: "Amgen Q4 results beat Street estimates, company says patients need weight-loss options" (Feb 3, 2026).
- The Wall Street Journal: "Amgen Posts Higher Profit, Revenue On Sales Growth Among Products" (Aug 5, 2025).
- The Wall Street Journal: "Amgen Drug Gets New Warnings in Japan After Patient Deaths" (May 21, 2026).
About this seasonal analysis
Seasonal pattern data is sourced from TradeWave.ai, which analyzes historical price behavior across annual calendar windows going back up to 30 years. Read the full data methodology or the book The 100-Year Pattern by Afshin Moshrefi (2026 edition). Past performance of seasonal patterns does not guarantee future results. This article is for informational purposes only and does not constitute investment advice.