Garmin (GRMN) Has Dropped in 6 of 6 Midterm July Windows, Averaging 4.1% Short-Side Gains
Garmin is heading toward a July trading window that has delivered short-side gains in every midterm election year in the past two decades, even as the stock trades well below its 52-week high after a powerful post-earnings run.
Price as of Jun 25, 2026: $235.41 (last close).

What is the seasonal pattern for Garmin (GRMN)?
Garmin has fallen in 6 of 6 midterm-year July windows during this 22-day pattern, with an average gain of 4.1% for traders positioned in the short direction.
- 6 for 6 in this window, with Garmin moving an average of 4.1% in favor of short positions across the last six midterm election years.
- The upcoming 22-trading-day window starts Jul 7, 2026 and targets the last six midterm election years rather than consecutive calendar years.
- Percent Profitable is 100%, with 6 winners and 0 losers for the short-side pattern over the lookback.
- Average winner profit is 4.1%, supported by a Sharpe ratio of 1.43 that signals a relatively consistent payoff profile for this specific setup.
- The TradeWave Ratio of 1.6 indicates that price has typically traveled meaningfully in the trade direction within the window, even before final exits.
- Intraperiod swings have included sizable adverse moves in some years, so short setups have historically come with real drawdown risk despite the perfect win record.
According to historical data from TradeWave.ai, this midterm-year July stretch has behaved very differently from an average month for Garmin, and the next iteration is just days away.
How has Garmin (GRMN) traded in this midterm-year July window?
Garmin has declined in all six midterm election years during this 22-day July window, delivering an average 4.1% gain for traders on the short side. The next instance begins on Jul 7, 2026, with shares last changing hands at 235.41, about 13.1% below their 52-week high of 270.91 and roughly 29.3% above the 52-week low of 182.05. That combination of a stretched multi-month rally and a historically bearish seasonal pocket gives this upcoming Garmin trading window unusual weight for short-term stock pattern analysis.
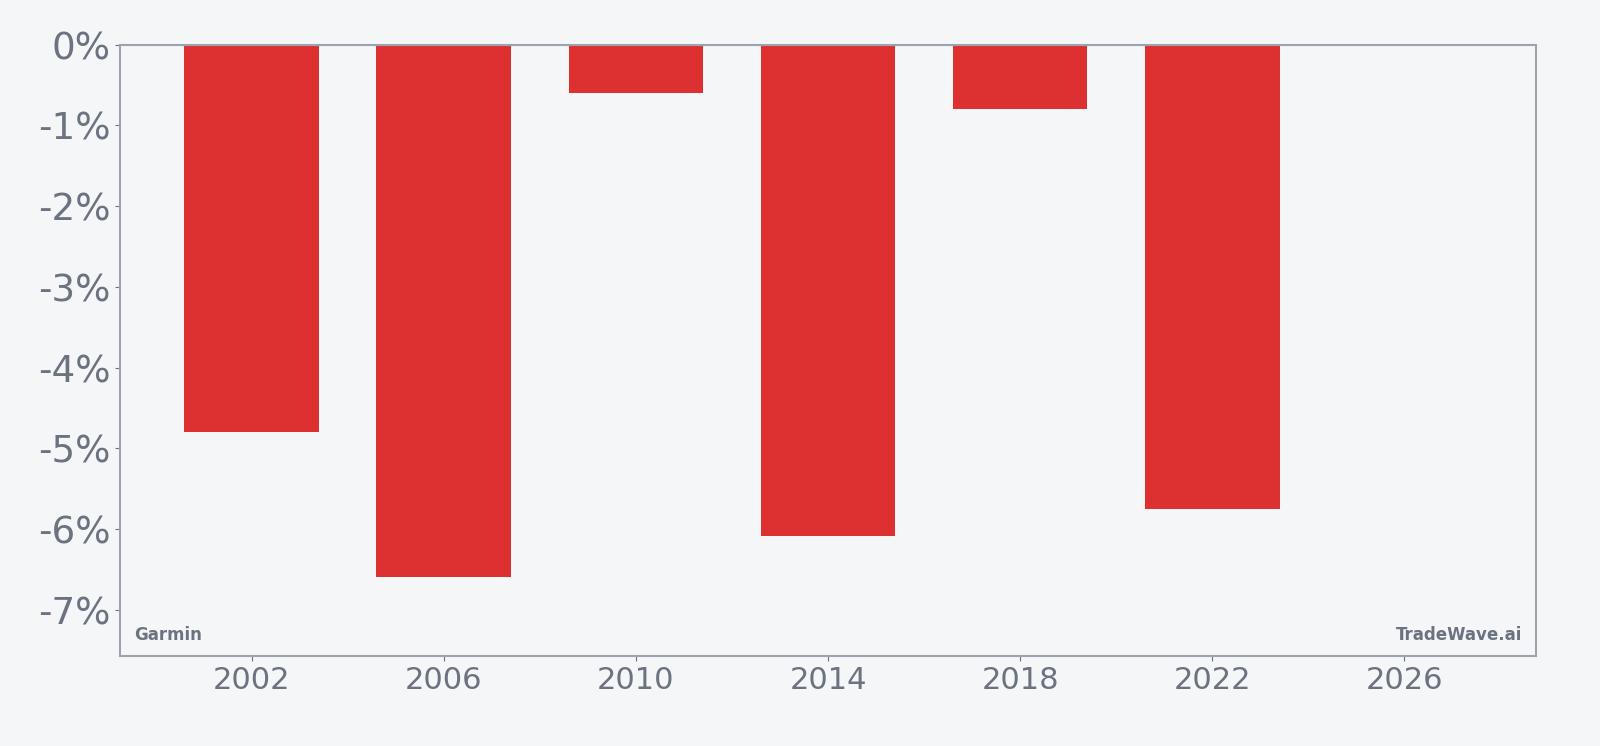
Because this pattern is grouped by the presidential election cycle, it only looks at Garmin’s behavior in the last six midterm election years, not every year on the calendar. That matters in 2026, which is itself a midterm election year, since policy uncertainty, shifting fiscal priorities and sector rotation around Washington’s agenda can all cluster in ways that repeat from one midterm to the next.
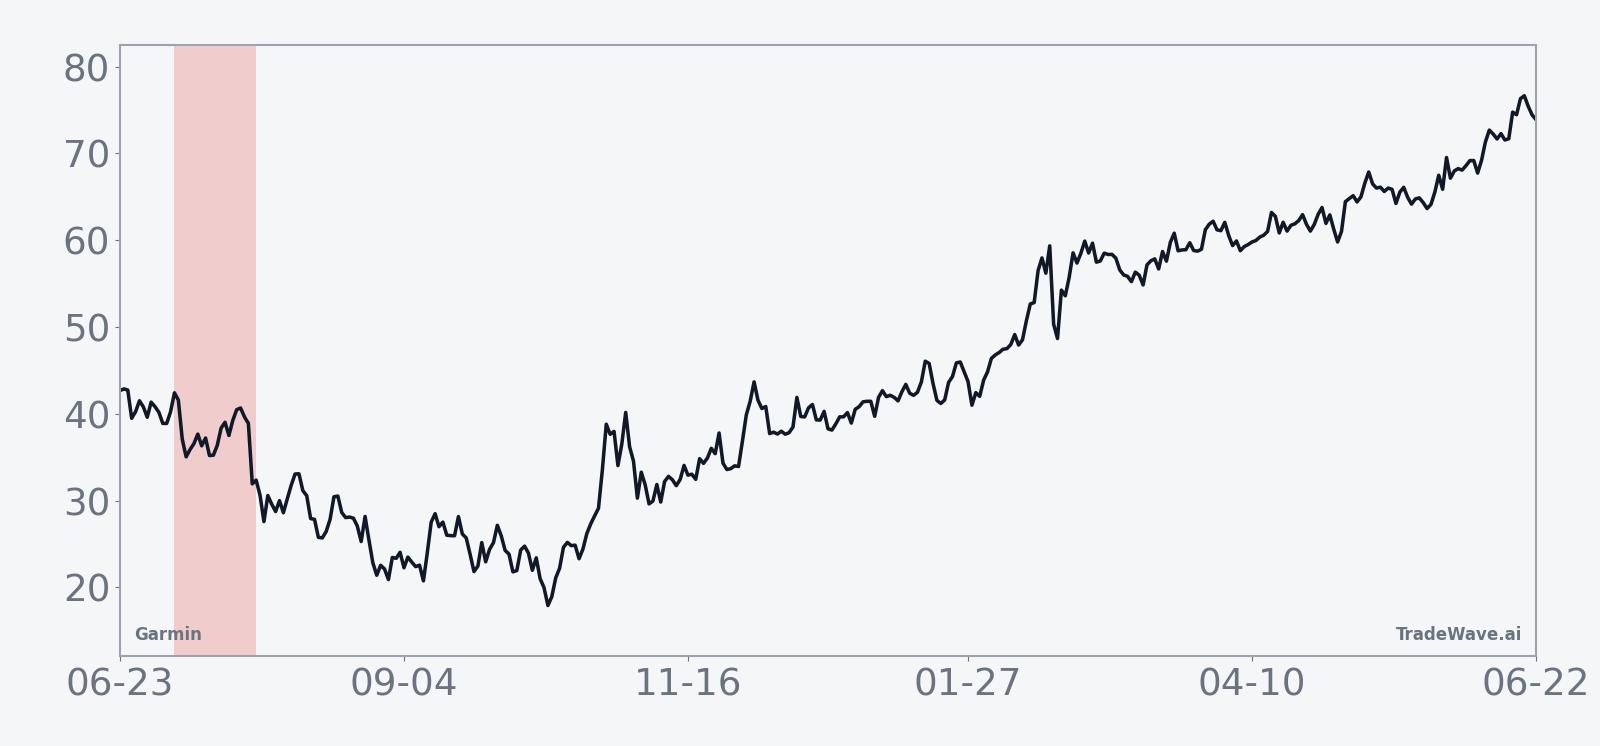
The historical seasonal average shows Garmin typically drifting lower through most of the 22-day stretch, with the bulk of the short-side gains accruing steadily rather than in a single air pocket. That fits a pattern of controlled downside rather than crash-like behavior, which is consistent with the relatively modest 4.1% average profit for shorts despite a perfect win record.
Year-by-year net returns and intraperiod swings show how much room Garmin has historically given both shorts and would-be dip buyers during this window.
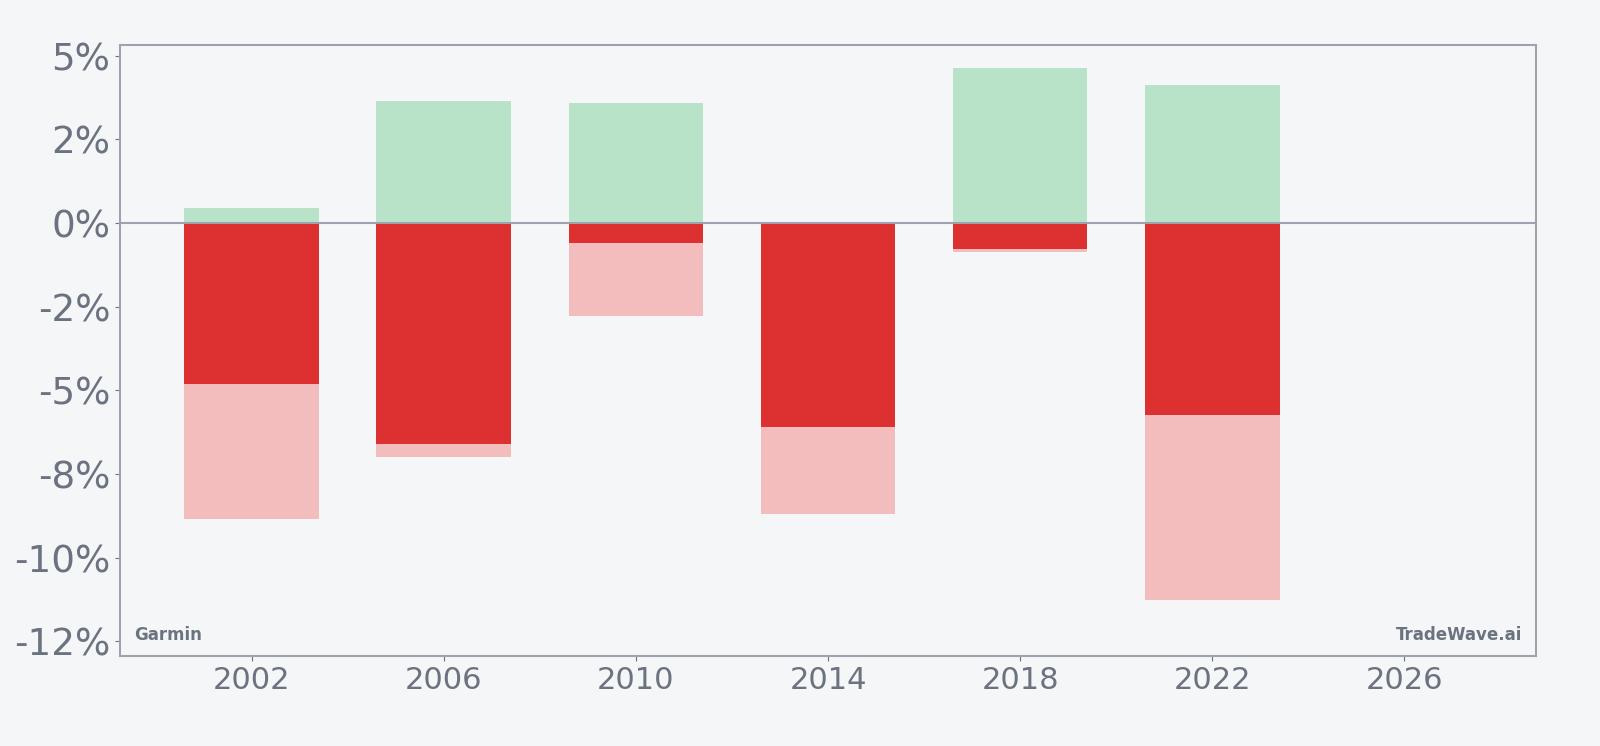
Per-year data underline how this Garmin seasonal trend has played out in practice. In 2006, for example, the stock fell 6.59% over the window with a worst intraperiod drawdown of about 7.0% from the entry and a brief 3.64% move against the short before the decline reasserted itself. In 2022, the short-side profit was 5.75%, but the maximum adverse move reached 11.26%, showing that even winning years have featured sharp countertrend rallies that would have pressured shorts before the pattern completed.
Across the six midterm-year samples, maximum favorable excursions have often been larger than the final net returns, which is what drives the 1.6 TradeWave Ratio. That means Garmin has tended to travel meaningfully in the trade direction inside the window, even when some of those gains were given back by the close. At the same time, the MAE profile shows that intraperiod downside for longs has been real, with several years posting drawdowns near or above 8% from the entry level.
The cumulative return curve for this pattern climbs steadily as each midterm-year window is added, reaching a total gain of 27% for the short-side strategy across the six instances. Add it up and you get a clean, if narrow, historical edge: every midterm-year July window in this sample has rewarded traders leaning short, but the path has rarely been smooth.
History does not guarantee future results, and the worst intraperiod drawdowns in this window have been large enough that even winning years would have been uncomfortable for poorly risk-managed positions.
Why does Garmin (GRMN) follow this seasonal pattern?
This Garmin seasonal pattern may reflect a mix of midyear portfolio rebalancing and sector rotation in hardware and fitness-tech names as investors digest first-half results. One likely driver is that midterm election years often bring shifting expectations around consumer spending, healthcare policy and defense budgets, all of which touch Garmin’s aviation, marine and wearables businesses. The July timing also sits between major product and holiday cycles, a lull that can leave the stock more vulnerable to profit-taking after strong runs.
What is driving Garmin (GRMN) today?
Garmin closed Friday at 235.41, down 1.9% on the day, leaving the stock about 13.1% below its 52-week high of 270.91 and roughly 29.3% above its 52-week low of 182.05. The pullback comes after a powerful first-half run that included an 11% intraday surge on Feb 18, 2026, when the company posted better-than-expected fourth-quarter results, raised its dividend and announced a 500 million dollar buyback alongside a strong 2026 forecast.[1]
That earnings reaction marked a clear inflection in sentiment around Garmin’s fitness and wearables franchise, with management pointing to robust demand and enough confidence in cash generation to step up capital returns.[1] Since then, the stock has consolidated below its highs as traders weigh how much of that upbeat outlook is already in the price, especially with the broader market focused on midterm-year policy risk and the path of interest rates.
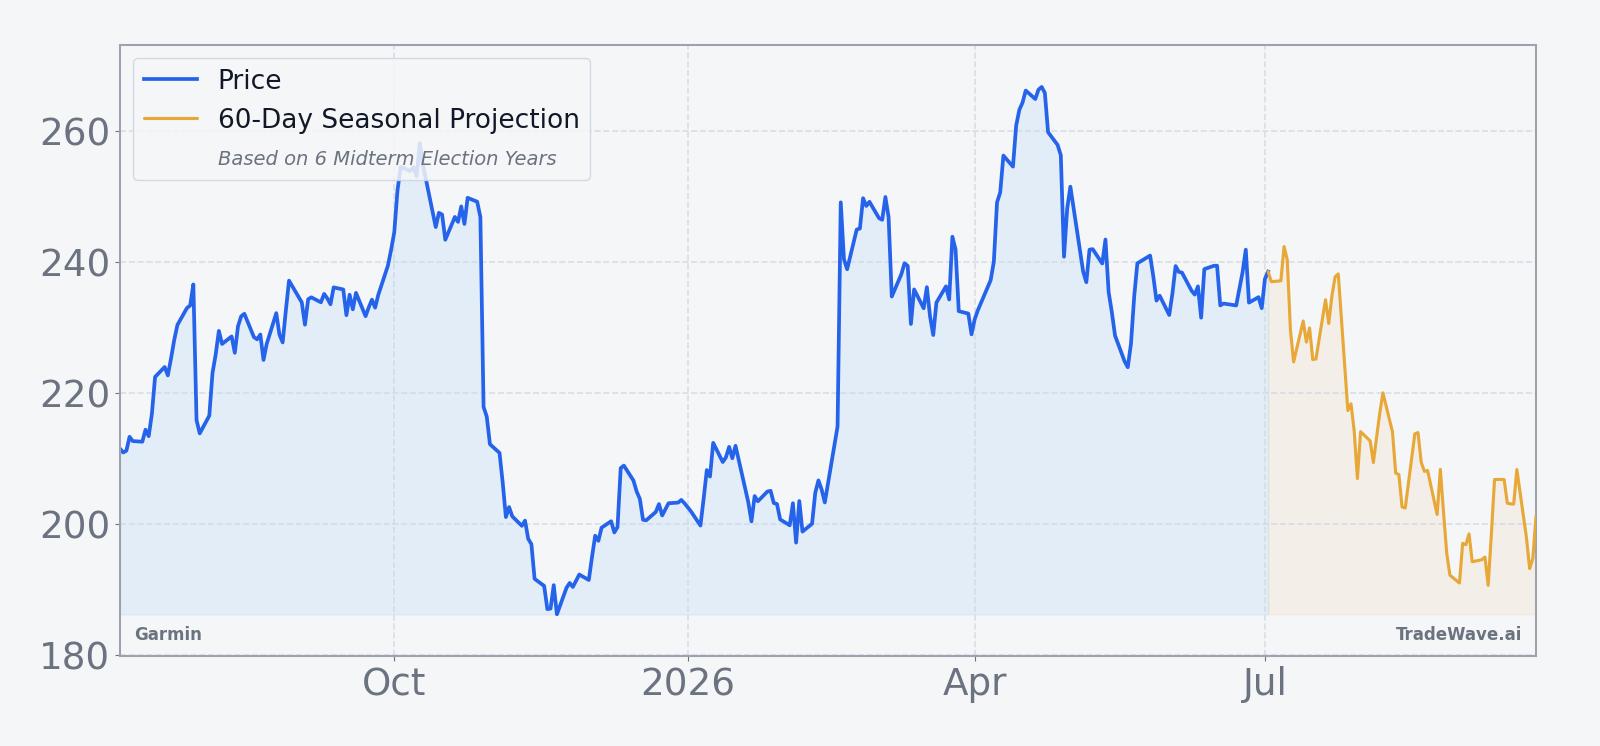
The chart below situates the latest move in its recent multi-month context and overlays the upcoming seasonal projection.
What should traders watch as this Garmin seasonal window approaches?
With the midterm-year July window set to open on Jul 7, the first thing to watch is how Garmin behaves if it retests the 245 to 250 area that capped rallies earlier this month. A failure to reclaim that zone as the window begins would be consistent with the historical pattern of gentle but persistent downside, while a decisive breakout would mark a clear departure from the past six cycles.
Second, intraperiod volatility will matter as much as direction. Prior midterm-year windows have seen maximum adverse moves against shorts as deep as 11.26%, so any sharp upside spikes during this stretch would not automatically invalidate the pattern but would test risk management. Traders focused on this Garmin trading window will be watching whether early rallies fade quickly, as they often have historically, or whether dip buyers are strong enough to keep the stock pinned near its highs.
Finally, the policy and macro calendar around the midterm election year could amplify moves. Any surprises on consumer spending, defense orders or aviation demand that cut against Garmin’s February optimism could reinforce the historical seasonality, while continued evidence of strong end-market demand would give bulls more ammunition to fight the pattern.[1] The key tell will be whether price action inside the window tracks the familiar midterm-year seasonal trend or breaks it decisively, signaling that Garmin’s current fundamental story has overwhelmed its usual July rhythm.
Sources
About this seasonal analysis
Seasonal pattern data is sourced from TradeWave.ai, which analyzes historical price behavior across annual calendar windows going back up to 30 years. Read the full data methodology or the book The 100-Year Pattern by Afshin Moshrefi (2026 edition). Past performance of seasonal patterns does not guarantee future results. This article is for informational purposes only and does not constitute investment advice.