Tyson Foods (TSN) Has Fallen in 10 of 10 Midterm Summers, Averaging 7.06% Short-Side Gains
Tyson Foods is heading toward a midterm-year summer stretch that has been reliably weak for the stock, even as chicken strength and a stable share price frame a more balanced fundamental story.
Price as of Jun 29, 2026: $58.65 (last close).

What is the seasonal pattern for Tyson Foods (TSN)?
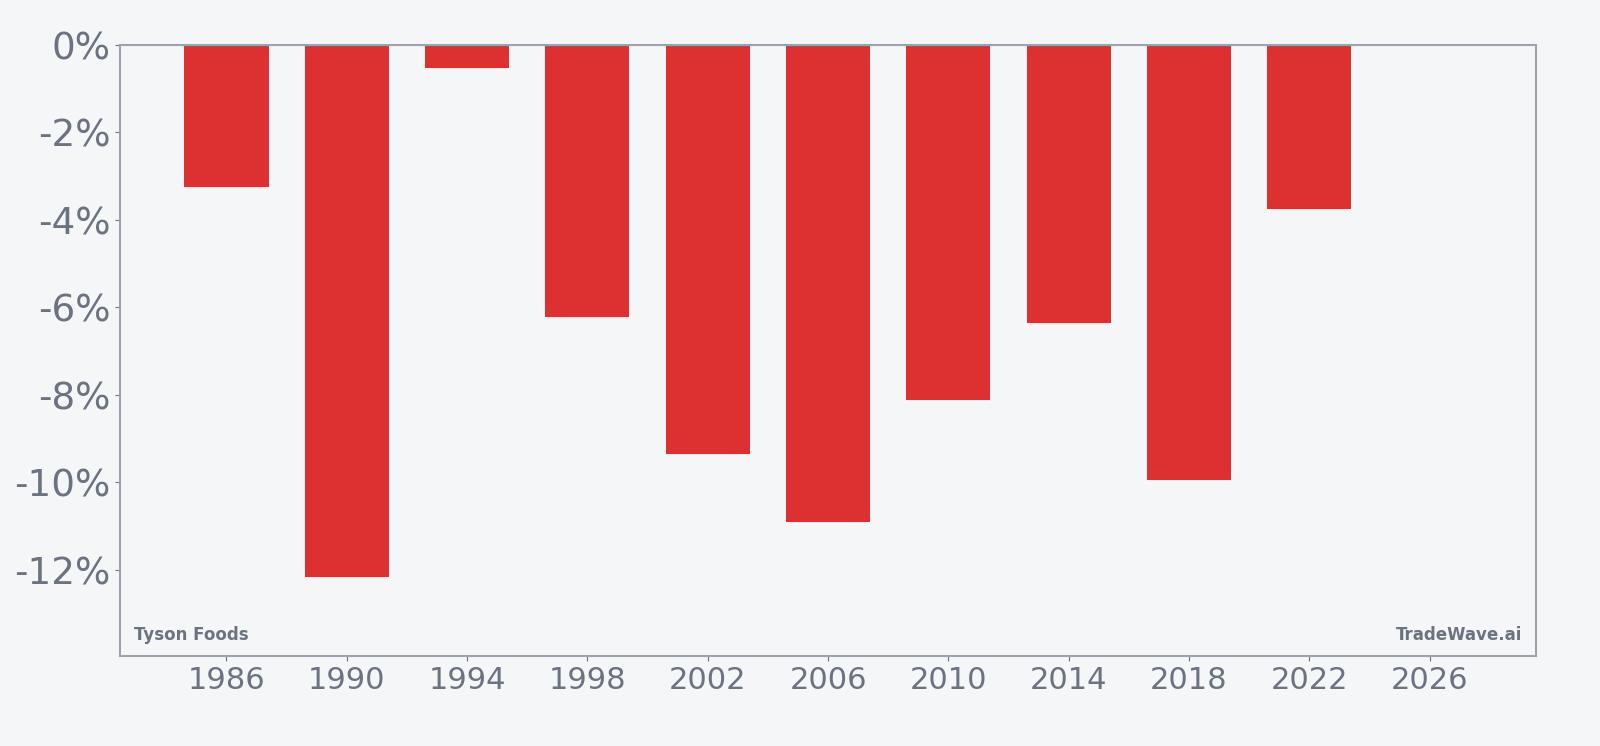
Tyson Foods has fallen in 10 of 10 midterm-year summer windows during this 28-day pattern, with an average gain of 7.06% in winning years for the short side.
- 10 for 10 in this window for shorts, with Tyson Foods declining every midterm-year cycle and delivering an average 7.06% move in favor of the short side.
- The upcoming 28-day window begins Jul 13, 2026 and targets the last 10 midterm election years, a focused TSN seasonal trend tied to the presidential cycle.
- Percent Profitable is 100%, with 10 winners and 0 losers for the short direction across the historical sample.
- Average profit per winning short is 7.06%, while the median outcome is a 7.24% decline in the stock over the window.
- The TradeWave Ratio is 2.37, indicating that price has typically traveled meaningfully in the trade direction within the window before settling.
- Intraperiod swings have been material, with historical best and worst excursions showing that even winning shorts can see sizable countertrend rallies before resolving lower.
According to historical data from TradeWave.ai, this midterm-year summer stretch has behaved very differently from an average month for Tyson Foods, and the next iteration is about to open again.
How has Tyson Foods (TSN) traded in this midterm-year summer window?
Tyson Foods has declined in all 10 midterm election years during this 28-day July–August window, with shorts averaging a 7.06% gain as the stock drifts lower. Today TSN closed at $58.65, up 0.2% on the day and sitting between its 52-week low of about $48.07 and high near $68.32, roughly 14.9% below the top of that range. That combination of a clean 10-for-10 record for the short side and a mid-range price level gives this specific TSN seasonal pattern unusual weight as the calendar flips into July.
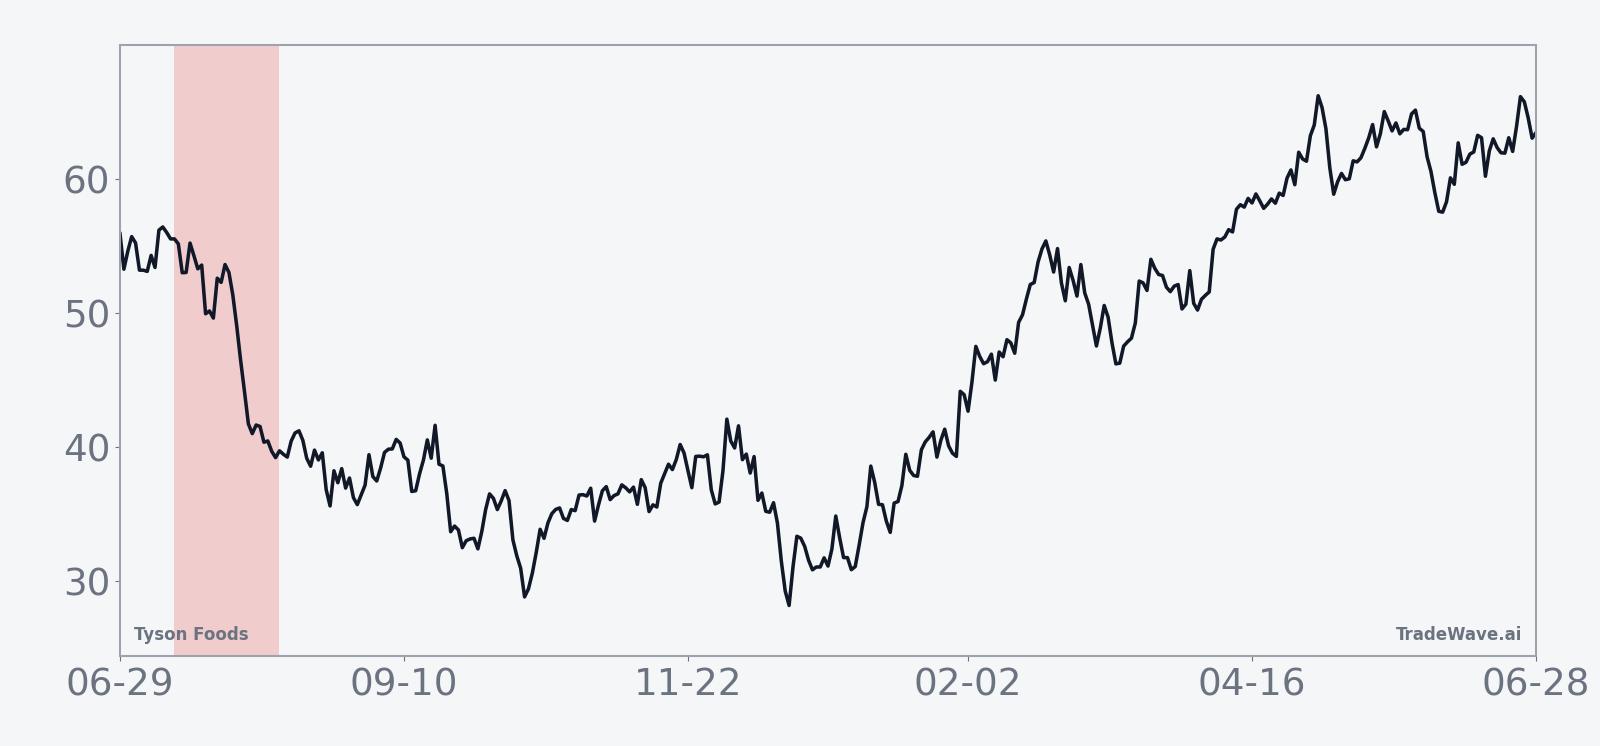
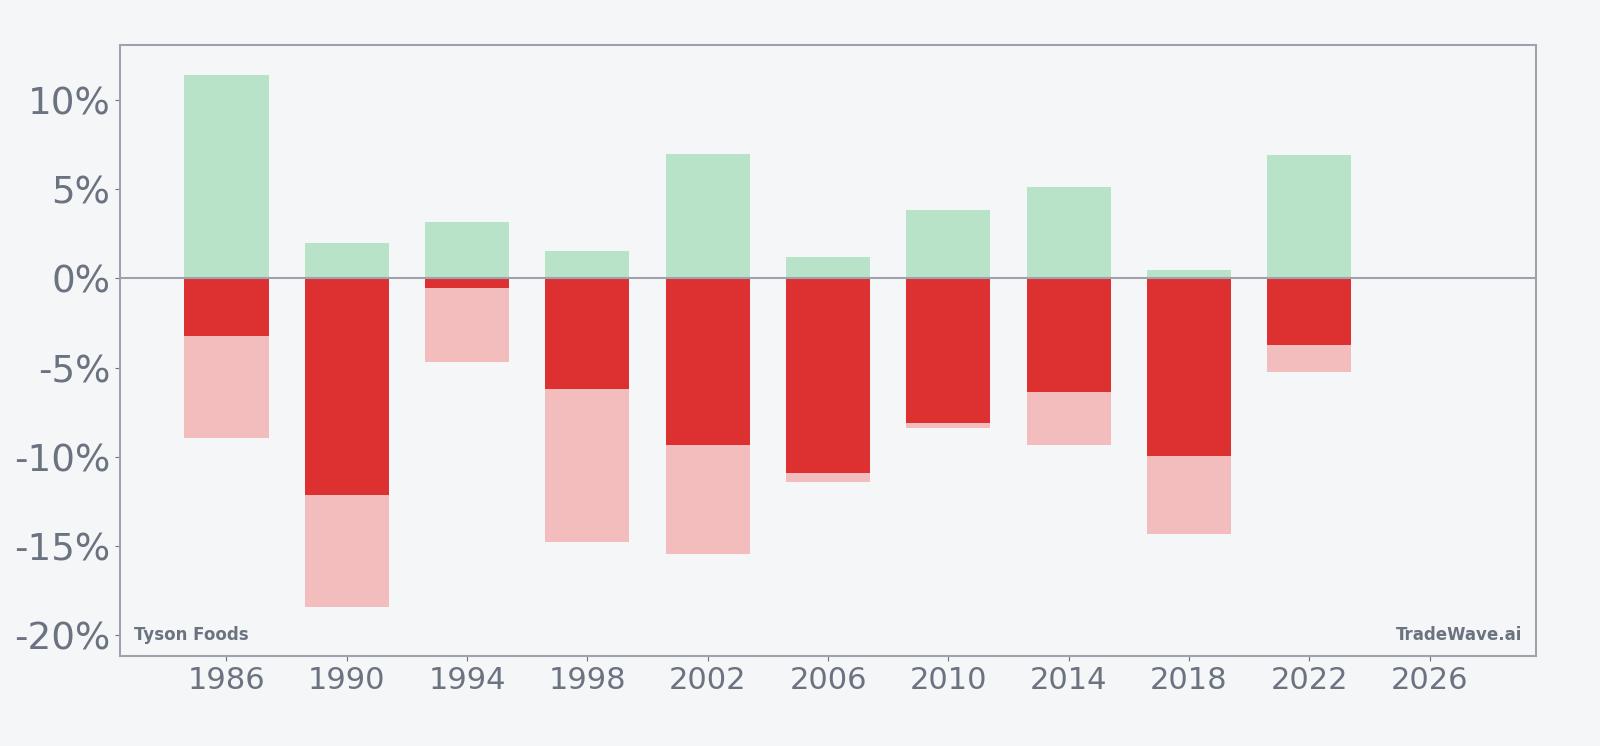
A stacked view of net returns with best and worst intraperiod swings shows how far TSN has tended to move before the window closes.
Grouping by the presidential election cycle matters here because this pattern only looks at the last 10 midterm election years, a phase that often brings policy uncertainty, shifting farm and food regulation debates and changing expectations for consumer spending. In that context, the 100% win rate for the short direction suggests that this specific midterm-year slice has repeatedly lined up with softer TSN price action, even as the broader protein sector has moved through different demand and margin cycles.
Across those 10 years, the average short-side profit of 7.06% and median of 7.24% mean the typical move has not been a small drift. Several cycles, such as 1990 and 2006, saw double-digit percentage declines in the stock over the window, while even the “milder” years still finished with the stock lower at the close of the period. For a short pattern, those are favorable outcomes, and they explain the relatively strong Sharpe ratio of 1.81 for this setup.
The per-year table shows that the best-case intraperiod moves, or maximum favorable excursions, have often been larger than the final net result. In 2002, for example, the short side saw a maximum favorable move of 6.98% before the window ended with a 9.36% gain for the short as TSN continued to weaken into the close. That behavior is consistent with a TradeWave Ratio of 2.37, which measures how far price typically travels in the trade direction within the window, independent of where it finishes.
On the risk side, maximum adverse excursions have not been trivial. Years like 1998 and 2018 saw worst intraperiod drawdowns of 14.77% and 14.34% against the short before the stock ultimately rolled over. For traders, that means the TSN seasonal trend has historically rewarded patience but also demanded tolerance for sharp countertrend rallies inside the window.
The cumulative return chart for this pattern, which aggregates the average path across all 10 midterm-year windows, shows a fairly steady grind lower rather than a single air pocket. The typical TSN seasonal pattern in this stretch has been a choppy but directional slide, with weakness often building as the window progresses rather than resolving in the first few days.
Put together, the message is simple: in the last 10 midterm election years, this 28-day July–August window has been a clean 10-for-10 winner for shorts in Tyson Foods, with meaningful average declines and sizable intraperiod swings.
Why does Tyson Foods (TSN) follow this seasonal pattern?
One likely driver is the way midterm-year policy debates intersect with food inflation and farm policy, which can weigh on sentiment toward meatpackers as investors reassess margin risk. Analysts have also pointed to consumer spending patterns in late summer, when grilling season demand can start to fade just as retailers reset orders and protein processors update guidance for the back half of the year. For Tyson specifically, this window may capture a recurring period when investors refocus on cattle supply constraints, pricing power and the balance between beef and cheaper proteins like chicken.
History does not guarantee future results; adverse excursions can be large even in winning windows, and past TSN seasonal behavior may not repeat in the next cycle.
What is driving Tyson Foods (TSN) today?
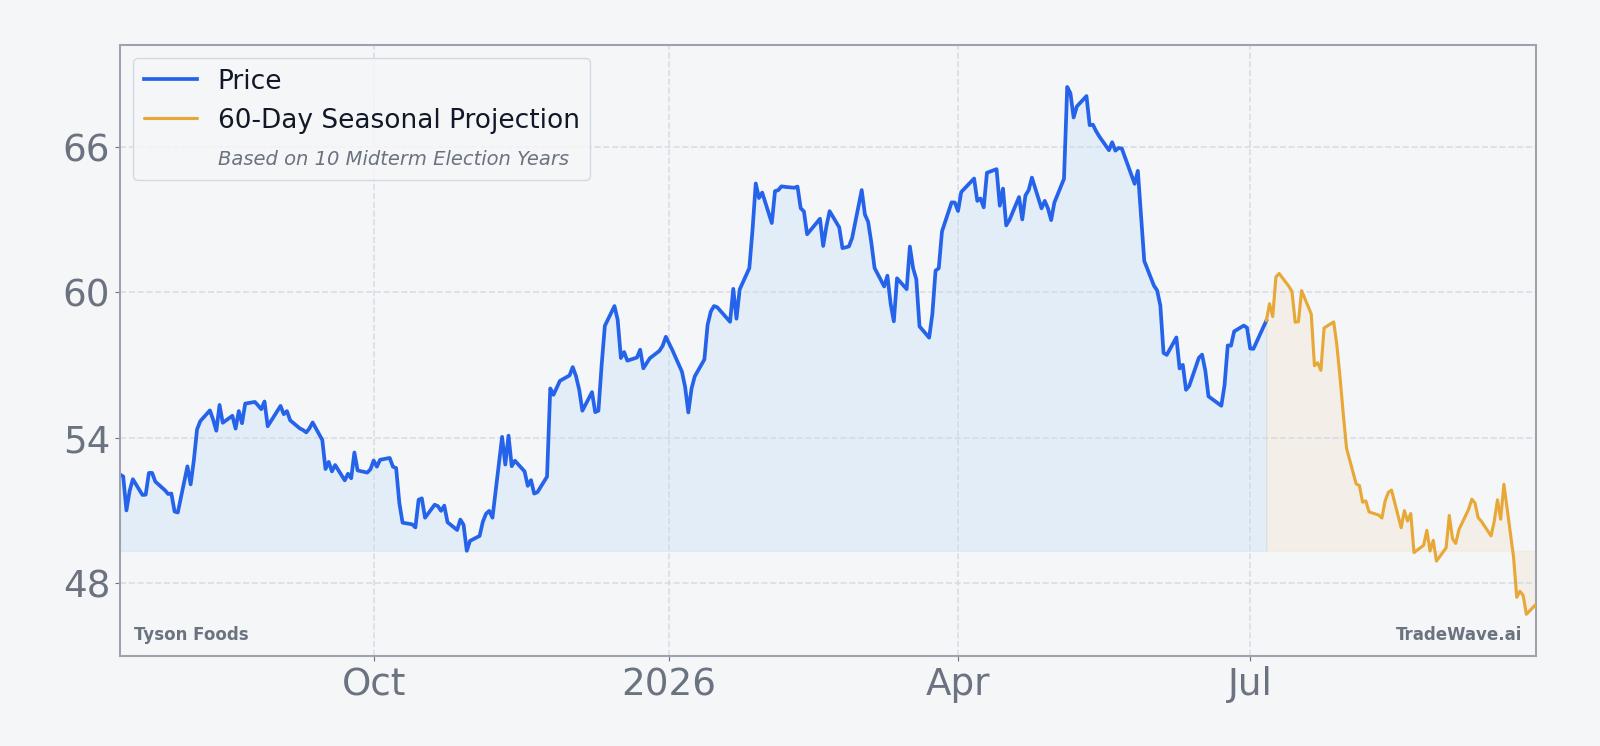
Tyson Foods shares closed Monday at $58.65, up 0.1 on the day, leaving the stock about 14.9% below its 52-week high of roughly $68.32 and about 22.0% above its 52-week low near $48.07. The stock has slipped about 2.26% over the past month, trading below its 50-day moving average of $61.61 on lighter-than-average volume relative to the 20-day norm of roughly 4.0 million shares, a sign that recent weakness has been more of a drift than a rush for the exits.
Fundamentally, the latest catalyst was Tyson’s fiscal second-quarter report on May 4, when the company posted adjusted earnings per share of $0.87, topping the $0.78 consensus, and nudged its adjusted operating income forecast higher to a range of $2.2 billion to $2.4 billion.[1] Rising chicken volumes and better margins helped offset a weaker beef segment, where tight U.S. cattle supplies have squeezed throughput and profitability.[1] That mix has reinforced a broader consumer shift toward cheaper proteins like chicken and pork as record beef prices push shoppers down the value chain.[1]
In November 2025, Tyson forecast that fiscal 2026 revenue would rise 2% to 4%, again leaning on resilient chicken demand to counter beef headwinds.[2] Around the same time, management announced plans to close a beef plant in Lexington, Nebraska, affecting about 3,200 employees, as cattle supplies fell to multi-decade lows and made some facilities uneconomic to run.[3] Those moves underline how exposed Tyson remains to the cattle cycle even as it benefits from structural growth in global meat consumption and steady gains in poultry production.[4]
Strategically, Tyson has been investing in supply chain upgrades and automation, a push that Mizuho highlighted when it initiated coverage with an outperform rating and a $72 price target in March, citing structural growth in protein demand and efficiency gains across the network.[4] Industry-wide, forecasts from organizations such as the OECD and USDA have pointed to rising meat consumption and higher red meat and poultry production over the coming decade, a backdrop that supports Tyson’s long-term volume story even as near-term margins swing with feed costs and livestock availability.[4]
The chart below situates the latest move in its recent multi-month context and overlays a 60-day seasonal projection.
What should traders watch as this Tyson Foods seasonal window approaches?
First, the calendar: the 28-day window begins on Jul 13, 2026, so any sharp move in TSN in the days just before or after that date will be trading directly into a stretch that has historically favored the short side. Traders will be watching whether the stock continues to hover near the middle of its 52-week range or breaks toward either the $68 area on the upside or the high-$40s on the downside as the window opens.
Second, the policy and macro backdrop: midterm election years often bring renewed focus on food inflation, farm subsidies and regulation around meatpacking, all of which can influence sentiment toward Tyson. Any headlines on cattle herd rebuilding, beef pricing or trade policy could either reinforce or blunt the historical TSN seasonal trend if they shift expectations for segment margins.
Third, the protein mix: updates from Tyson or peers on chicken demand, pricing and capacity utilization will matter, especially given the company’s recent reliance on poultry strength to offset beef weakness.[1] If chicken volumes and margins stay firm while beef remains constrained, investors may be more willing to look through a historically soft seasonal stretch; if both sides wobble at once, the pattern’s downside bias could find a more receptive tape.
Finally, behavior inside the window itself will be the real test. A repeat of past cycles would show TSN rallying at times but ultimately finishing the 28 days lower, with intraperiod swings that challenge both bulls and bears. A decisive break above the 50-day moving average with strong volume and sustained follow-through would contradict that history, while a grind lower toward the 52-week low would line up neatly with the 10-for-10 record for shorts. Either way, the upcoming midterm-year summer window gives traders a clear historical map for how Tyson Foods has tended to trade when the calendar looks like this.
Sources
- Reuters: Tyson Foods profit beats estimates on strength in chicken business (May 4, 2026).
- Reuters: Tyson Foods forecasts annual revenue rise as chicken demand offsets beef woes (Nov 10, 2025).
- Reuters: Tyson Foods to close US beef plant as cattle supplies dwindle (Nov 21, 2025).
- Reuters: Meatpacker Tyson Foods raises annual revenue forecast on resilient chicken demand (Aug 4, 2025).
- Forbes: Chicken Sales Soaring Amid High Beef Prices, Tyson Reports (Nov 10, 2025).
- The Wall Street Journal: Tyson Foods Raises Revenue Outlook (Aug 4, 2025).
About this seasonal analysis
Seasonal pattern data is sourced from TradeWave.ai, which analyzes historical price behavior across annual calendar windows going back up to 30 years. Read the full data methodology or the book The 100-Year Pattern by Afshin Moshrefi (2026 edition). Past performance of seasonal patterns does not guarantee future results. This article is for informational purposes only and does not constitute investment advice.