HP Inc. (HPQ) Has Dropped in 9 of 10 Midterm Summer Windows During This 13-Day Span
HP Inc. is heading into a short midterm-election-year seasonal window that has usually meant downside for the stock, even as shares trade near recent highs after a post-earnings surge.

What is the seasonal pattern for HP Inc. (HPQ)?
HP Inc. has fallen in 9 of 10 midterm-election-year summer windows during this 13-day stretch, with an average 4.5% gain in winning years for the short side.
- 9 for 10 in this window, with the short side averaging 4.5% gains in winning years.
- The 13-day trading window begins Jun 21 and has been a historically bearish HPQ seasonal trend in midterm election years.
- Percent Profitable is 90%, with 9 winners and 1 loser for the short setup across the last 10 midterm-election-year samples.
- Avg Profit is 4.5% for winning years, while Avg Profit - All, including the lone losing year, is still a solid 4%.
- Intraperiod swings have been meaningful, with several years showing double-digit worst drawdowns for longs, underscoring elevated downside risk in this HP Inc. trading window.
- The pattern sits inside the midterm election year phase, where policy uncertainty and PC demand shifts often amplify volatility for hardware names like HPQ.
According to historical data from TradeWave.ai, this upcoming midterm-year stretch has behaved very differently from an average June or July for HPQ. The next section walks through how that election-cycle pattern has played out in prior decades and what it implies for the weeks ahead.
How has HP Inc. (HPQ) traded in this midterm-year June window?
HP Inc. has fallen in 9 of the last 10 midterm-election-year runs through this 13-day June window, with the short side posting an average 4.5% gain in winning years. Today the stock closed at 23.66, up about 2.0% on the session and roughly 18.3% below its 52-week high of 28.94, after a strong rebound over the past month. That combination of a firm tape and a historically weak slice of the calendar sets up a clean test of whether the HPQ seasonal pattern still matters in a PC cycle dominated by AI and Windows 11 refresh demand.
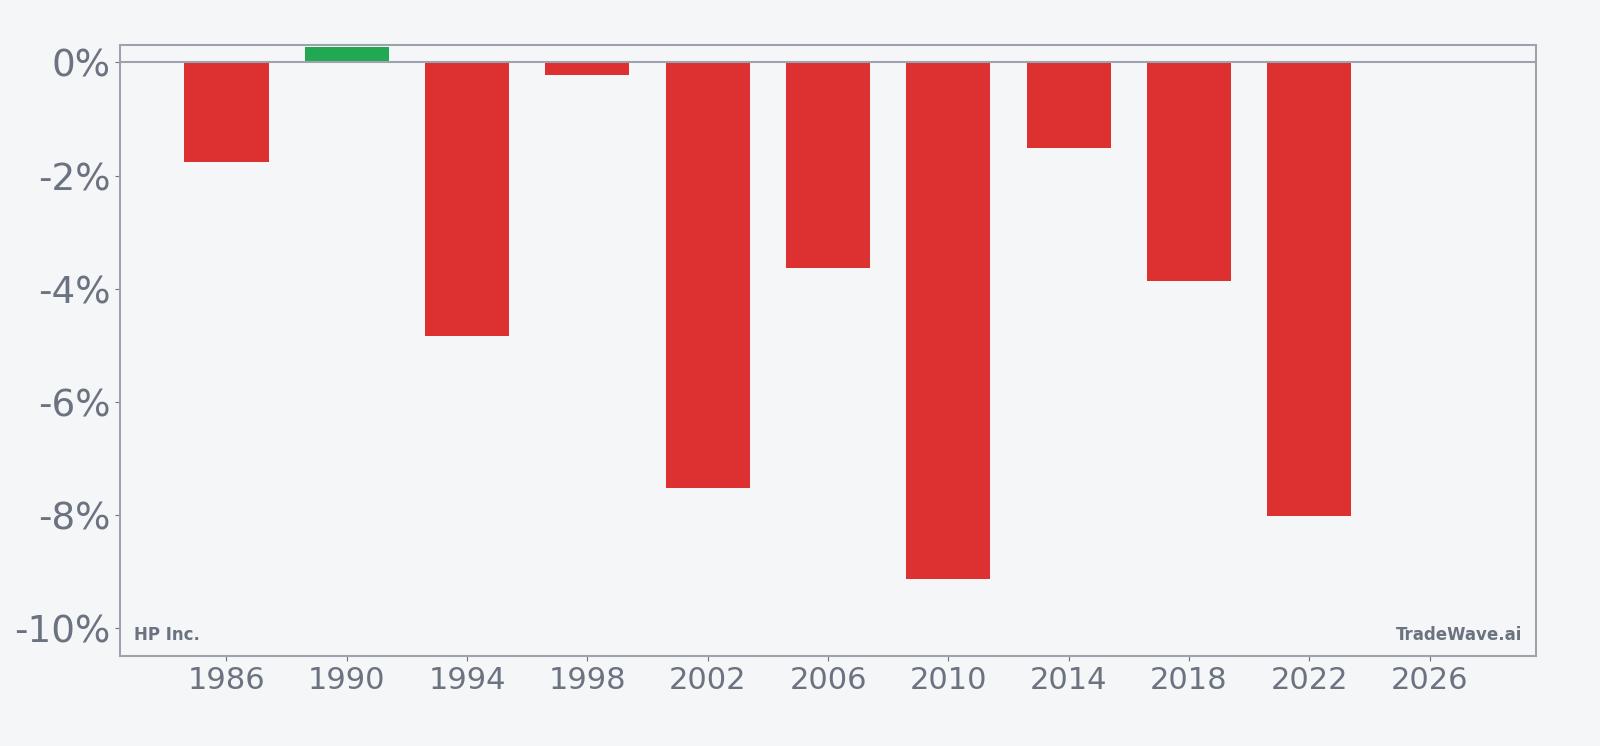
Because this pattern is grouped by the presidential election cycle, it only looks at the last 10 midterm election years, not ten consecutive calendar years. That matters for HPQ because midterm years often feature tighter fiscal debates, shifting regulation and more cautious corporate spending, all of which can hit PC and printer budgets just as CIOs are deciding how aggressively to refresh fleets.
This seasonal window begins on Jun 21 and spans 13 trading days. Historically, during this period, HP Inc. has tended to drift lower, which is favorable for the short trade direction that the pattern tracks. Across those 10 midterm-year samples, 9 were profitable for shorts and only 1 produced a loss, giving a 90% Percent Profitable reading with 9 winners and 1 loser.
In winning years, the average move in the trade direction was 4.5%, while including the lone losing year pulls the all-years average to 4%. That gap between Avg Profit and Avg Profit - All is small, which suggests the outlier loss was not large enough to erase the typical downside drift. For a short setup, those numbers describe a window where HPQ has usually offered a clean, directional slide rather than a coin-flip chop.
The per-year table shows how that has played out in practice. In 2010, for example, HPQ dropped 9.13% over the window, while in 2022 it fell 8.02%, both strong years for the short side. The weakest outcome for shorts came in 1990, when the stock edged up 0.27% over the period, a modest loss relative to the stronger down years.
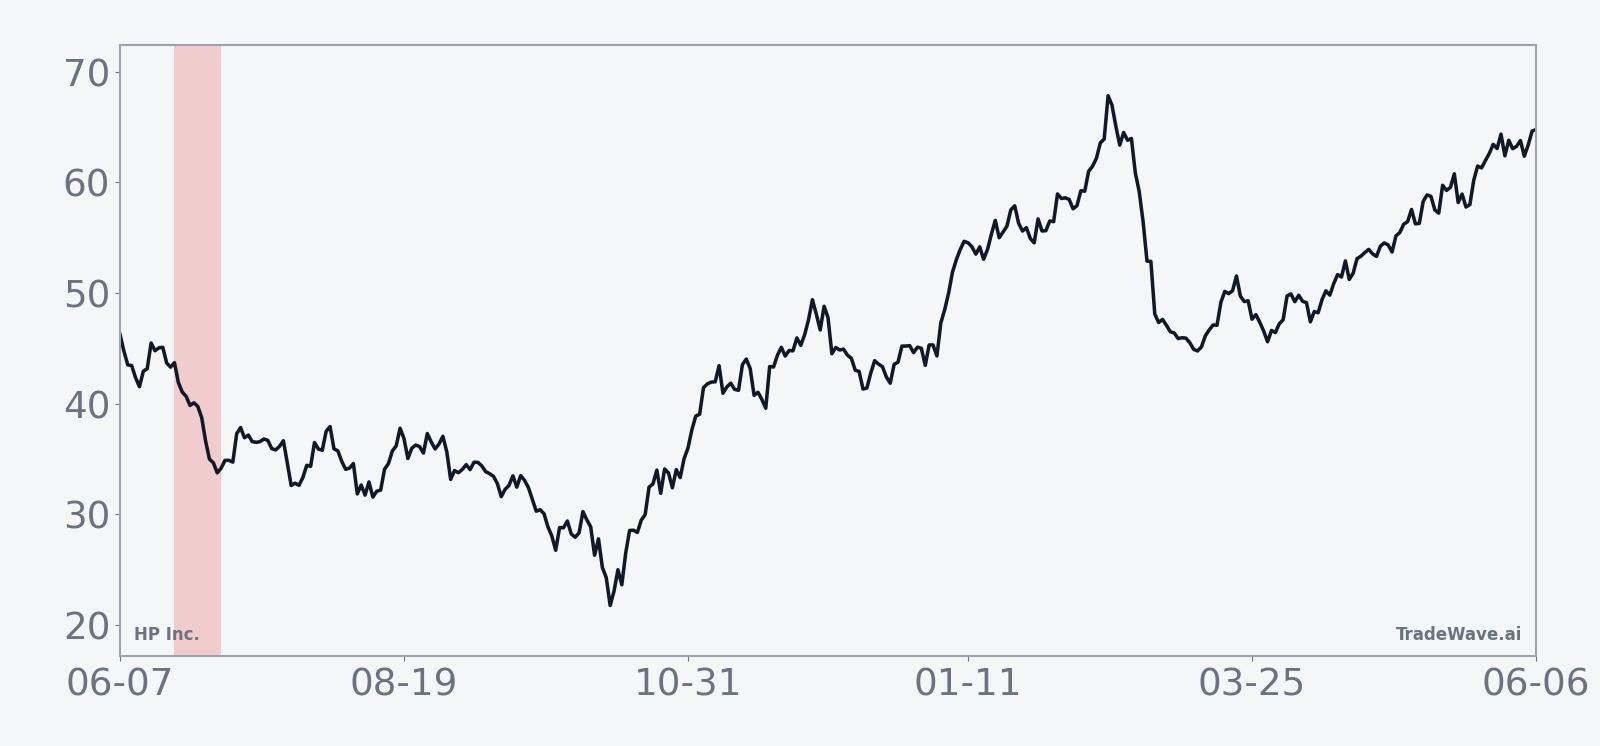
The historical seasonal average trend line slopes steadily lower through most of the 13-day span, with only brief pauses. That suggests the typical pattern has been a grind down rather than a sharp one-day shock, which can matter for traders thinking about how to stage entries and exits around the window.
The next chart layers net results with the best and worst intraperiod swings to show how far HPQ has tended to move inside the window.
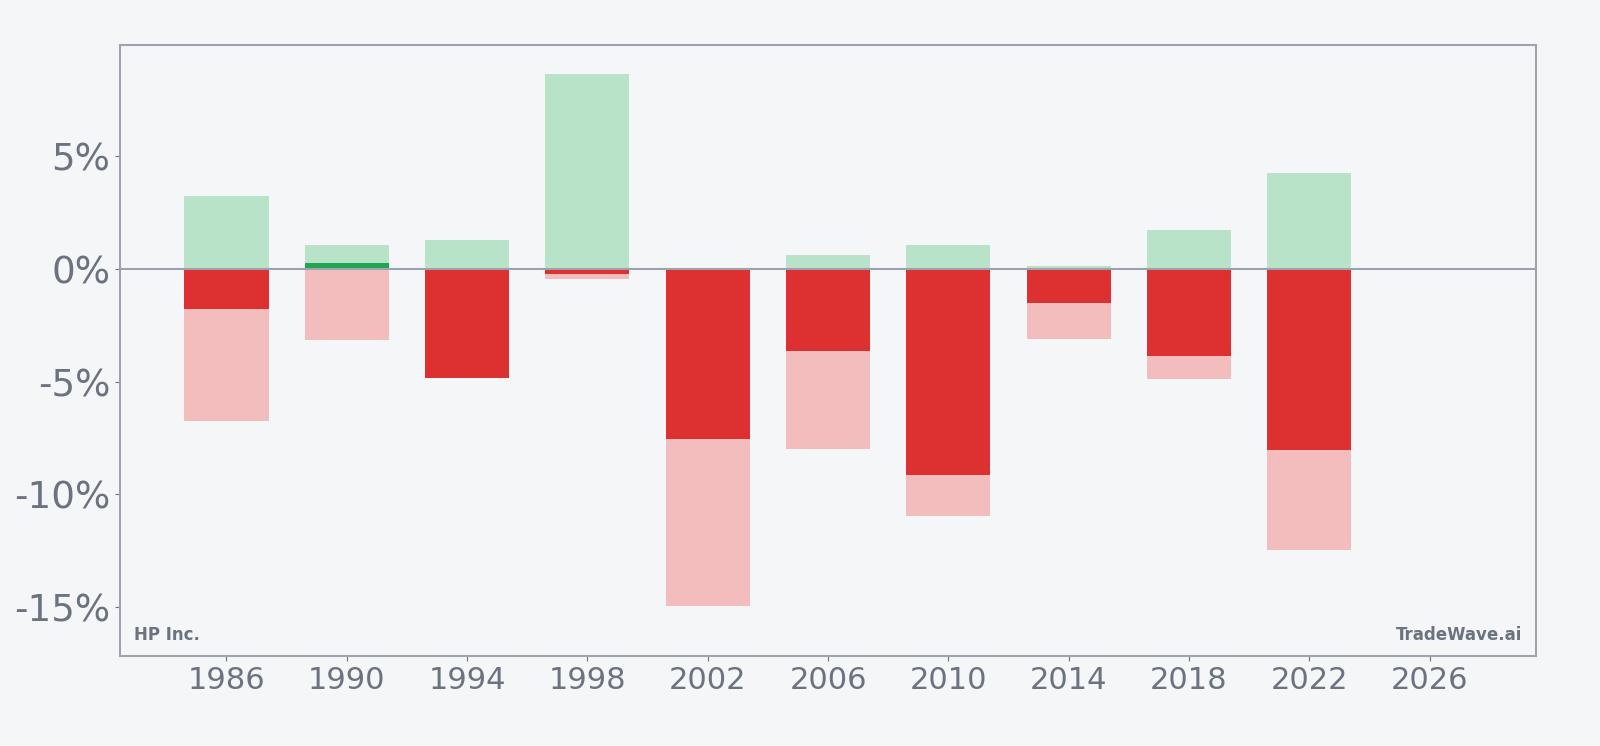
The bars with maximum favorable and adverse excursions show that in several years HPQ moved far in both directions before settling lower. In 2002, for instance, the worst intraperiod drawdown for longs reached about 14.94% while the best rally attempt still left the stock down 7.53% by the close of the window. In 2010, the worst drawdown from entry was 10.94% even as the best countertrend bounce only reached 1.03%, again ending with a sizable net loss for longs. That mix of large maximum adverse excursions and more modest maximum favorable moves is what the 1.48 TradeWave Ratio is capturing for this short pattern.
Put together, the record is clear: in the last 10 midterm election years, this short June window has favored bears in 9 of 10 cases, with several double-digit downside swings along the way.
Why does HP Inc. (HPQ) follow this seasonal pattern?
One likely driver is the way corporate PC and printer budgets get revisited midyear in the midterm election cycle, as CIOs weigh policy risk and macro headlines before committing to big refresh orders. Analysts have also pointed to the timing of HP’s fiscal calendar, where guidance updates and supply-chain commentary around this period can reset expectations for the back half of the year. The pattern may also reflect broader sector rotation, with investors trimming hardware exposure in early summer midterm years as they reassess growth and margin assumptions.
History does not guarantee future results; adverse excursions can be large even in winning windows, so traders should treat this pattern as context rather than a forecast.
What is driving HP Inc. (HPQ) today?
HPQ finished Friday at 23.66, up 2.0% on the day, after trading between 22.88 and 23.70 on volume of about 10.8 million shares, below its 20-day average of roughly 25.8 million. The stock is up 14.3% over the past month and sits above its 50-day moving average of 21.86, but still about 18.3% below its 52-week high, leaving room on both sides of the tape as the seasonal window approaches.
In May 2026, CNBC reported that HP shares jumped by double digits after the company delivered an earnings and revenue beat, a reminder that the stock can move sharply when expectations reset around PC demand and margins.[1] Earlier, in Aug 2025, Reuters highlighted how HP’s Q3 revenue topped estimates on the back of AI-powered PC adoption and the Windows 11 upgrade cycle, even as printing revenue slipped.[2] That mix of a structurally challenged print business and a more cyclical PC segment tied to operating-system refreshes and AI features keeps HPQ sensitive to both macro data and product-cycle headlines.
On the macro side, HP has warned that memory chip cost volatility and evolving U.S. trade regulations could weigh on forecasts, while still pointing to support from the Windows 11 refresh and AI PC demand.[3] Those cross-currents mean that into late June and early July, traders will be balancing a constructive product story against cost and shipment headwinds, all inside a midterm-year seasonal window that has historically leaned bearish for the stock.
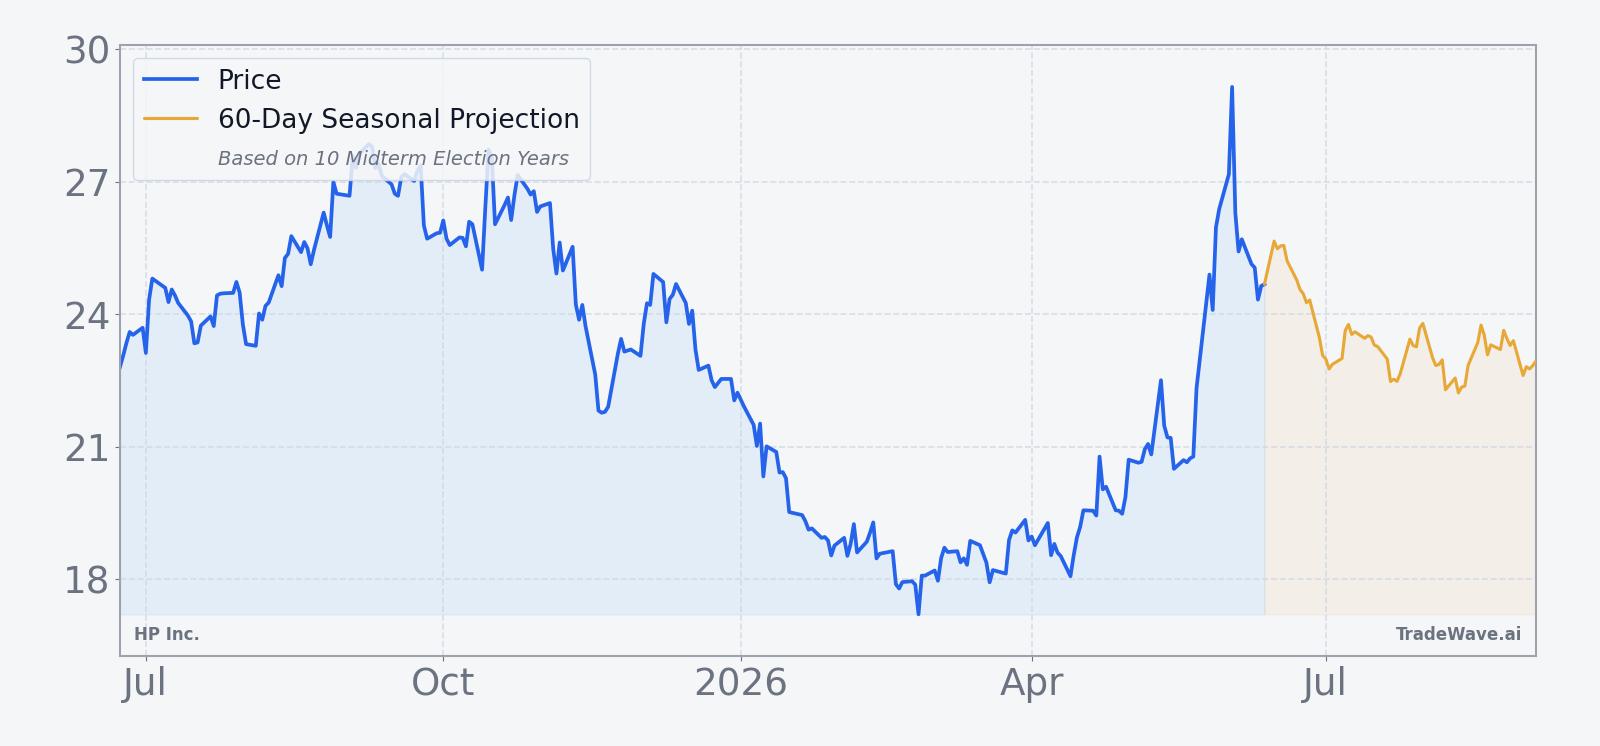
The chart below situates the latest rebound and the upcoming 13-day window against HPQ’s past year of trading and a 60-day seasonal projection.
What should traders watch in this HPQ seasonal window?
First, the calendar: the 13-day window starting Jun 21 sits in the mid part of the midterm election year, when policy debates around spending, trade and regulation often intensify. Any fresh commentary from HP on PC shipments, AI PC adoption or memory costs could either reinforce or blunt the historical downside bias if it lands inside the window.
Second, price levels matter. On the upside, traders will be watching how HPQ behaves around the recent swing high near 24 and, beyond that, whether it can make a run toward the 52-week high near 29. On the downside, the 50-day moving average around 21.86 and the low 20s have been recent support zones; a break through those levels during the window would be more in line with the historical short pattern.
Third, volatility and volume will be key tells. The historical record shows that in several years HPQ has seen double-digit intraperiod drawdowns for longs during this window, even when the final net move was smaller. If this year’s window features expanding ranges and heavier volume on down days, that would rhyme with the past pattern. A quiet, low-volume drift higher would instead look more like the rare losing year for the short side.
Finally, traders should keep an eye on the policy and macro calendar. Any new signals on U.S. trade rules, memory chip supply or corporate IT spending could quickly change how investors price HP’s fiscal 2026 guidance and beyond.[3] If those headlines arrive during the 13-day stretch and coincide with weakness in HPQ, it would fit the historical script of midterm-year policy uncertainty amplifying this specific seasonal window.
Sources
About this seasonal analysis
Seasonal pattern data is sourced from TradeWave.ai, which analyzes historical price behavior across annual calendar windows going back up to 30 years. Read the full data methodology or the book The 100-Year Pattern by Afshin Moshrefi (2026 edition). Past performance of seasonal patterns does not guarantee future results. This article is for informational purposes only and does not constitute investment advice.