This 22-Day Midterm July Window Has Delivered 100% Short-Side Winners in Garmin (GRMN)
Garmin is approaching a historically bearish 22-day July window even as shares hover near record highs, putting a strong fitness wearables story up against a rare clean seasonal streak.
Price as of Jul 2, 2026: $240.02 (last close).

What is the seasonal pattern for Garmin (GRMN)?
Garmin has fallen in 6 of 6 midterm-election-year July windows during this 22-day stretch, with an average gain of 4.1% for short positions in winning years.
- 6 for 6 in this window, with short trades averaging 4.1% gains across the last six midterm election years.
- The upcoming 22-day Garmin trading window starts Jul 7 and has historically favored downside in midterm years.
- Percent Profitable is 100%, with 6 winners and 0 losers for the short-side seasonal pattern.
- Average winner profit of 4.1% comes with a Sharpe ratio of 1.43, indicating solid risk-adjusted returns for the setup.
- The TradeWave Ratio of 1.6 suggests price typically travels meaningfully in the trade direction within the window before it closes.
- Past years show adverse moves against the short can still be sharp, so intraperiod drawdowns remain a key risk even in a perfect record window.
According to historical data from TradeWave.ai, this midterm-election-year July stretch has behaved very differently from an average month for Garmin. The next section walks through how that pattern has played out and what it could mean for the coming weeks.
How has Garmin (GRMN) traded in this midterm-year July window?
Garmin has delivered short-side gains in every one of the last six midterm-election-year July windows, with an average profit of 4.1% over 22 calendar days. Shares finished the prior session at 240.02, up 1.0% on the day and about 11.4% below their 52-week high of 270.91, leaving the stock elevated but off peak levels as this pattern comes back into play.
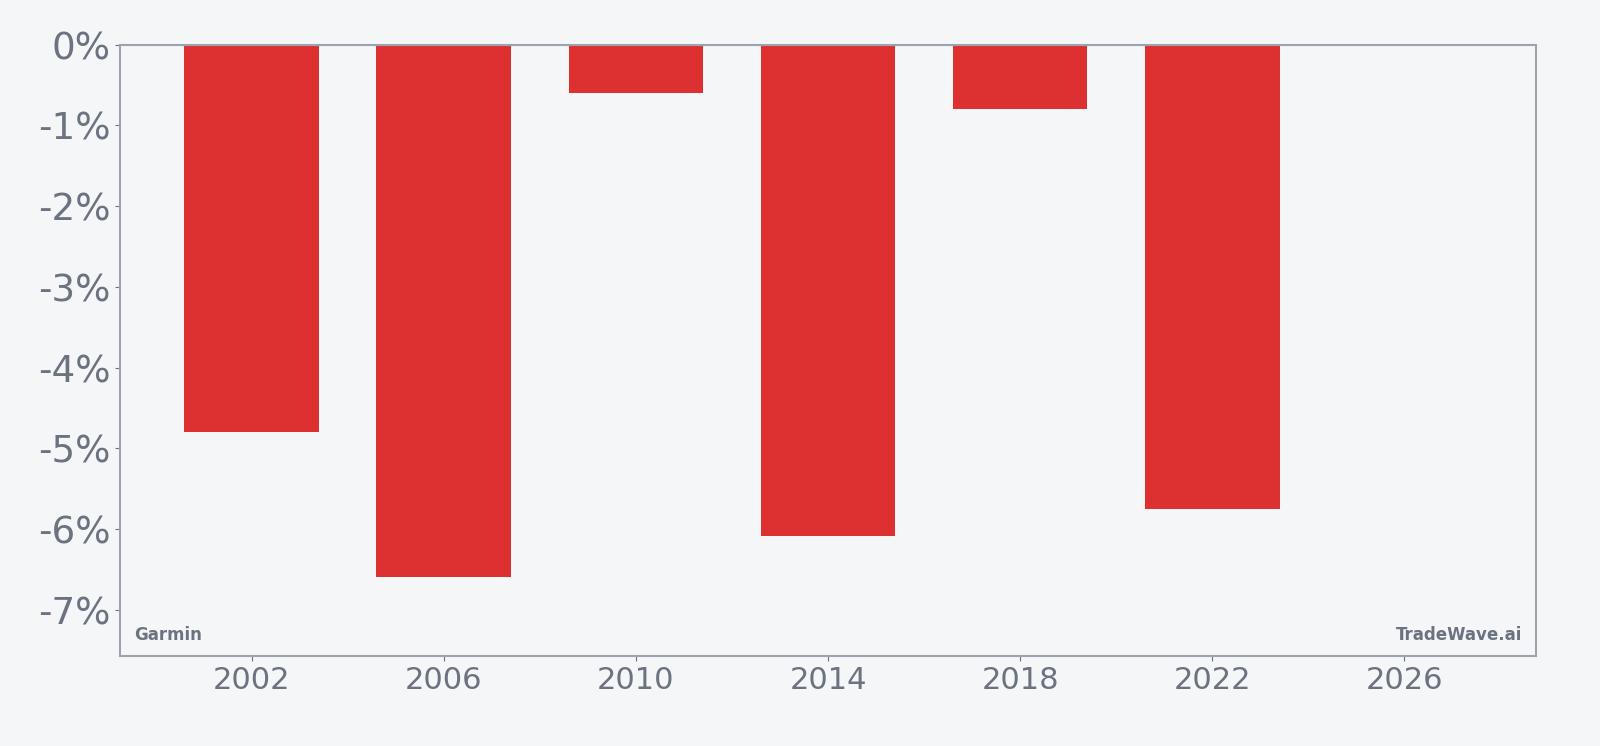
Because this pattern is grouped by the presidential election cycle, it only looks at Garmin’s behavior in the last six midterm election years, not in every calendar year. That matters in 2026, which is itself a midterm election year, so the upcoming Jul 7 start date lines up with the same policy and positioning backdrop that framed prior iterations of this window.
Historically, the trade direction here is short. In each of the six midterm-election-year samples, Garmin finished the 22-day stretch lower, which translated into a 100% win rate for traders positioned for downside. The median profit on those short trades was 5.28%, slightly above the 4.1% average, which hints that a couple of softer years pulled the mean down but did not break the pattern.
The per-year table shows how that has played out in practice. In 2002, a short entered around 5.13 and exited near 4.89, a net move of about 4.8% in favor of the trade. In 2014, the stock dropped roughly 6.1% over the window, while 2022 delivered a 5.75% decline from an entry near 95.58 to an exit around 90.09. Even the weakest year for the pattern, 2010, still produced a modest 0.6% gain for shorts.
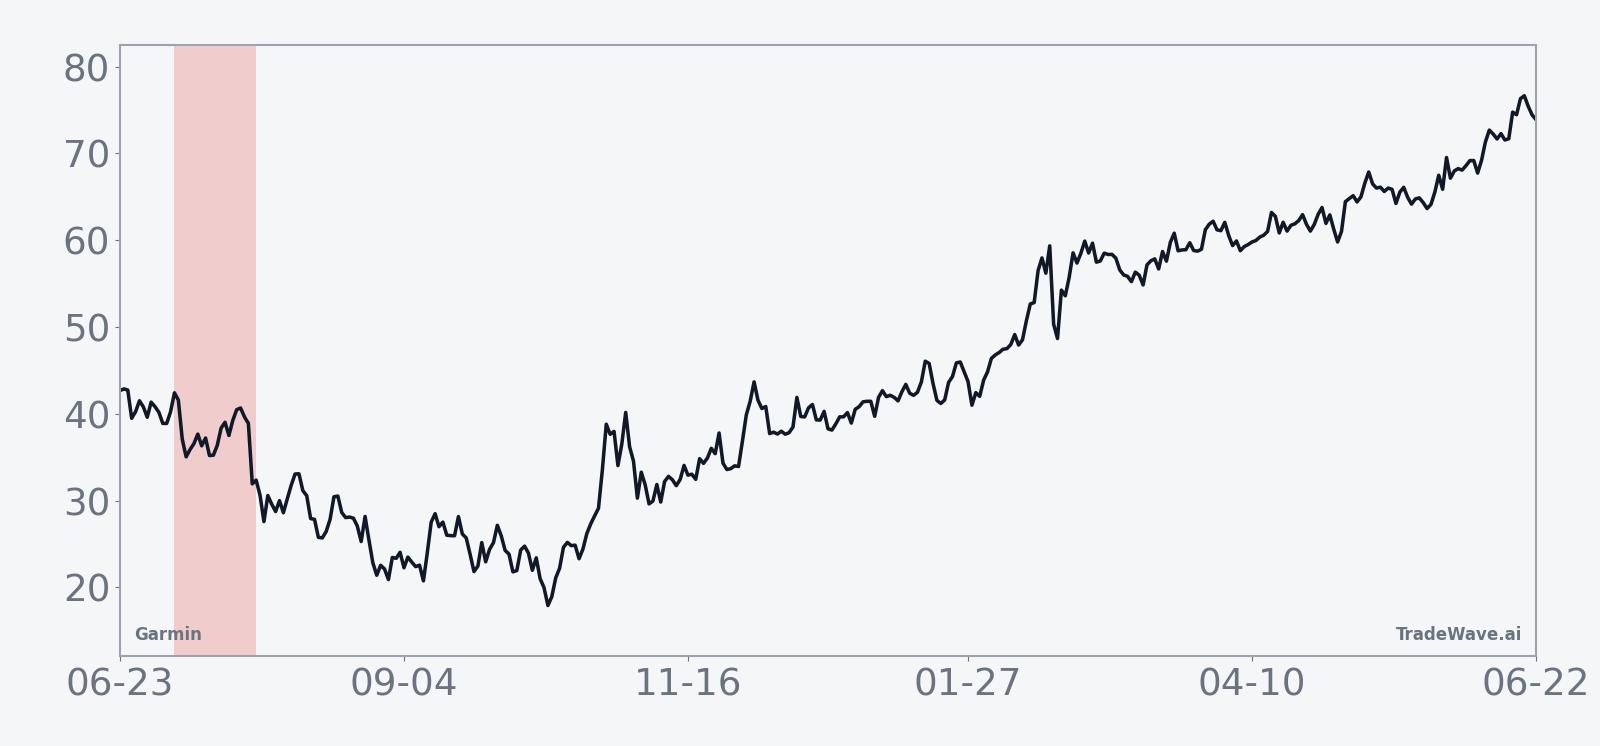
The historical seasonal average suggests that much of the downside in this Garmin trading window tends to accrue steadily rather than in a single air pocket. The trend chart leans lower across the 22 days, with only brief countertrend bounces, which fits a pattern of grinding weakness rather than a one-day shock.
The combined net, best-case and worst-case moves by year show how far Garmin has swung inside this window before closing.
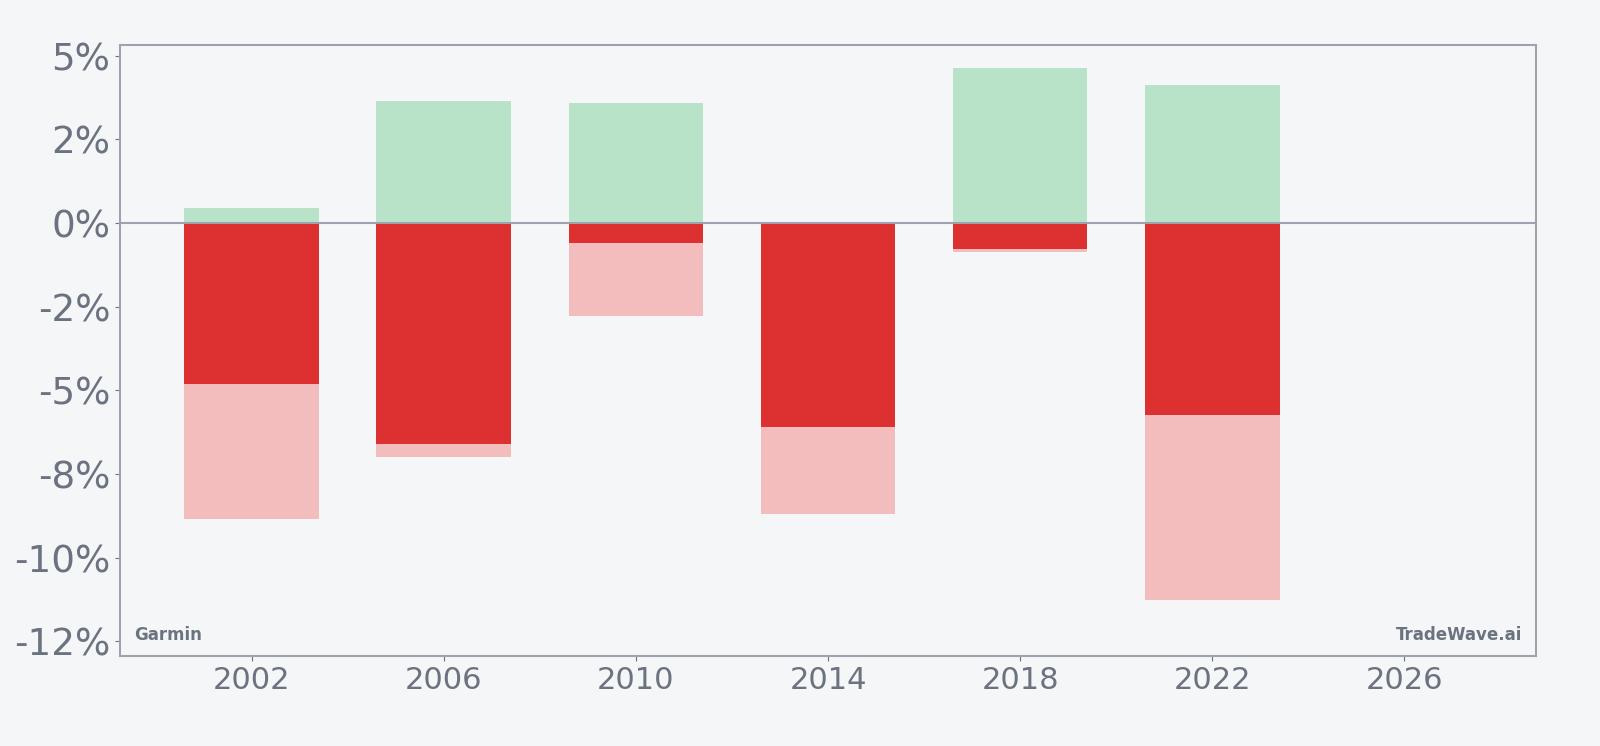
The maximum favorable excursion, or best intraperiod move in the trade direction, has often been larger than the final net profit, which is what the 1.6 TradeWave Ratio is flagging. In several years, shorts saw Garmin move 7% to 11% in their favor at some point during the window before partial reversals trimmed the final gain. At the same time, maximum adverse excursions have been meaningful, with drawdowns against the short reaching roughly 7% to 11% in tougher years like 2002 and 2022.
Put together, the pattern is clear: this midterm-year July window has favored short exposure in 6 of 6 cycles, with consistent but sometimes bumpy downside for Garmin.
History does not guarantee future results; adverse excursions can still be large even in windows where every historical trade finished profitable.
Why does Garmin (GRMN) follow this seasonal pattern?
One likely driver is the way midyear trading lines up with the presidential election cycle and portfolio rebalancing. Midterm election years often see investors rotate within consumer and tech names as policy risk and spending priorities come into sharper focus, which can pressure high-flying growth stories. For Garmin, that may intersect with summer demand patterns in fitness wearables and outdoor devices, where expectations can run hot after spring product cycles and then cool as investors wait for fall launches and the broader holiday spending season.
What is driving Garmin (GRMN) today?
Garmin closed the prior session at 240.02, up 1.0% on the day, extending a one-month gain of 1.77% and leaving the stock about 11.4% below its 52-week high of 270.91. Trading volume of roughly 500,000 shares came in below the 20-day average of about 889,000, suggesting the latest move has been more of a steady grind than a momentum spike.
Fundamentally, the backdrop remains constructive. On Feb 18, 2026, Garmin reported better-than-expected fourth-quarter earnings, raised its dividend, authorized a $500 million buyback and issued a strong 2026 forecast tied to robust demand for fitness products.[1] That followed a Sep 3, 2025 launch of the Fenix 8 Pro, a high-end sports watch with satellite and cellular features aimed at the premium end of the fitness wearables market, positioned directly against Apple’s upgrade cycle.[2] Together, those moves have reinforced Garmin’s role as a durable player in fitness wearables and consumer tech, even as the stock’s sharp run over the past year leaves less obvious valuation slack.
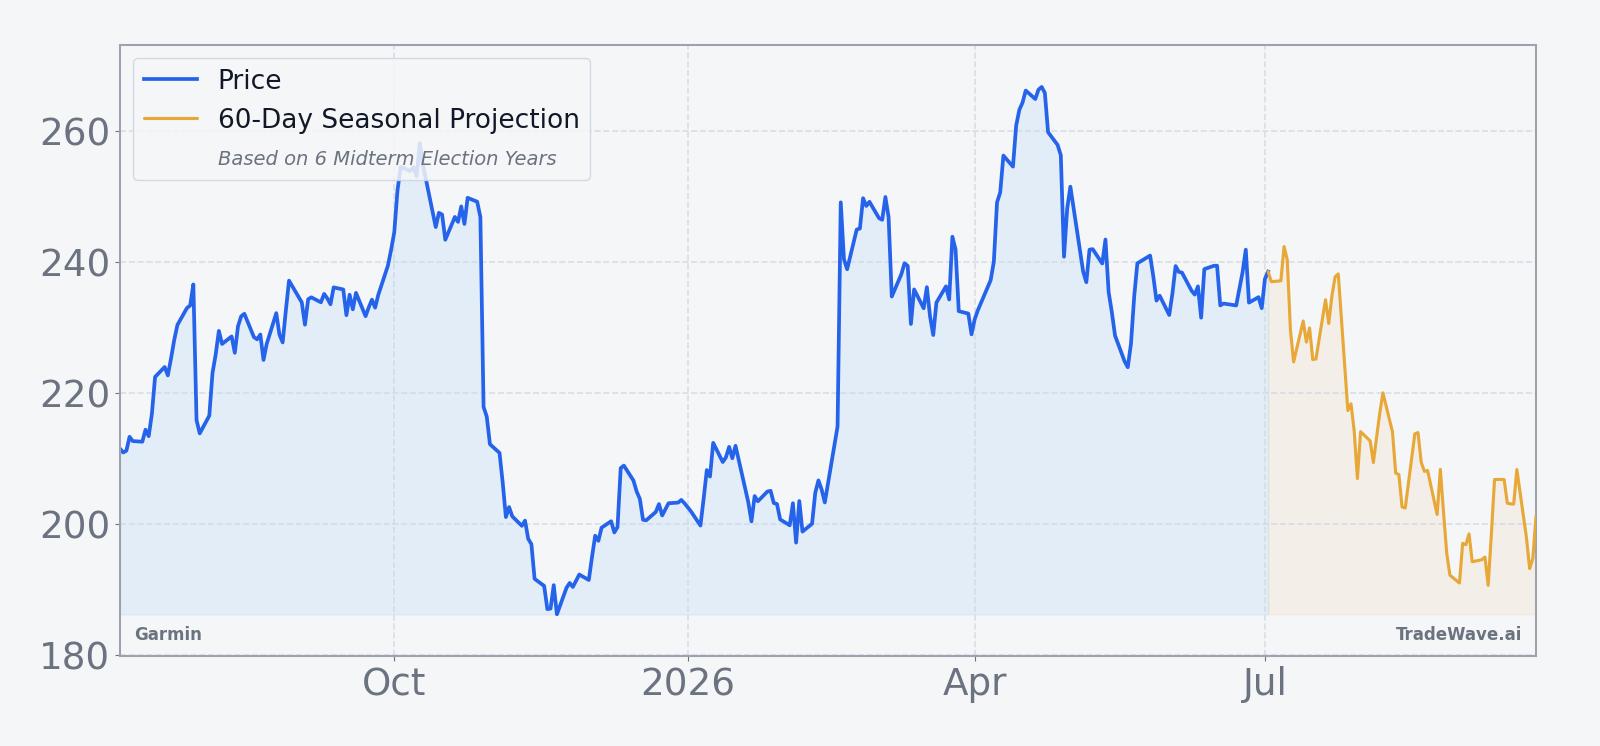
The chart below situates the latest move in its recent multi-month context alongside a 60-day seasonal projection.
What should traders watch as this Garmin seasonal window opens?
First, the calendar. The 22-day midterm-year July window begins on Jul 7 and runs into early August, overlapping a period when investors will be looking ahead to Garmin’s next earnings update and any hints on the durability of its fitness wearables demand. Price behavior inside that band will show whether the 6-for-6 short-side record remains intact or finally breaks.
Second, levels. With Garmin about 11.4% below its 52-week high and still above its 50-day moving average near 237.90, traders will be watching whether the stock holds that short-term trend line or starts to slip back toward prior consolidation zones. A controlled drift lower that respects the historical pattern would fit the past midterm-year script, while a decisive breakout to new highs during the window would mark the first clear failure of this specific seasonal trend.
Third, catalysts. Any updates on product momentum in the Fenix 8 Pro line or broader fitness wearables demand could either reinforce or offset the seasonal bias.[2] Strong commentary on sell-through or new feature roadmaps might blunt the typical July softness, while signs of saturation or tougher competition could amplify it.
Finally, volatility. The historical MFE and MAE profile shows that even in winning years, Garmin has often swung several percentage points both for and against the short before the window closed. Traders watching this GRMN seasonal trend will be focused not just on the final direction, but on how quickly intraday and intraweek swings build once the window opens and whether those swings cluster around earnings headlines or broader moves in consumer tech.
Sources
- CNBC: Garmin posts strong Q4 and issues strong 2026 forecast (Feb 18, 2026)
- Bloomberg: Garmin debuts Fenix 8 Pro high-end sports watch (Sep 3, 2025)
About this seasonal analysis
Seasonal pattern data is sourced from TradeWave.ai, which analyzes historical price behavior across annual calendar windows going back up to 30 years. Read the full data methodology or the book The 100-Year Pattern by Afshin Moshrefi (2026 edition). Past performance of seasonal patterns does not guarantee future results. This article is for informational purposes only and does not constitute investment advice.