Trade Shifts and Memory Costs Pressure HP Inc. (HPQ) Just as a Bullish Midterm Stretch Begins
HP Inc. is entering a 227-day midterm-election-year seasonal window that has usually rewarded long positions, even as the stock trades well below its 52-week high.
Price as of Jul 2, 2026: $21.93 (last close).

What is the seasonal pattern for HP Inc. (HPQ)?
HP Inc. has risen in 7 of 8 midterm-election-year windows starting in early July, with an average gain of 21.29% in winning years.
- 7 wins and 1 loss in this 227-day midterm-year window, with winning years averaging 21.29% gains.
- Percent Profitable is 88%, with 7 winners and just 1 loser across the last 8 midterm election years.
- Including the lone losing year, Avg Profit - All still comes in at a strong 18% for this HPQ seasonal trend.
- The best year in this HP Inc. trading window saw a 43.74% net gain, while the weakest finished down 1.87%.
- Intraperiod swings have been meaningful, with some years showing adverse moves near 30% before recovering.
- The TradeWave Ratio of 1.92 and Sharpe ratio of 1.07 point to a historically favorable long setup in this window.
According to historical data from TradeWave.ai, this midterm-election-year stretch for HP Inc. has behaved very differently from an average calendar period, and the next iteration begins today.
How has HP Inc. (HPQ) traded in this midterm-year seasonal window?
HP Inc. has risen in 7 of the last 8 midterm election years during the 227 calendar days that start around Jul 3, averaging 21.29% gains in winning years. The stock closed Friday at 21.93, down 0.4% on the day and about 24.2% below its 52-week high of 28.94, leaving plenty of room between current levels and prior peaks. That combination of a historically strong HPQ seasonal pattern and a stock trading well off its highs gives this window more weight than a typical calendar stretch.
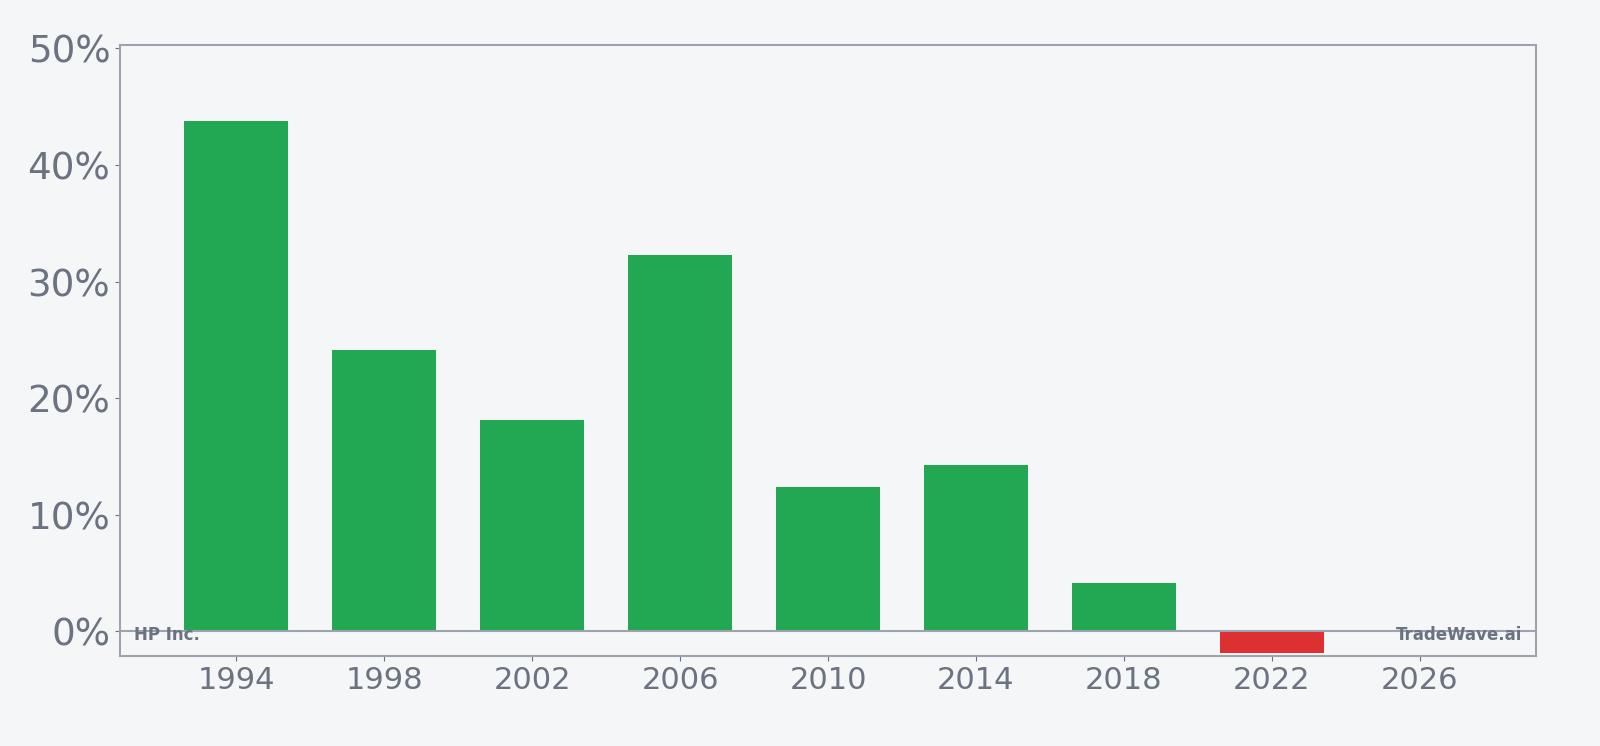
Because this pattern is grouped by the presidential election cycle, it only looks at HPQ behavior in the midterm election year, which is often a policy-heavy stretch as Washington debates spending, regulation and trade. That focus matters for a hardware and PC name like HP Inc., where government procurement, tariffs and tech regulation can all shift investor positioning around the same points in the four-year cycle.
Across the last eight midterm election years, HP Inc. has delivered a cumulative return of 265% in this window, with an annualized return of 17.6% and a median gain of 16.18%. The trade direction is long, and the high Percent Profitable figure means most of these midterm-year slices have rewarded staying on the long side rather than trying to fade rallies. Even when you include the one losing year, the all-years average of 18% is still robust for a single 227-day stretch.
The per-year breakdown shows how that plays out. The strongest run came in 1994, when HPQ gained 43.74% between the early-July entry and the end of the window, with a maximum favorable move of 46.29% and only a shallow 2.7% worst drawdown along the way. At the other end of the spectrum, 2022 finished down 1.87% despite an 11.98% peak run-up, and it carried a maximum adverse move of 22.98%, a reminder that even “good” seasonal regimes can be bumpy.
The typical path inside the window has been to grind higher rather than spike in a single burst. Trend statistics show more short-term pullbacks than straight-line advances, but the longer-term trend count favors the long side, with Trend Long at 7 versus Trend Short at 37 on the primary measure and a similar skew on the shorter lookback. That mix points to a choppy but upward-sloping HPQ seasonal trend where dips have often been bought over the course of the midterm-year window.
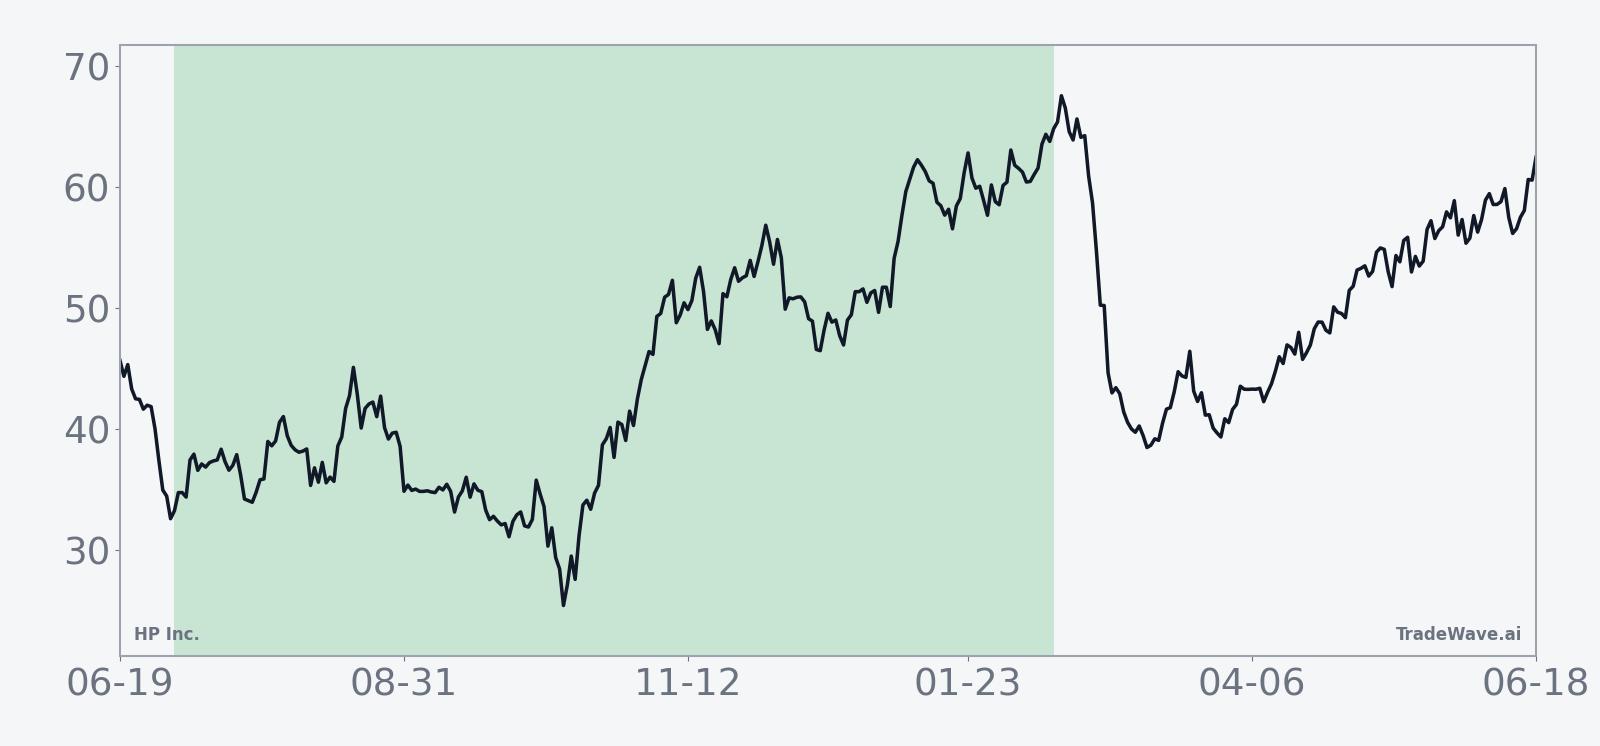
Year-by-year bars with intraperiod swings show how much HPQ has typically moved in both directions before the window closes.
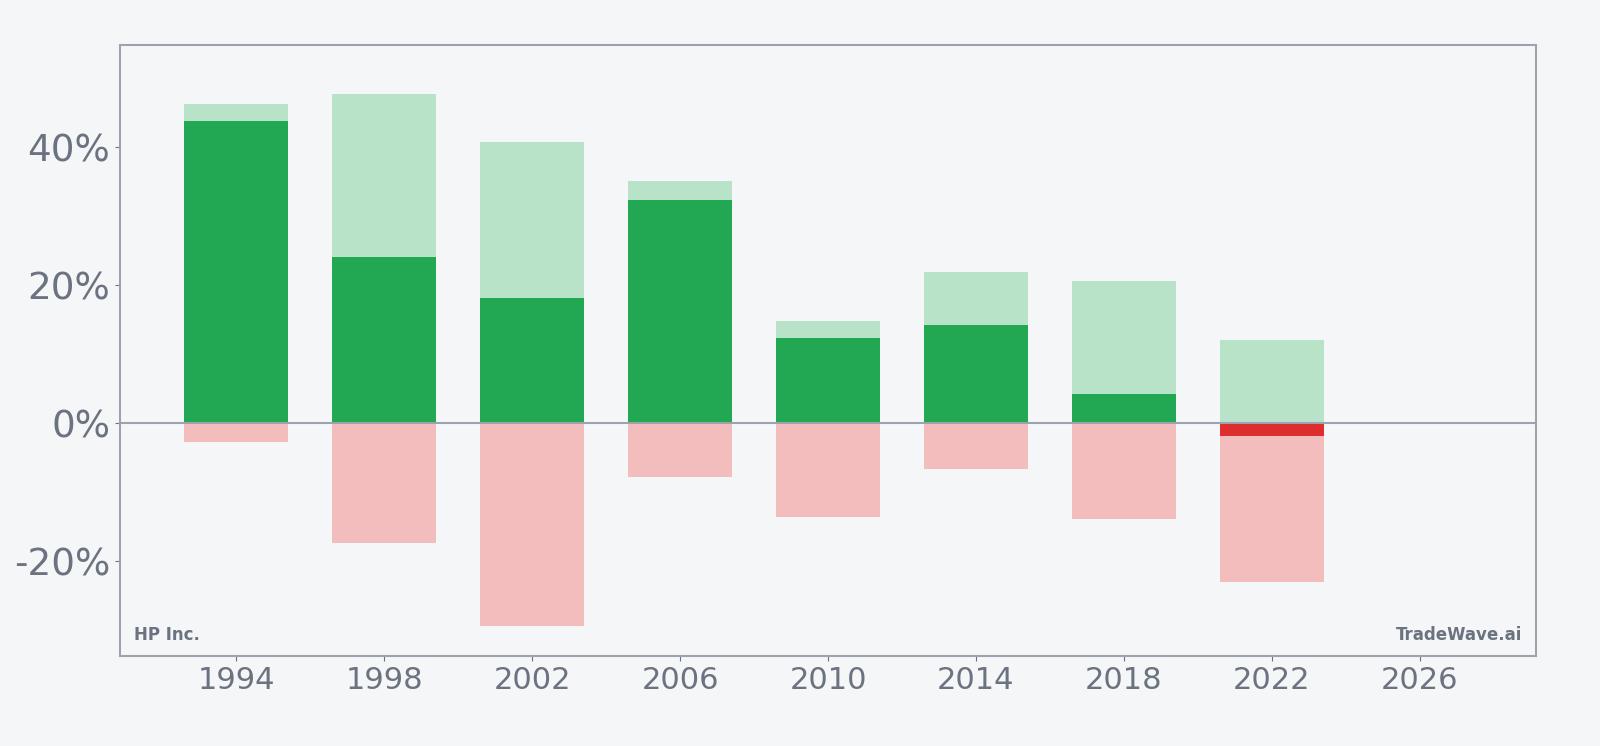
The maximum favorable moves in several years, including 1998 and 2002, pushed above 40%, while maximum adverse moves in those same windows reached into the mid-to-high teens or even near 30%. Add it up and you get a long pattern that has usually paid off but has not been low-volatility: HPQ has often swung hard in both directions before ending the window higher. The key takeaway is simple: seven for eight with double-digit average gains is a strong record, but the path has rarely been smooth.
History does not guarantee future results; adverse excursions (MAE) can be large even in winning windows.
Why does HP Inc. (HPQ) follow this seasonal pattern?
One likely driver is the way HP’s fiscal calendar and product launches line up with the political cycle, with midterm years often seeing heavier corporate and government PC refresh spending into year-end. Analysts have also pointed to institutional portfolio repositioning around midterm elections, when investors reassess regulation, trade policy and IT budgets, which can favor established PC and printing vendors. This HPQ seasonal pattern may also reflect the timing of back-to-school and holiday demand, which tends to cluster inside this 227-day window in midterm years.
What is driving HP Inc. (HPQ) today?
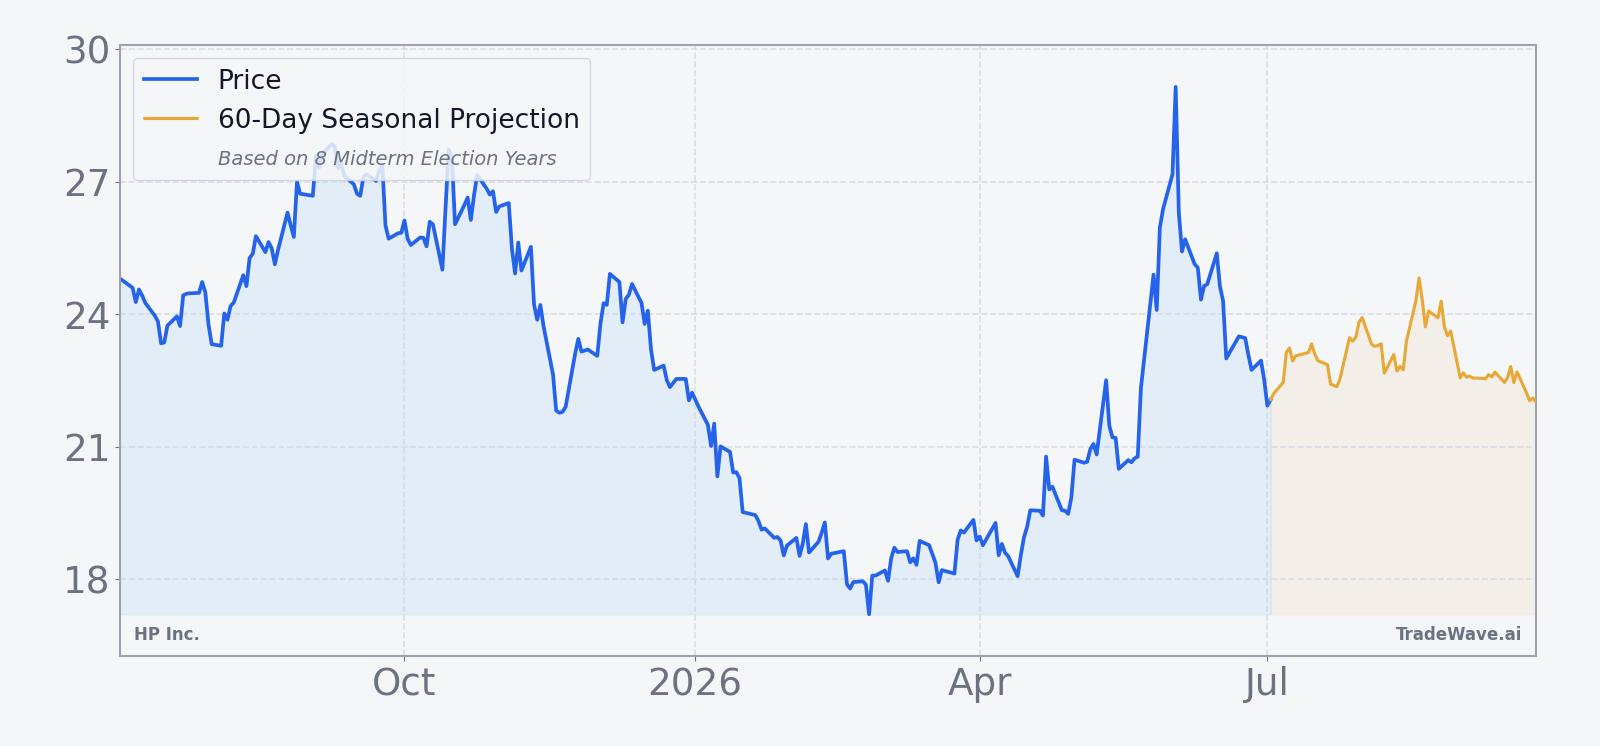
HPQ ended the prior session at 21.93, slipping 0.4% on the day after trading between 21.67 and 22.67, with roughly 13.5 million shares changing hands against a 20-day average volume of about 17.1 million. The stock sits below its 50-day moving average of 22.56 and about 24.2% under its 52-week high of 28.94, but still well above the 52-week low near 16.60, leaving it in the middle of its one-year range as this new seasonal regime begins.
Fundamentally, the story is still about how HP navigates a choppy PC cycle while leaning into AI PCs and the Windows 11 refresh. In August 2025, the company beat third-quarter revenue estimates as AI PC adoption and Windows 11 upgrades boosted PC revenue, and management guided fourth-quarter adjusted EPS roughly in line with expectations, signaling that the refresh cycle was doing real work for the top line.[1] By November 2025, HP paired another earnings beat with a plan to cut 4,000 to 6,000 jobs and issued fiscal 2026 EPS guidance of $2.90 to $3.20, below LSEG consensus, citing added costs from U.S. trade-related regulations and supply-chain shifts.[2]
In February 2026, HP warned that memory chip cost volatility could persist into the following year and that PC shipments were likely to slump by double digits, keeping its fiscal 2026 profit outlook at the low end of that prior range.[3] The company has been shifting North America-bound production out of China toward Southeast Asia, Mexico and some U.S. sites, a move that may help long-term resilience but adds near-term cost friction.[3] Against that backdrop, the midterm-year HPQ seasonal trend offers a different lens: historically, this is the part of the cycle when the stock has often climbed despite macro noise around trade and components.
The chart below shows HPQ’s recent slide from its highs alongside a 60-day seasonal projection based on prior midterm-year behavior.
What should traders watch in this HPQ seasonal window?
For this 227-day HP Inc. trading window, the first thing to watch is whether HPQ can reclaim its 50-day moving average and then close the gap toward the 25 to 26 area, which would signal that the historical midterm-year strength is starting to show up in price. The second is how the stock reacts around the next earnings update and any revisions to the fiscal 2026 outlook, especially on PC shipments and memory costs, since prior midterm-year rallies have often coincided with improving guidance rather than just cost cuts.[1][2][3] Finally, monitor volatility inside the window: if HPQ sees deep intraperiod drawdowns similar to the 20% to 30% adverse moves logged in some past years but still manages to finish the window higher, that would be consistent with the historical HPQ seasonal trend; a failure to recover from those swings would be a clear break from the pattern.
Sources
About this seasonal analysis
Seasonal pattern data is sourced from TradeWave.ai, which analyzes historical price behavior across annual calendar windows going back up to 30 years. Read the full data methodology or the book The 100-Year Pattern by Afshin Moshrefi (2026 edition). Past performance of seasonal patterns does not guarantee future results. This article is for informational purposes only and does not constitute investment advice.