Late-July Midterm Window Flags 56-Day Downside Stretch for EQT Corporation (EQT)
EQT Corporation is heading toward a historically bearish 56-day midterm-election seasonal window even as the stock trades near the middle of its recent range, putting a contrarian spotlight on late-summer price action.
Price as of Jul 2, 2026: $52.61 (last close).

What is the seasonal pattern for EQT Corporation (EQT)?
EQT Corporation has delivered profitable short trades in 7 of the last 8 midterm-year windows starting Jul 30, with average gains of 5.41% in winning years.
- 7 wins and 1 loss in this 56-day midterm-year window, with shorts profitable 88% of the time.
- Average profit in winning years is 5.41%, while the all-years average including the lone loss is 5%.
- The upcoming window begins Jul 30 and runs for 56 calendar days, targeting the last 8 midterm election years.
- The pattern is explicitly short-biased, meaning years with falling EQT prices have historically been the favorable outcomes.
- Intraperiod swings have been meaningful, with several years showing double-digit adverse moves before trades finished in the green.
- For traders, this EQT seasonal trend flags a late-summer stretch where downside has tended to dominate, but volatility has cut both ways.
According to historical data from TradeWave.ai, this upcoming midterm-year stretch for EQT behaves differently from a typical summer, with a clear short-side bias that has repeated across multiple cycles.
How has EQT Corporation (EQT) traded in this late-July midterm window?
EQT Corporation has produced winning short trades in 7 of the last 8 midterm election years during the 56 calendar days starting Jul 30, with average gains of 5.41% in those winning years. Shares finished the prior session at 52.61, up 0.25% on the day and sitting between a 52-week high near 67.86 and a 52-week low around 47.64, a middle-of-the-range setup heading into this historically weak stretch for the stock.
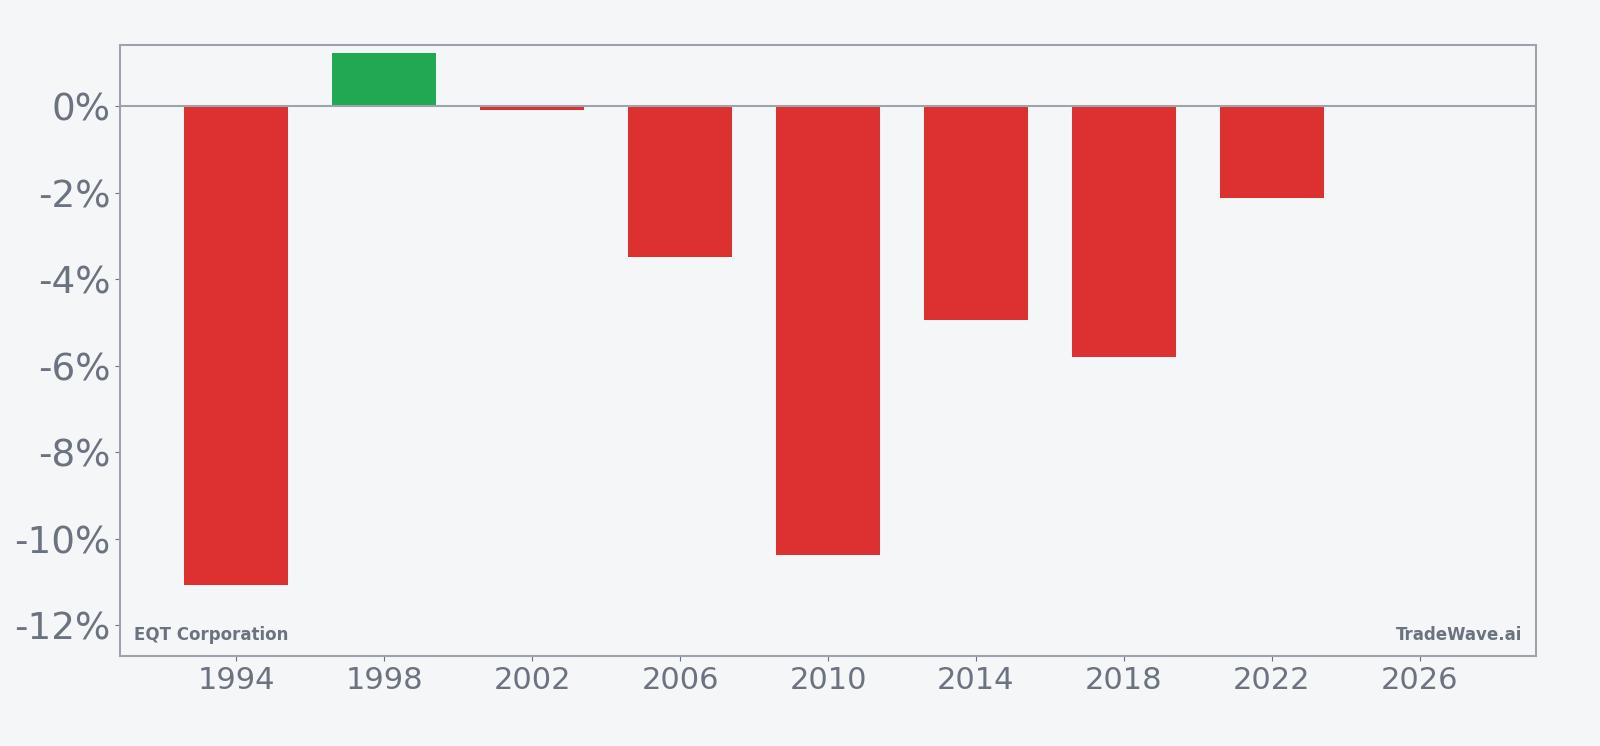
The presidential election cycle matters here because this pattern only looks at midterm election years, a phase that often brings policy uncertainty, shifting rate expectations and sector rotation across energy and cyclicals. Pattern phase and calendar phase are aligned: the data covers the last 8 midterm election years, and 2026 is itself a midterm year, so the upcoming EQT seasonal window sits squarely in the same part of the political and policy calendar that produced these results.
Historically, this has been a short-side pattern. The trade direction is short, and the years that helped the strategy were the ones where EQT drifted or dropped over the 56-day span. Across those 8 midterm-year samples, shorts were profitable 88% of the time, with 7 winners and just 1 losing year. Average profit in the winning years was 5.41%, while the all-years average including the single loss was still a solid 5%, which is unusual for a short pattern that can be vulnerable to sharp squeezes.
The per-year table shows how uneven the path can be even when the final result favors the short. In 2010, for example, the short trade finished up 10.37% as EQT fell from 17.37 to 15.57, but the worst intraperiod drawdown from entry, or maximum adverse excursion, was 11.63%, meaning the stock rallied hard against the position before rolling over. In 2022, the short ended with a modest 2.13% gain, yet the maximum favorable excursion reached 23.27%, highlighting how far the stock can move in the trade direction inside this window before giving some of it back.
The maximum favorable excursion and maximum adverse excursion profile points to a high-variance environment rather than a slow grind. Several years, including 1994 and 2010, saw double-digit adverse moves against the short before the trade recovered, while others like 1998 and 2002 had relatively contained swings. That mix suggests traders who lean on this EQT seasonal trend have historically needed room for both sharp rallies and sharp drops inside the window.
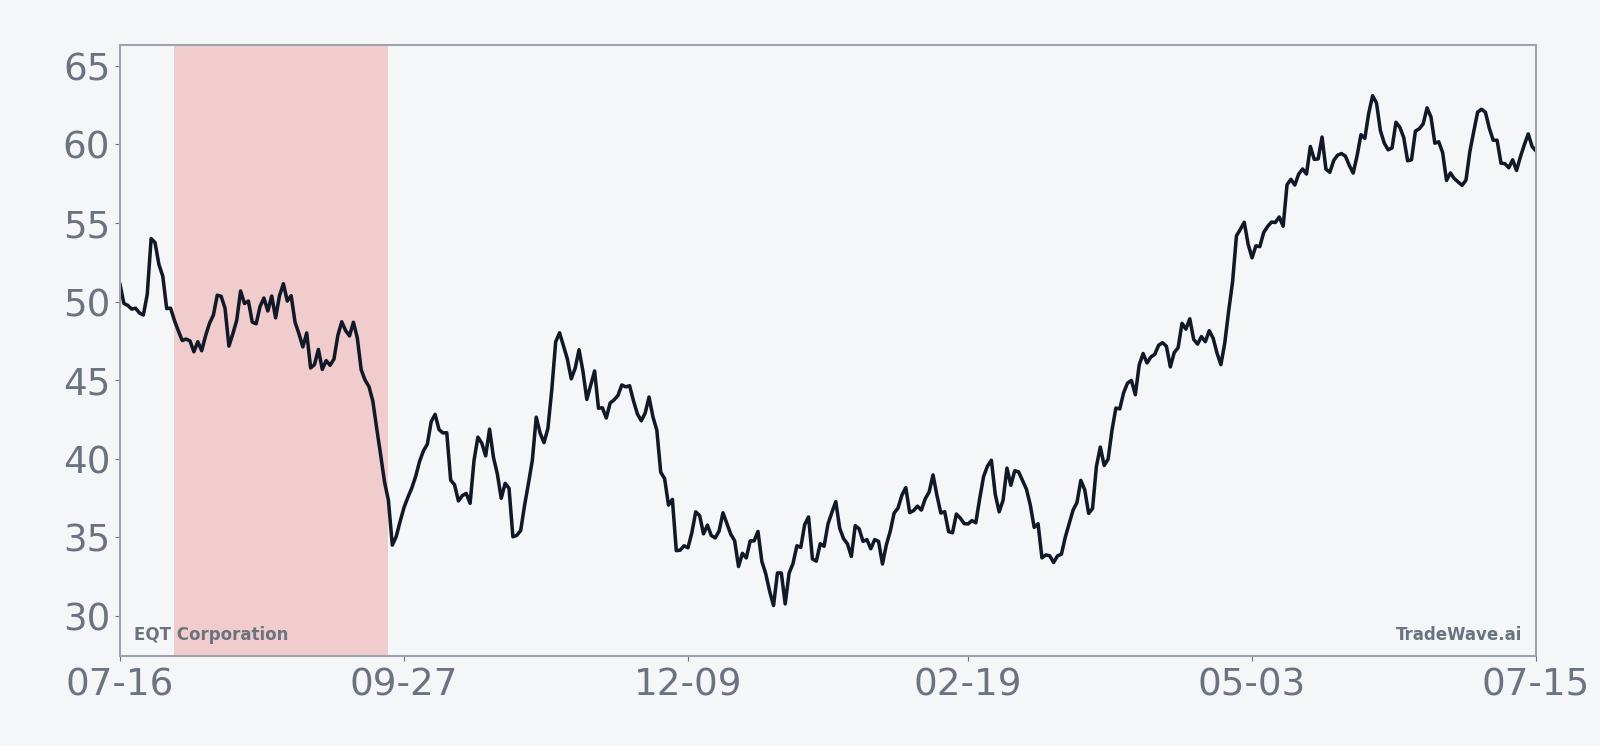
The historical seasonal average trend line slopes modestly in favor of the short, with weakness tending to build as the window progresses rather than arriving in a single shock. Early days often show choppy action, followed by a more persistent drift lower that has historically rewarded patience on the short side. That shape fits with the idea of a market digesting policy headlines and macro data through late summer in a midterm year.
A second view that stacks net results with peak rallies and drawdowns helps clarify how much EQT has swung inside this window.
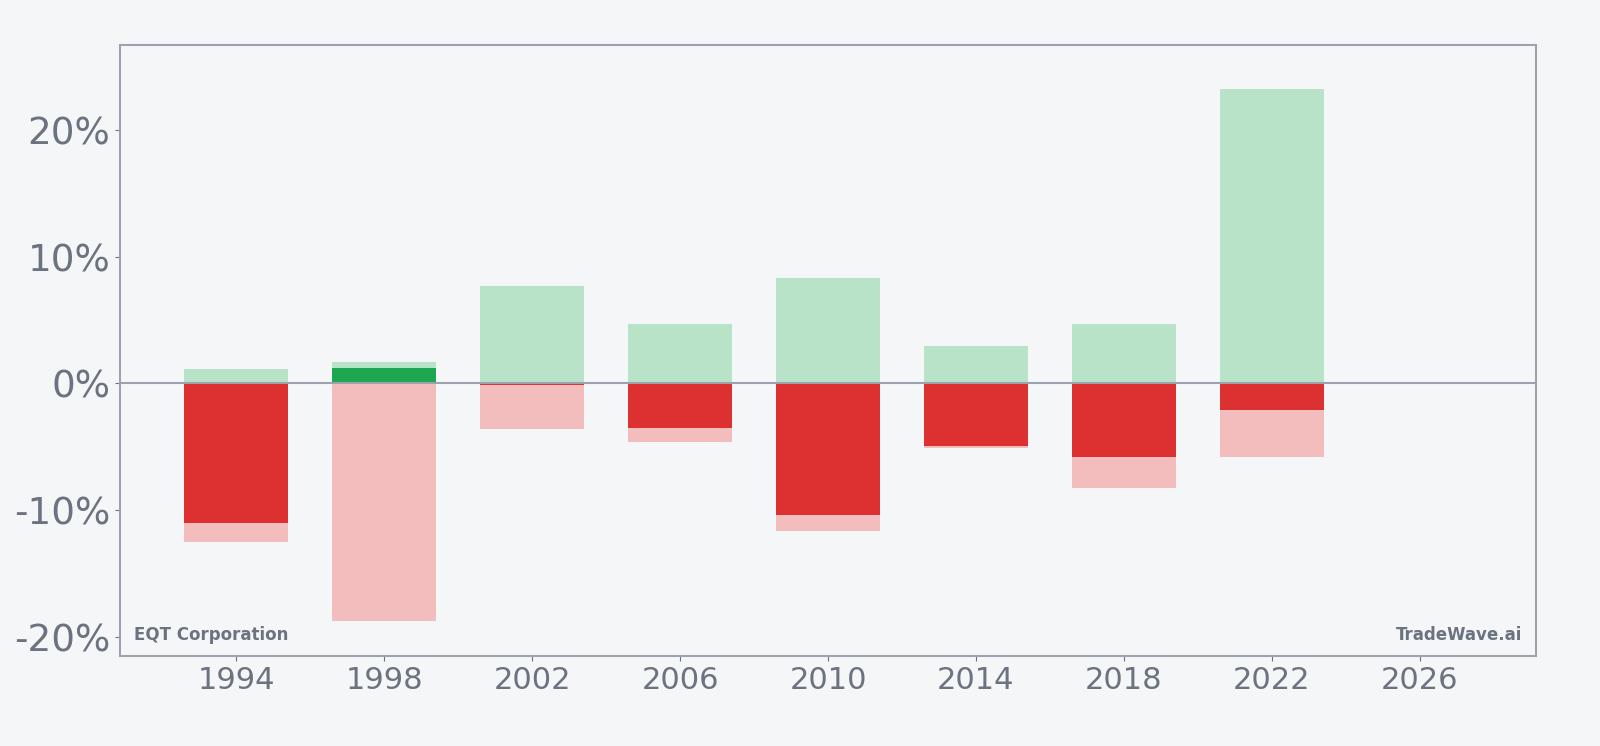
The stacked bar view shows that even in winning years, EQT has often staged sizable rallies against the short before rolling over, with maximum adverse excursions in the mid- to high-single digits and, in some cases, beyond 10%. At the same time, maximum favorable excursions have frequently outpaced the final net result, which is consistent with a TradeWave Ratio of 1.58 that signals price tends to travel meaningfully in the trade direction inside the window before settling at exit.
History does not guarantee future results; adverse excursions can be large even in winning windows, and traders leaning on this pattern still face the risk of sharp squeezes against short positions.
Why does EQT Corporation (EQT) follow this seasonal pattern?
This EQT seasonal pattern likely reflects a mix of election-cycle policy uncertainty and commodity-driven positioning in natural gas. One likely driver is that midterm summers often coincide with shifting expectations for regulation, drilling permits and pipeline approvals, which can prompt portfolio managers to rebalance energy exposure. The 56-day window starting in late July also overlaps a key stretch for winter gas contract hedging, so changes in commodity curves and producer guidance may be feeding into this recurring short-side bias in EQT.
What is driving EQT Corporation (EQT) today?
EQT Corporation closed the prior session at 52.61, up 0.13 points or 0.25% on the day, after trading between an intraday low of 52.19 and a high of 53.18 on volume of about 4.9 million shares. That leaves the stock roughly 22.5% below its 52-week high near 67.86 and about 10.4% above its 52-week low around 47.64, a neutral zone that gives the upcoming late-July seasonal window room to matter either way.
The chart below situates the latest move in its recent multi-month context and overlays a 60-day seasonal projection.
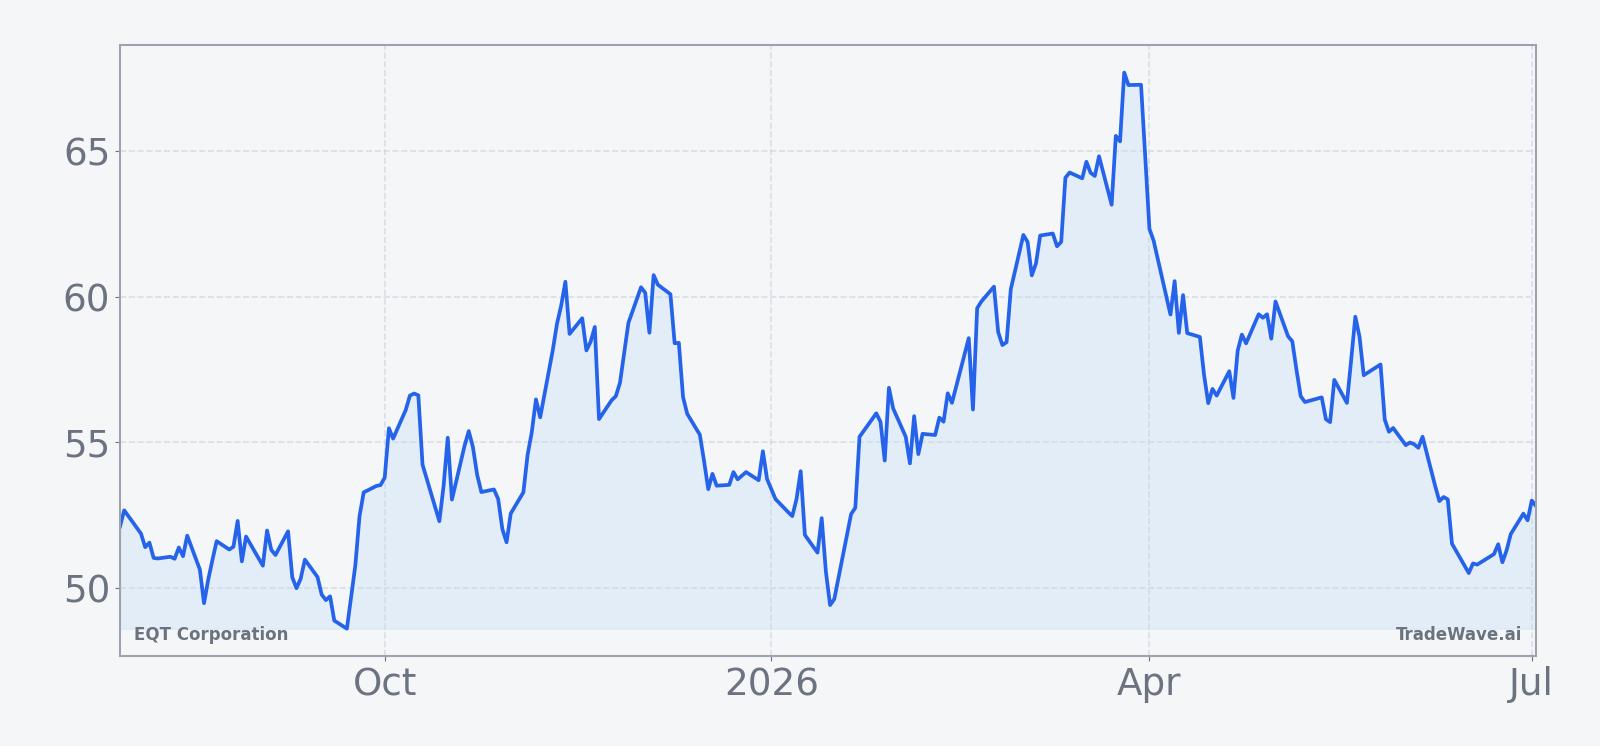
Average 20-day volume sits near 7.9 million shares, so the latest session’s activity was somewhat lighter than usual, suggesting traders are not yet positioning aggressively for the late-July EQT seasonal trend. The stock also trades modestly below its 50-day simple moving average around 55.16, which frames the current tape as a mild pullback rather than a full-blown breakdown. With no major earnings date or company-specific catalyst on the immediate calendar, the focus into month-end is likely to stay on macro gas pricing, rate expectations and how energy equities behave as the midterm year moves into its back half.
What should traders watch in this EQT seasonal window?
The key test for this EQT seasonal pattern will come as the 56-day window opens on Jul 30 and runs through early October. Historically, shorts have benefited when the stock has drifted lower over that span, but the path has often included sharp countertrend rallies that would challenge tight risk limits. Traders watching this EQT Corporation trading window will want to see whether price respects the 50-day moving average on any bounces and how it behaves if it revisits the 52-week low area around 47.64.
On the macro side, the late-summer calendar is heavy on policy and data that matter for an Appalachian gas producer: updates on storage, hurricane-season disruptions, and any midterm-year regulatory noise around drilling or pipelines. If those headlines line up with the historical seasonality and EQT starts to weaken into September, it would fit the pattern of prior midterm years where the short side has dominated. A sustained break above the 52-week high region, by contrast, would mark a clear departure from the historical script and signal that this cycle is trading on a different playbook.
Add it up: a strong short-biased seasonal record, a stock sitting in the middle of its range, and a midterm election year that often reshuffles energy positioning. For traders, the message is not a guarantee but a heads-up that the late-July to early-October stretch has repeatedly been a different kind of tape for EQT than the rest of the calendar.
Sources
About this seasonal analysis
Seasonal pattern data is sourced from TradeWave.ai, which analyzes historical price behavior across annual calendar windows going back up to 30 years. Read the full data methodology or the book The 100-Year Pattern by Afshin Moshrefi (2026 edition). Past performance of seasonal patterns does not guarantee future results. This article is for informational purposes only and does not constitute investment advice.