Brown & Brown (BRO) Has Rallied in 10 of 10 Midterm July Windows, Averaging 5.06% Gains
Brown & Brown is heading toward a mid-July seasonal window that has never produced a loss in past midterm election years, just as the stock jumps 5% and trades well below its 52-week high.
Price as of Jul 1, 2026: $67.36 (last close).

What is the seasonal pattern for Brown & Brown (BRO)?
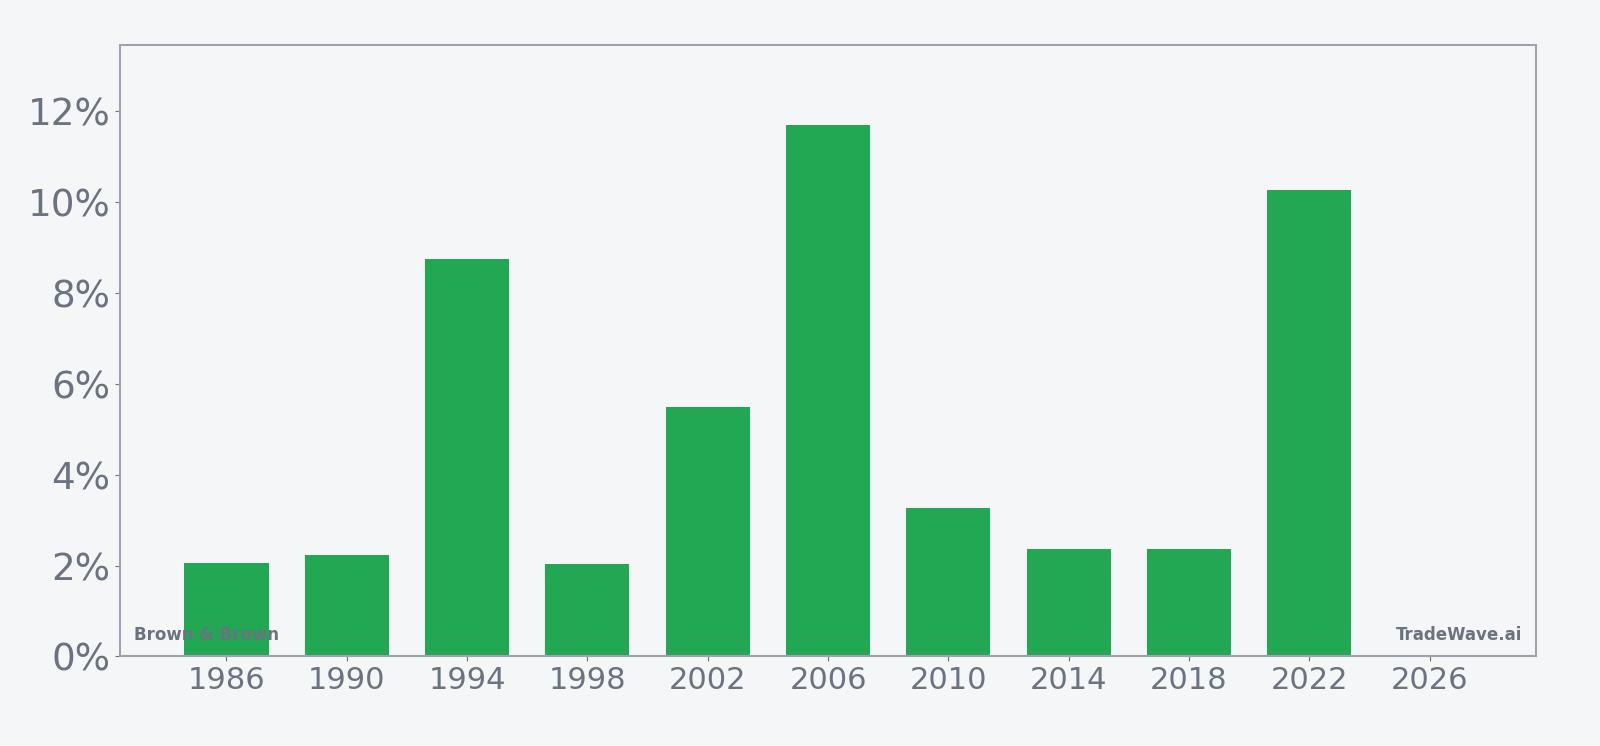
Brown & Brown has risen in 10 of 10 midterm election years during this 18-day July window, with an average gain of 5.06% in winning years.
- 10 for 10 in this window, with Brown & Brown averaging 5.06% gains across all winning years.
- The upcoming pattern runs from Jul 12 for 18 calendar days and has been a consistently bullish BRO seasonal trend in midterm election years.
- Percent Profitable is 100%, with 10 winners and 0 losers across the last 10 midterm election-year samples.
- Median gain of 2.82% shows that even the “typical” year has delivered a positive move, not just a few outliers.
- Intraperiod swings have been meaningful, with past years showing double-digit peak run-ups and occasional sharp drawdowns before finishing higher.
- Annualized return of 5.0% and a Sharpe ratio of 1.29 point to a historically favorable risk-reward profile for this Brown & Brown trading window.
According to historical data from TradeWave.ai, this mid-July stretch has behaved very differently from an average month on the calendar for Brown & Brown. The next section walks through what that election-cycle seasonality has looked like and how it frames the current setup.
How has Brown & Brown (BRO) traded in this mid-July window?
Brown & Brown has risen in every one of the last 10 midterm election years during this 18-day window starting Jul 12, averaging a 5.06% gain for long positions. Today the stock closed at $67.36, up 5.0% on the day and sitting about 38.3% below its 52-week high of $109.05, leaving plenty of room between current levels and the prior peak.
The pattern is built specifically on the presidential election cycle, grouping only midterm election years and ignoring other phases. That matters because insurance brokers often feel policy and regulatory shifts with a lag, and mid-cycle years can bring a different mix of rate policy, fiscal spending and climate-related regulation than election or pre-election years.
Across those 10 midterm election-year samples, Brown & Brown’s seasonal stats are unusually clean for a single-stock pattern. Percent Profitable sits at 100%, with 10 winners and no losing years, and the median gain of 2.82% suggests the strength is not just a couple of outsized rallies skewing the average. The annualized return of 5.0% and Sharpe ratio of 1.29 indicate that, historically, the risk-adjusted payoff for being long in this slice of the calendar has been favorable compared with a random 18-day stretch.
The per-year table shows how that has played out in practice. The weakest net gain in the sample was a 2.03% rise in 1998, while the strongest years, such as 2006 and 2022, delivered double-digit returns of 11.71% and 10.26% respectively. Even in 2002, when the stock faced a maximum adverse move of -12.02% inside the window, it still finished the period up 5.5%, underscoring how intraperiod volatility has not prevented positive closes for this long setup.
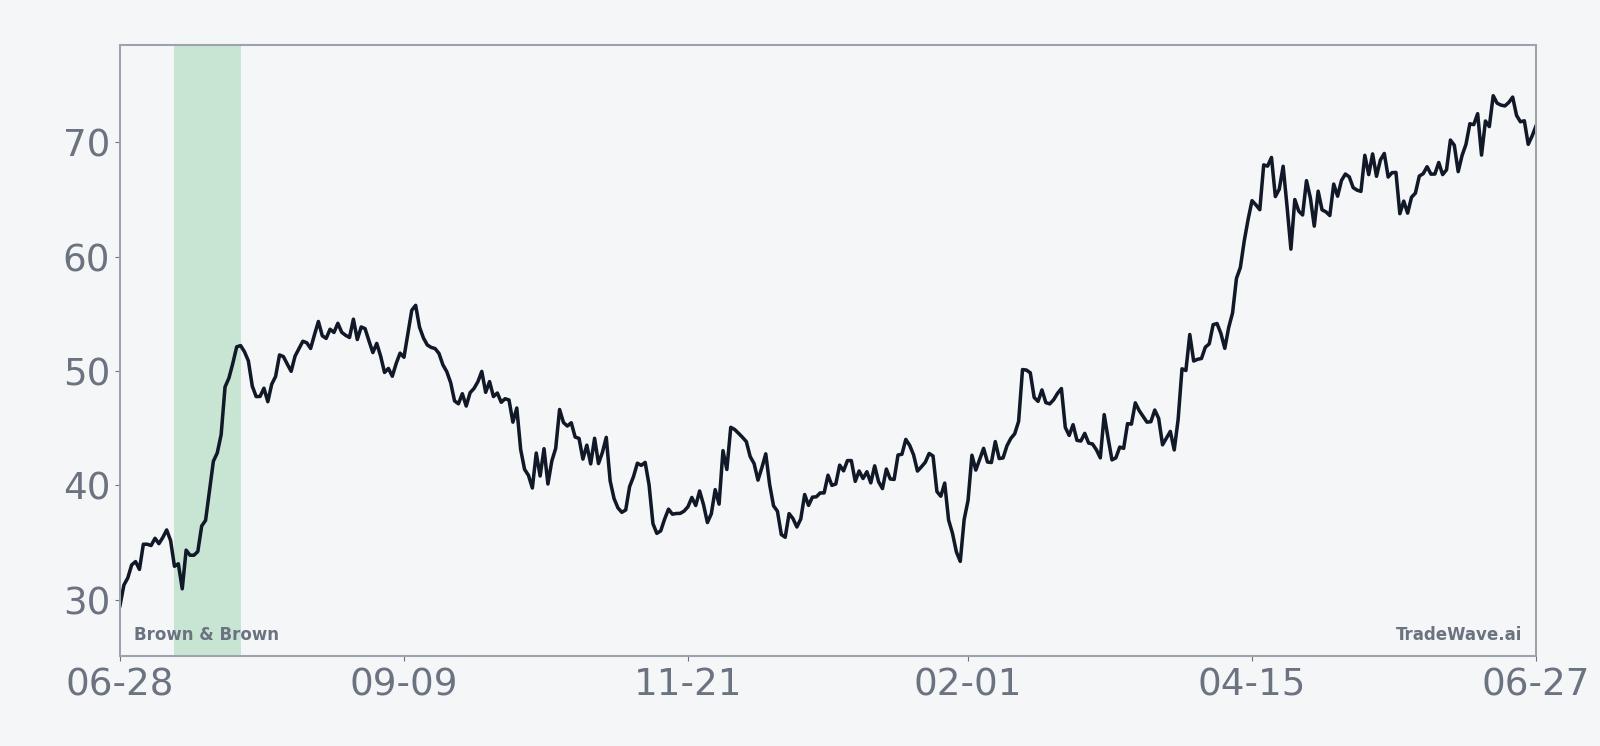
The historical seasonal average trend line slopes higher through most of the 18-day span, with gains tending to build rather than spike and fade. That profile fits a pattern where buyers gradually accumulate exposure during the window instead of chasing a single news-driven jump. The cumulative return chart for the pattern, which stacks these windows across decades, shows a steady climb to a 62% cumulative gain, rather than a jagged path dominated by a few outlier years.
Year-by-year bars with intraperiod swings show how much room Brown & Brown has historically had to run and to pull back inside this window.
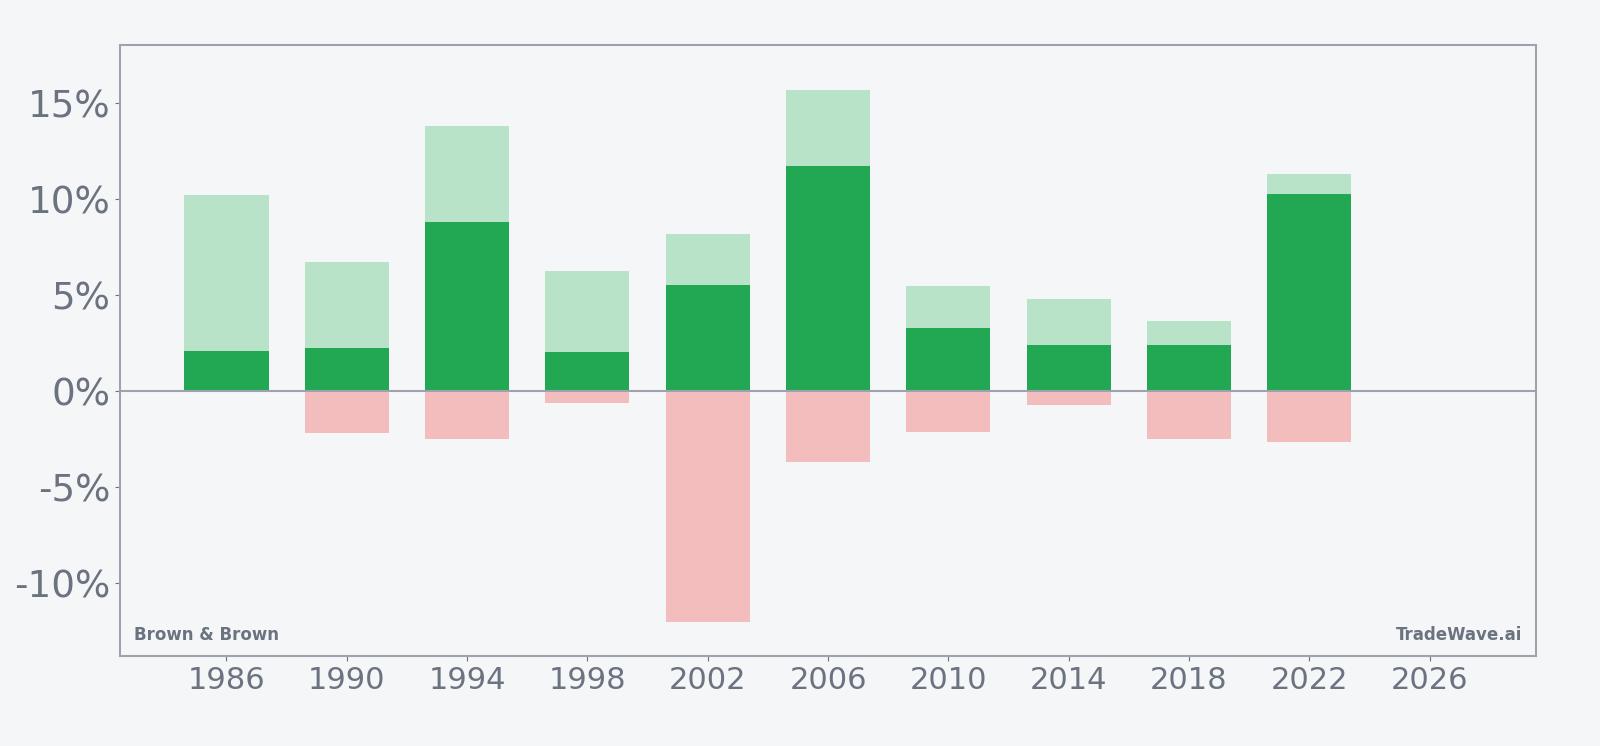
The combined net/MFE/MAE bars highlight that upside potential has often been larger than the final gains, with several years showing peak run-ups above 10% before settling back by the close. At the same time, adverse excursions have occasionally been deep, such as the -12.02% drawdown in 2002, reminding traders that even a historically strong window can involve sharp pullbacks before finishing higher. The TradeWave Ratio of 2.1 captures this tendency for price to travel meaningfully in the trade direction within the window, independent of where it ultimately closes.
History does not guarantee future results; adverse excursions can be large even in winning windows, and past patterns may not repeat.
Why does Brown & Brown (BRO) follow this seasonal pattern?
One likely driver is the way insurance brokers sit at the intersection of midyear catastrophe risk, corporate budget cycles and regulatory updates that often cluster in midterm election years. Analysts have pointed to rising demand for coverage as climate and cyber risks build, which can translate into stronger midyear placement activity for firms like Brown & Brown.[1] This pattern may also reflect institutional portfolio repositioning around midyear as investors adjust exposure to financials and insurance ahead of the heavier hurricane and wildfire season.
What is driving Brown & Brown (BRO) today?
Brown & Brown shares closed Thursday at $67.36, up 5.0% on the day, extending a roughly 19.03% gain over the past month as the stock rebounds from spring weakness. Even after that surge, the stock remains about 38.3% below its 52-week high of $109.05 and roughly 25.2% above its 52-week low of $53.81, leaving it in the middle of its one-year range on elevated volume relative to the 20-day average of about 3.15 million shares.
Fundamentally, the story has been a tug-of-war between strong top-line growth and investor concern about organic momentum. In late January 2026, Brown & Brown reported adjusted fourth-quarter earnings per share of $0.93, up from $0.86 a year earlier, with total revenue jumping to $1.61 billion from $1.18 billion and commissions and fees up 36% to $1.58 billion.[1] The stock still dropped nearly 6% around that report as traders focused on organic revenue slipping to $1.08 billion from $1.11 billion, a reminder that the market is watching the quality of growth as closely as the headline numbers.[1]
Sector tailwinds have helped the recovery. Global insured losses from natural disasters surpassed $100 billion in 2025, reinforcing demand for coverage and brokerage services as corporates and households reassess their risk exposure.[1] At the same time, rising concern over cyberattacks has kept pressure on companies to maintain and expand coverage, a trend that has benefited insurance brokers as intermediaries in a more complex risk landscape.[1]
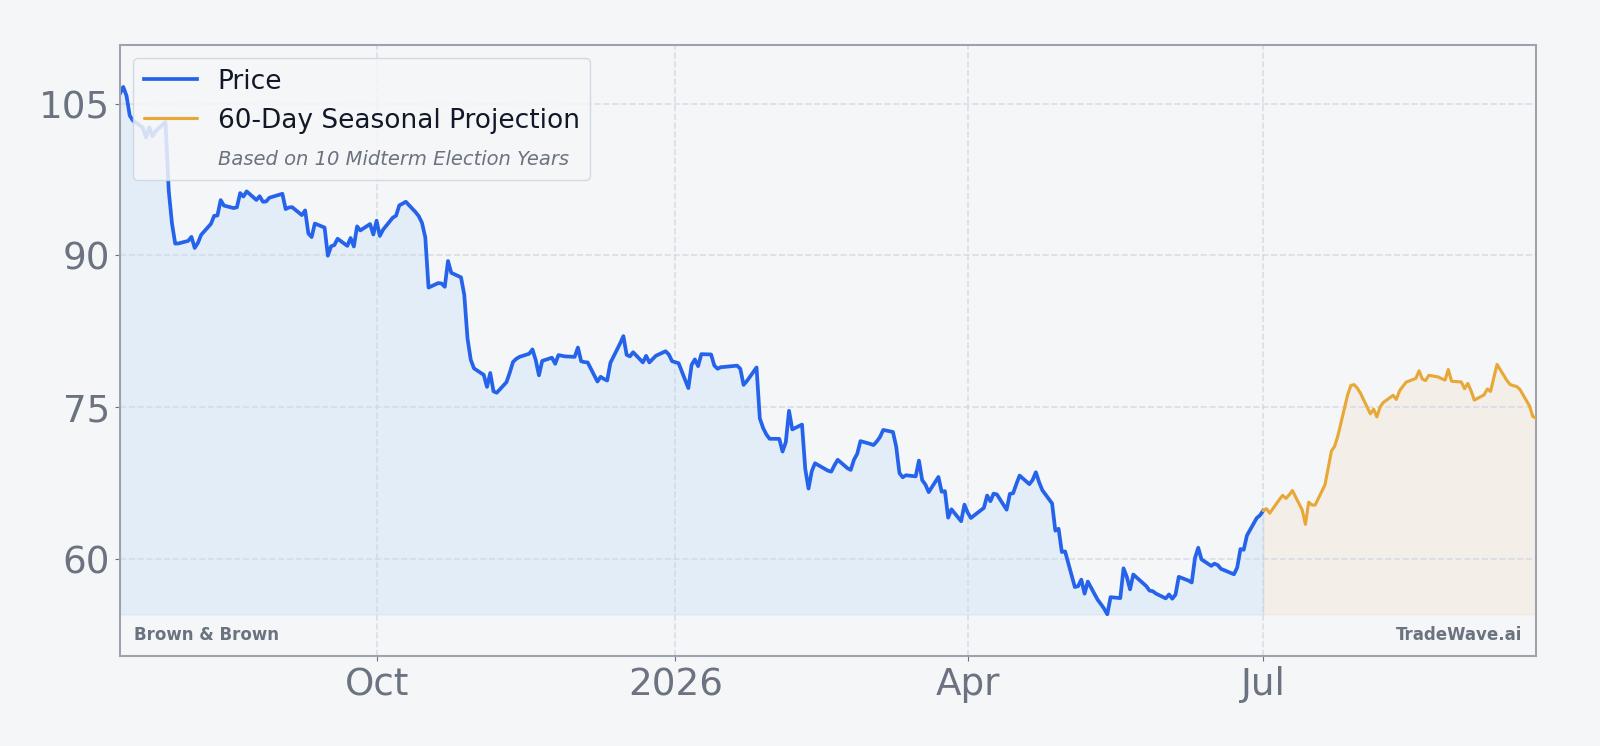
The chart below situates the latest move in its recent multi-month context and overlays the upcoming seasonal projection.
What should traders watch as this Brown & Brown seasonal window approaches?
First, the calendar. The 18-day window tied to the last 10 midterm election years begins on Jul 12, so any consolidation or pullback into that date will shape how stretched or under-owned the stock is as the historical pattern kicks in. A firm tone into the start of the window would echo prior cycles where buyers leaned in early, while a sharp reversal would test how robust the midterm-year seasonal bias really is.
Second, price levels. On the upside, traders will be watching how Brown & Brown behaves if it pushes back toward the low $70s, an area that has capped rallies in recent months on the chart. On the downside, the zone around the 50-day moving average near $59.51 is a natural reference point; in past strong seasonal windows, pullbacks toward that kind of intermediate trend line have often attracted dip buyers rather than triggering deeper breaks.
Third, the macro and policy backdrop. As the midterm election year progresses, any shifts in expectations for climate policy, cyber regulation or healthcare reimbursement could alter the sector’s earnings outlook and either reinforce or blunt the historical seasonality. Elevated catastrophe activity or another year of $100 billion-plus insured losses would likely keep demand for coverage high, but a quieter season or aggressive price competition could change the narrative.[1]
Finally, behavior inside the window itself will be the real test of this pattern. If Brown & Brown again grinds higher with intraperiod swings that stay contained relative to past maximum adverse moves, it would add another data point to a 10-for-10 record that already stands out among S&P 500 stocks. A decisive break of that pattern, especially if accompanied by weaker organic growth or softer sector demand, would signal that the midterm-year seasonal edge for this name may be fading.
Sources
About this seasonal analysis
Seasonal pattern data is sourced from TradeWave.ai, which analyzes historical price behavior across annual calendar windows going back up to 30 years. Read the full data methodology or the book The 100-Year Pattern by Afshin Moshrefi (2026 edition). Past performance of seasonal patterns does not guarantee future results. This article is for informational purposes only and does not constitute investment advice.