Duke Energy (DUK) Has Rallied in 10 of 10 Midterm Summer Windows, Averaging 4.63% Gains
Duke Energy is heading into a historically strong 39-day midterm-year summer stretch, with shares trading just below their 52-week high as investors weigh rate-driven growth plans.
Price as of Jul 6, 2026: $125.97 (last close).

What is the seasonal pattern for Duke Energy (DUK)?
Duke Energy has risen in 10 of 10 midterm-year summer windows starting around Jul 10, with an average gain of 4.63% in winning years.
- 10 for 10 in this window, with Duke Energy averaging 4.63% gains across all winning years.
- The upcoming 39-day window begins Jul 10 and covers the last 10 midterm election years in the presidential cycle.
- Percent Profitable is 100%, with 10 winners and 0 losers in the historical sample.
- Median profit is 4.7%, pointing to a fairly consistent upside skew rather than one or two outlier years.
- The TradeWave Ratio of 2.48 signals that price has typically traveled meaningfully in the long direction within the window.
- Even with a Sharpe ratio of 1.99, some years saw sharp intraperiod drawdowns before finishing higher, so risk management still matters.
According to historical data from TradeWave.ai, this midterm-year summer stretch has behaved very differently from an average month on the calendar for Duke Energy. The next section walks through how that pattern has played out in prior cycles and what it means for the upcoming 39-day window.
How has Duke Energy (DUK) traded in past midterm-year summer windows?
Duke Energy has risen in every single midterm-year summer window over the last 10 cycles, averaging a 4.63% gain across a 39-day stretch that begins on Jul 10. Shares finished Monday at $125.97, down 2.8% on the day and about 4.7% below their 52-week high of $132.20, leaving the stock near the upper end of its one-year range.
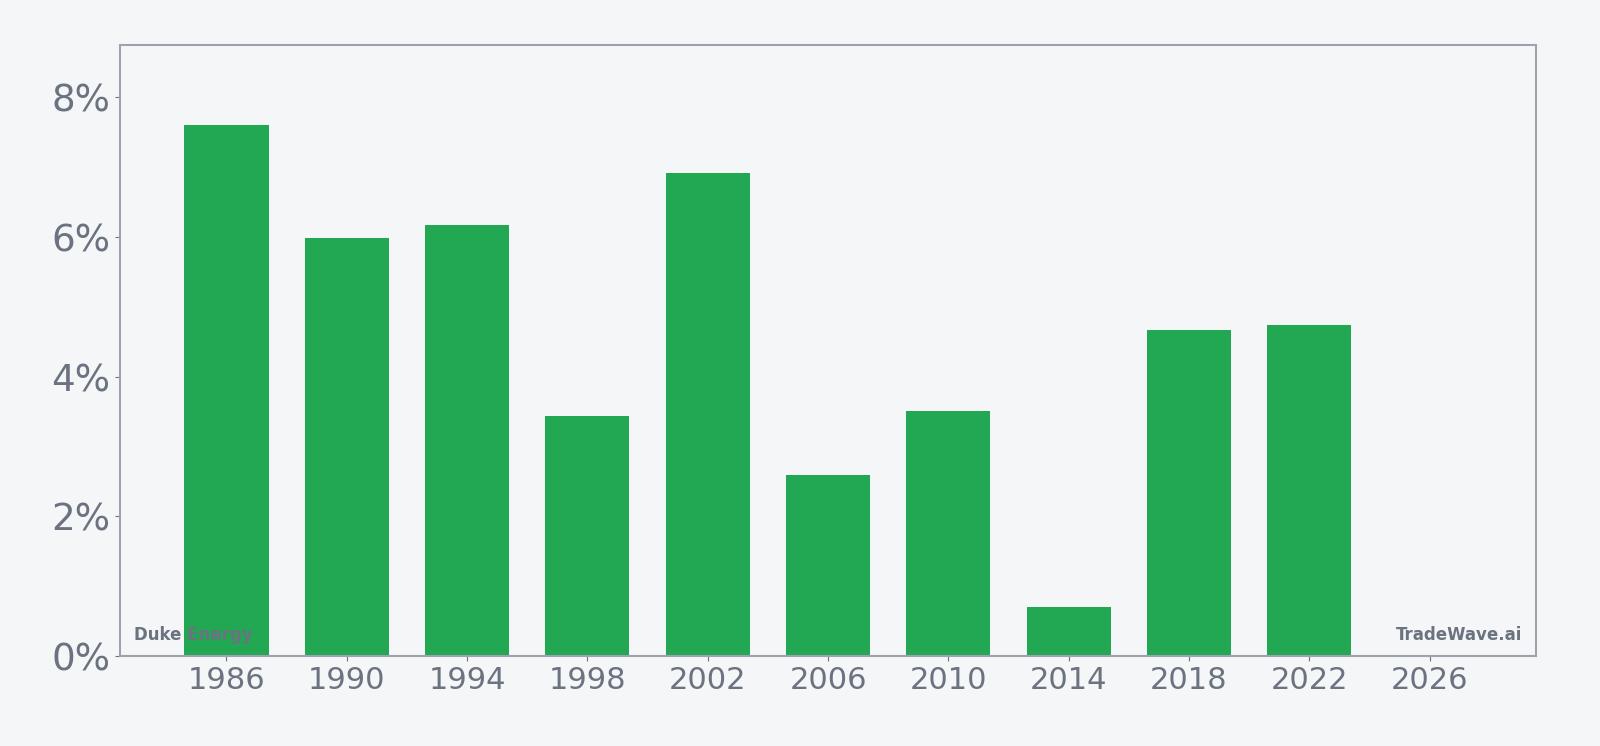
The pattern is built on the last 10 midterm election years, a phase of the presidential cycle that often brings heavier policy noise and rate debates for regulated utilities. Grouping by this cycle matters for a name like Duke because rate cases, capital plans and regulatory calendars tend to bunch around election timelines, shaping how the stock trades in specific parts of the year.
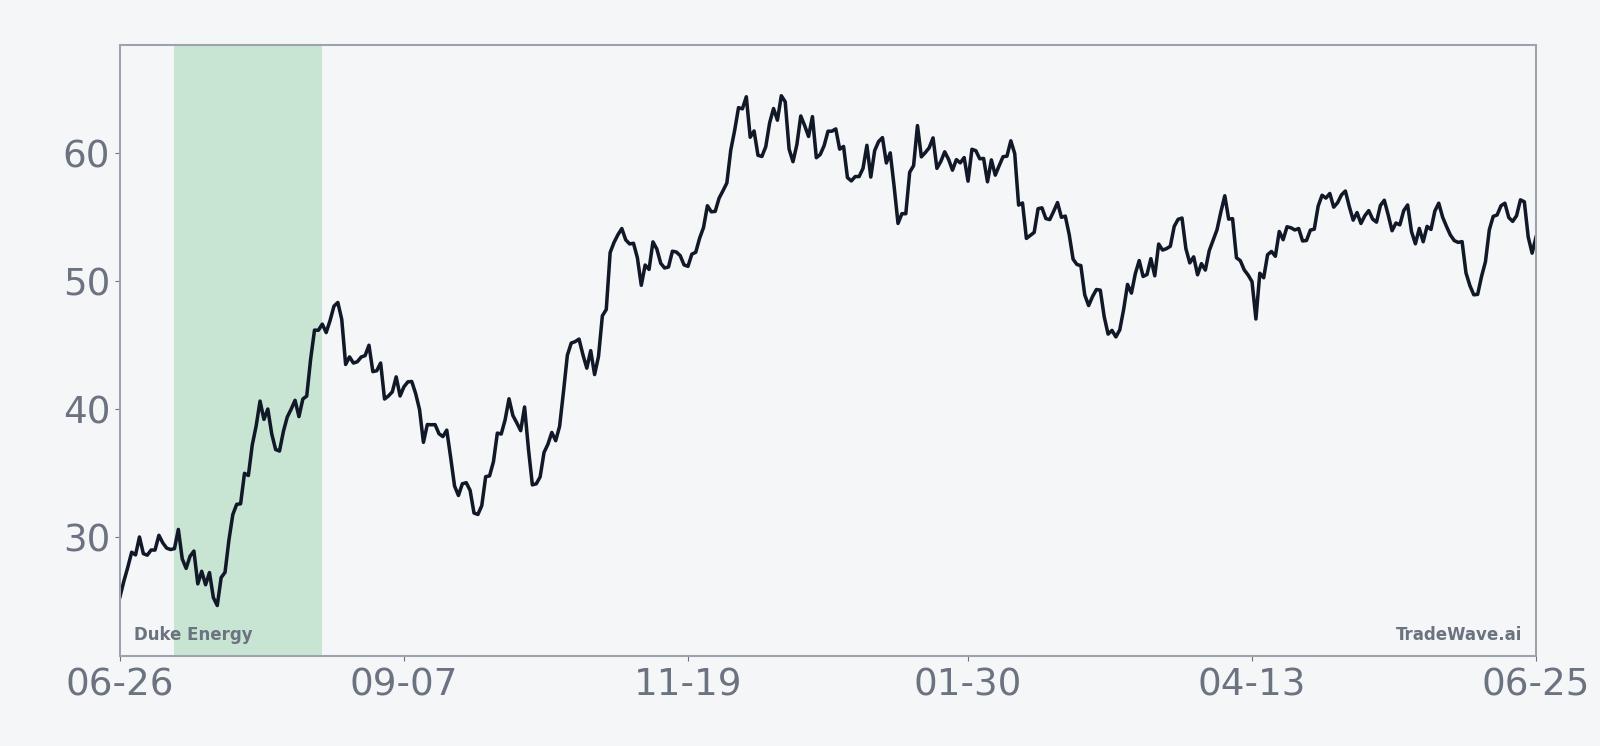
The historical seasonal average shows a fairly steady climb through the window rather than a single explosive burst. In many years, gains start to accrue early in the period and continue in a grinding fashion, which fits the typical profile of a regulated utility stock that trends rather than spikes. The cumulative return line across cycles reaches about 56% over the full sample, reflecting how often this midterm-year slice has rewarded long exposure.
Year-by-year net returns and intraperiod swings help clarify how much upside and downside has shown up inside this window.
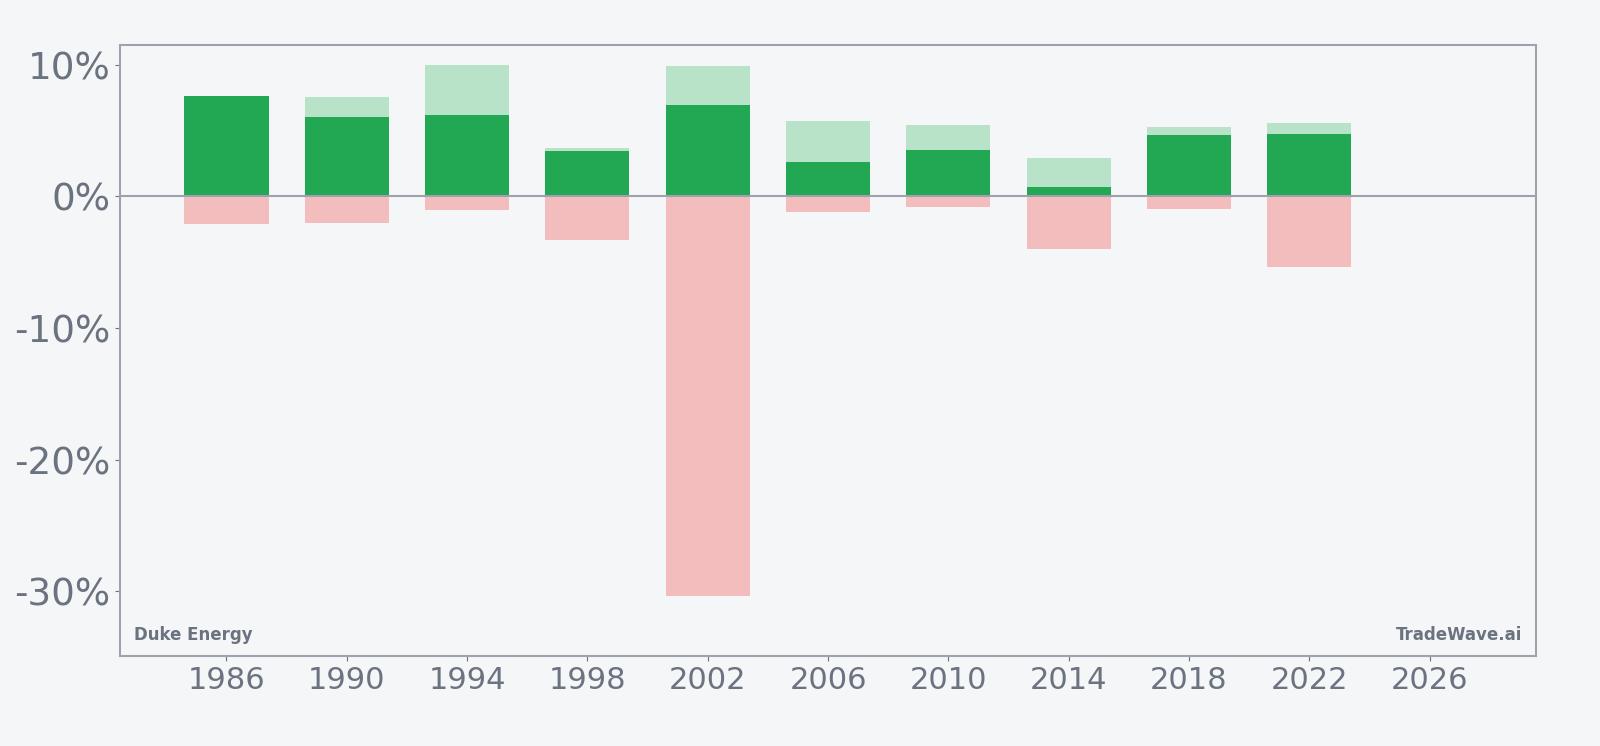
The stacked net, maximum favorable move and maximum adverse move bars show that upside has usually come with manageable but sometimes sharp drawdowns. In 2002, for example, the stock finished the window up 6.91% but at one point was down about 30.38% from the entry, a reminder that even winning years can involve deep interim pain. Other years such as 1994 and 2018 saw more modest worst-case dips of roughly 1% to 5% while still delivering mid-single-digit gains, which is closer to the typical pattern.
Across the 10-sample history, the long trade direction has been consistently rewarded, with no losing years and a median profit of 4.7%. The Sharpe ratio of 1.99 suggests that, on an end-of-window basis, returns have been strong relative to volatility, even after accounting for those occasional large adverse swings. Add it up: 10 for 10 with a 56% cumulative gain is an unusually clean seasonal record for a defensive utility stock.
Why does Duke Energy (DUK) follow this seasonal pattern?
One likely driver is the way utility rate cases and capital spending decisions cluster around the mid-year policy calendar in midterm election years, which can firm up earnings visibility and support the shares. Analysts have also pointed to sector rotation, with investors often leaning back into defensive, dividend-paying utilities in the middle of the political cycle as macro uncertainty rises. For Duke specifically, this pattern may reflect recurring flows into regulated power names as investors position ahead of multi-year infrastructure and grid investment updates.
History does not guarantee future results; adverse excursions can be large even in winning windows, so traders should treat this pattern as context rather than a forecast.
What is driving Duke Energy (DUK) today?
Duke Energy closed at $125.97 on Jul 7, down 2.8% on the day, with roughly 5.6 million shares changing hands versus a 20-day average volume of about 3.9 million. The stock sits just above its 50-day moving average of $124.43 and about 4.7% below its 52-week high near $132.20, leaving it in a gentle uptrend but not stretched on most technical measures.
Fundamentally, the story is still about capital spending and regulation rather than short-term trading noise. In August 2025, Duke reported stronger-than-expected quarterly earnings, with adjusted EPS of $1.25 versus a $1.18 LSEG estimate and revenue rising to $7.5 billion from $7.17 billion a year earlier, helped by its electric utilities segment and new rates and riders that boosted retail sales volumes.[1] Later in 2025 the company outlined a larger capital plan of $95 billion to $105 billion for 2026 through 2030, targeting 30% to 50% equity funding and noting that roughly 90% of electric capital spending would qualify for efficient-recovery mechanisms, a structure that can reduce regulatory lag for a regulated utility.[1]
Macro demand trends also lean in Duke’s favor. In 2025, the U.S. Energy Information Administration projected record power consumption for 2025 and 2026, a backdrop that supports large grid and generation investments for utilities with strong regulatory frameworks.[1] For a stock like Duke, that combination of rising demand, heavy but recoverable capex and a visible rate path is exactly the kind of setup that can make a historically bullish seasonal window more relevant to investors watching the next leg of the trade.
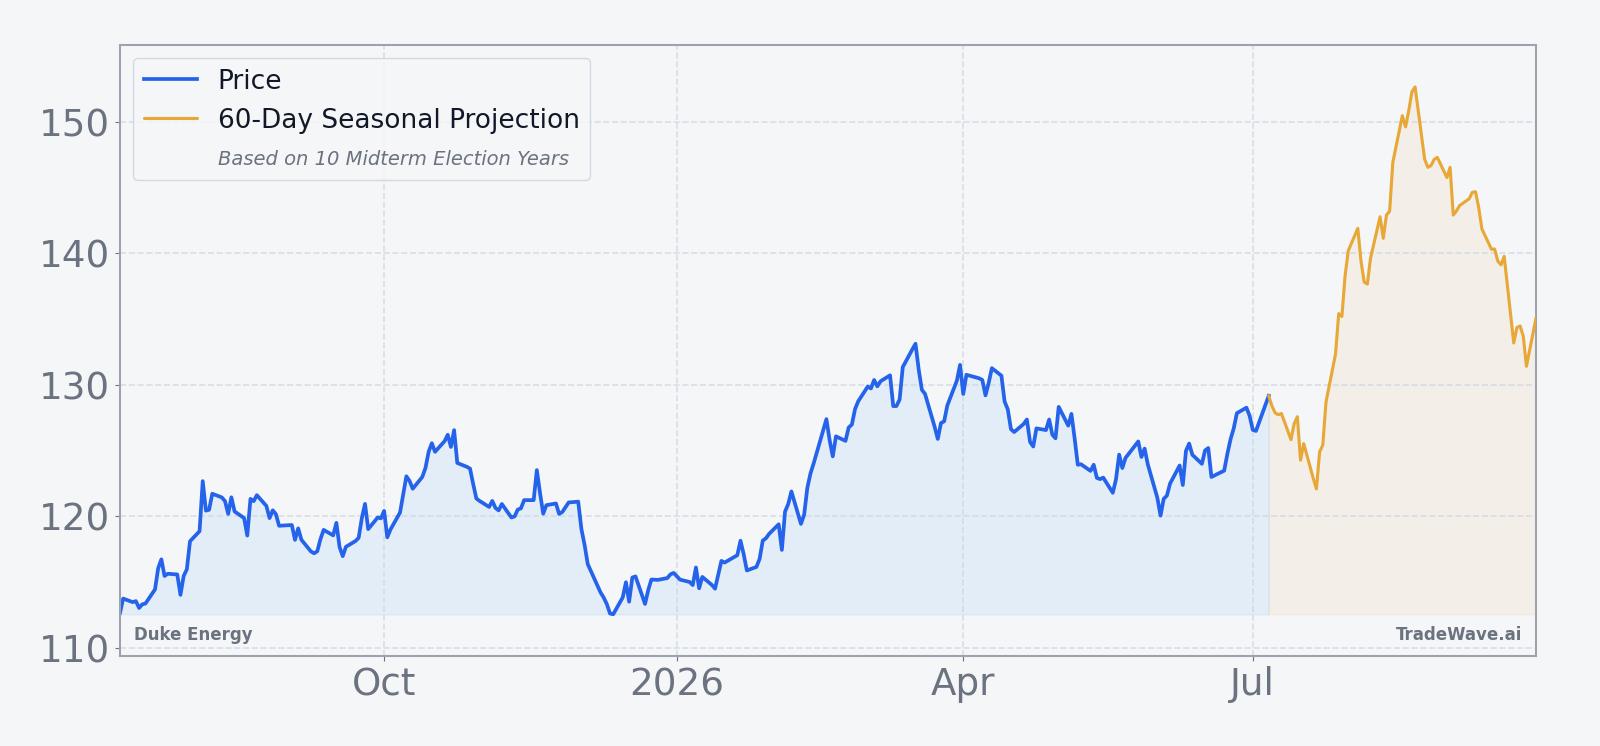
The chart below situates the latest pullback against the past year’s climb and the forward seasonal projection.
What should traders watch in this Duke Energy (DUK) seasonal window?
First, the calendar: the 39-day window starting Jul 10 sits in the middle of the midterm election year and runs into the early part of the transition toward the pre-election year, a phase that has historically seen investors re-risk into equities. For Duke, traders will be watching whether the stock can hold above its 50-day moving average and push back toward the $132 area as the window opens, in line with the historical pattern of steady gains.
Second, policy and rate headlines matter. Any updates on state-level rate cases, capital plan execution or regulatory guidance could either reinforce or undercut the typical midterm-year seasonal strength. A pattern-consistent tape would likely feature modest pullbacks that are bought quickly, with dips staying contained relative to the more extreme drawdowns seen in outlier years like 2002.
Finally, behavior inside the window will be the real test of this historical seasonality. If Duke grinds higher on normal volume, respecting support near the 50-day moving average and making incremental highs, that would echo the 10-for-10 track record. A break below recent lows with heavy selling and no quick recovery would contradict the historical DUK seasonal trend and signal that macro or regulatory forces are overpowering the usual midterm-year pattern.
Sources
About this seasonal analysis
Seasonal pattern data is sourced from TradeWave.ai, which analyzes historical price behavior across annual calendar windows going back up to 30 years. Read the full data methodology or the book The 100-Year Pattern by Afshin Moshrefi (2026 edition). Past performance of seasonal patterns does not guarantee future results. This article is for informational purposes only and does not constitute investment advice.