Tyson Foods (TSN) Has Dropped in 10 of 10 Midterm Summers, Averaging 7.06% Losses
Tyson Foods is approaching a 28-session midterm-year window that has delivered consistent downside in the past, just as the stock trades near the middle of its 52-week range and investors weigh strong chicken profits against beef headwinds.
Price as of Jul 6, 2026: $58.75 (last close).

What is the seasonal pattern for Tyson Foods (TSN)?
Tyson Foods has fallen in 10 of 10 midterm-year summer windows during this 28-session pattern, with an average loss of 7.06% in winning years for the short side.
- 10 for 10 in this window for short trades, with average gains of 7.06% on the downside in those years.
- The upcoming 28-session window starts Jul 13, 2026 and is drawn from the last 10 midterm election years.
- Percent Profitable is 100%, with 10 winners and 0 losers for the short direction across the sample.
- Average loss for Tyson shares in this stretch is 7.06%, with a median decline of 7.24% over the 28 sessions.
- The TradeWave Ratio of 2.37 suggests price has typically moved meaningfully in the trade direction within the window, even before the final close.
- Intraperiod swings have been sizable, with both strong favorable moves for shorts and notable adverse rallies in several years.
According to historical data from TradeWave.ai, this midterm-year slice of the calendar has behaved very differently from an average month for Tyson Foods. The next section looks at how that pattern has played out and what it could mean for the coming weeks.
How has Tyson Foods (TSN) traded in this midterm-year summer window?
Tyson Foods has declined in all 10 midterm election years during this 28-session July–August window, averaging a 7.06% drop that has historically rewarded short exposure. The next iteration begins on Jul 13, 2026, with the stock last changing hands at $58.75, about 14.0% below its 52-week high and 22.2% above its 52-week low.
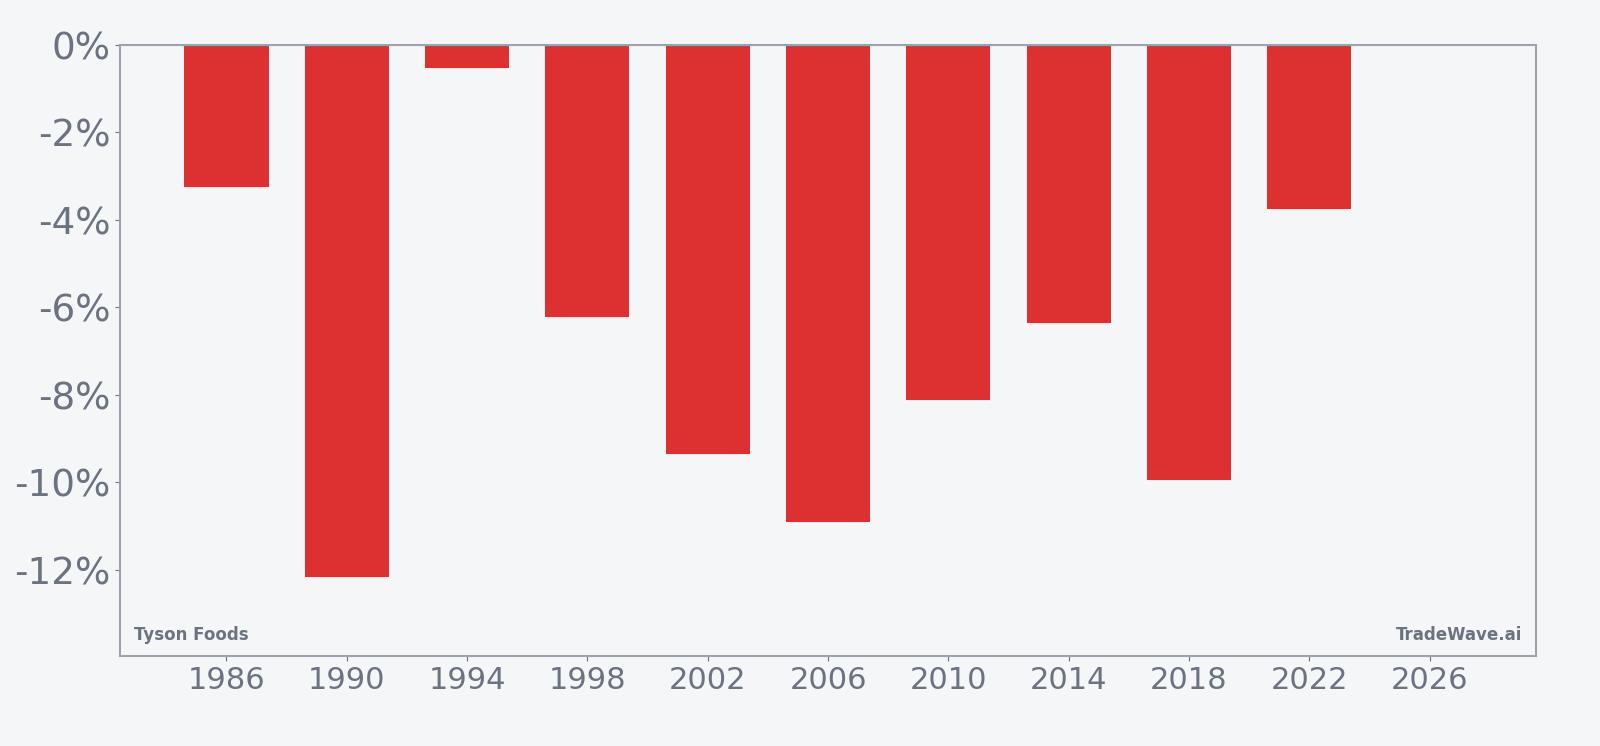
Grouping the data by the presidential election cycle matters here because this year sits in the midterm election year, a phase that often brings policy uncertainty, shifting regulation and position resets across defensives like food producers. Tyson’s pattern is drawn only from the last 10 midterm years, so it reflects how the stock has behaved in this specific macro and policy backdrop rather than across all cycles.
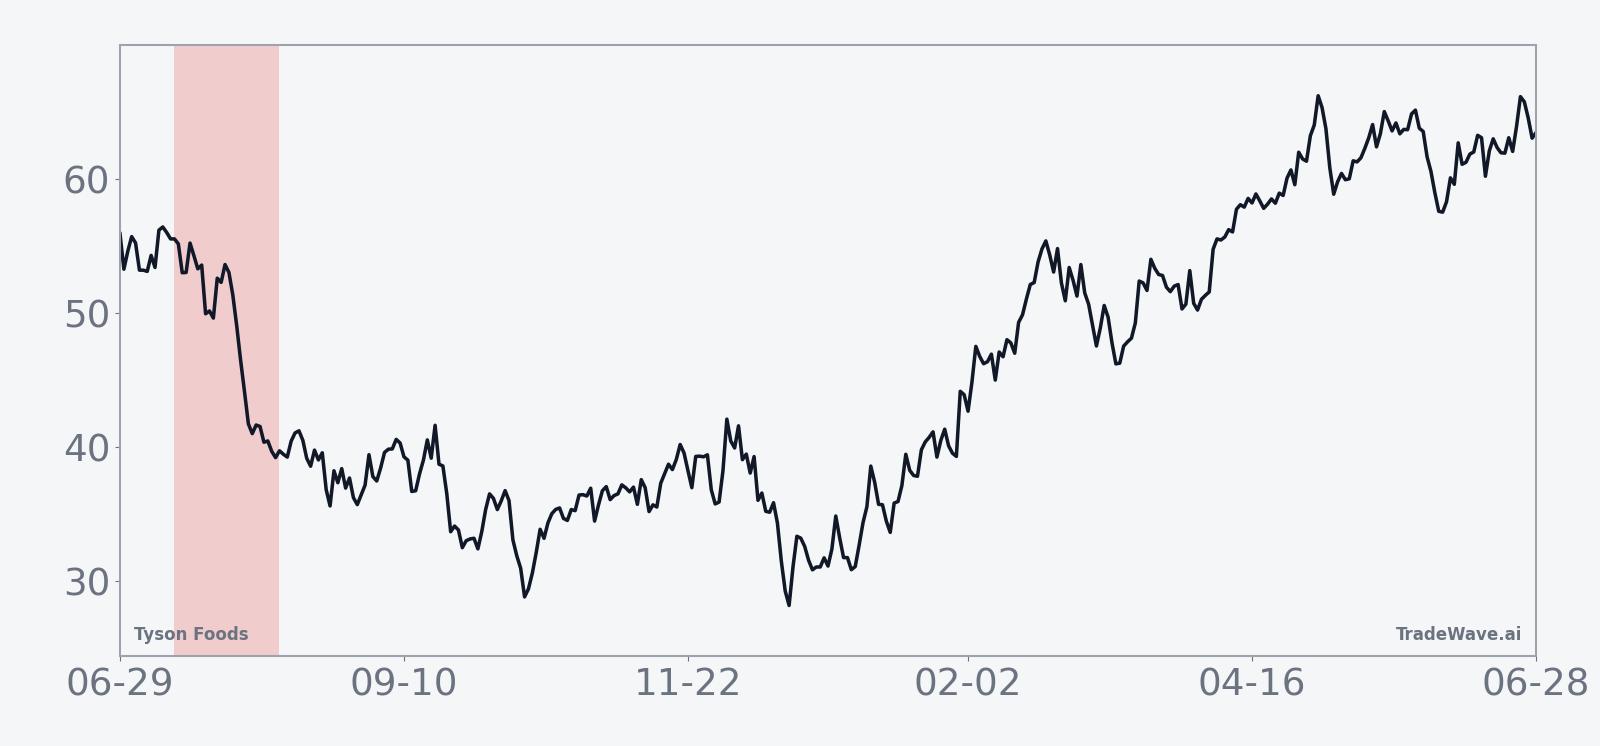
Year-by-year net returns and intraperiod swings show how consistently this window has leaned lower for Tyson shares.
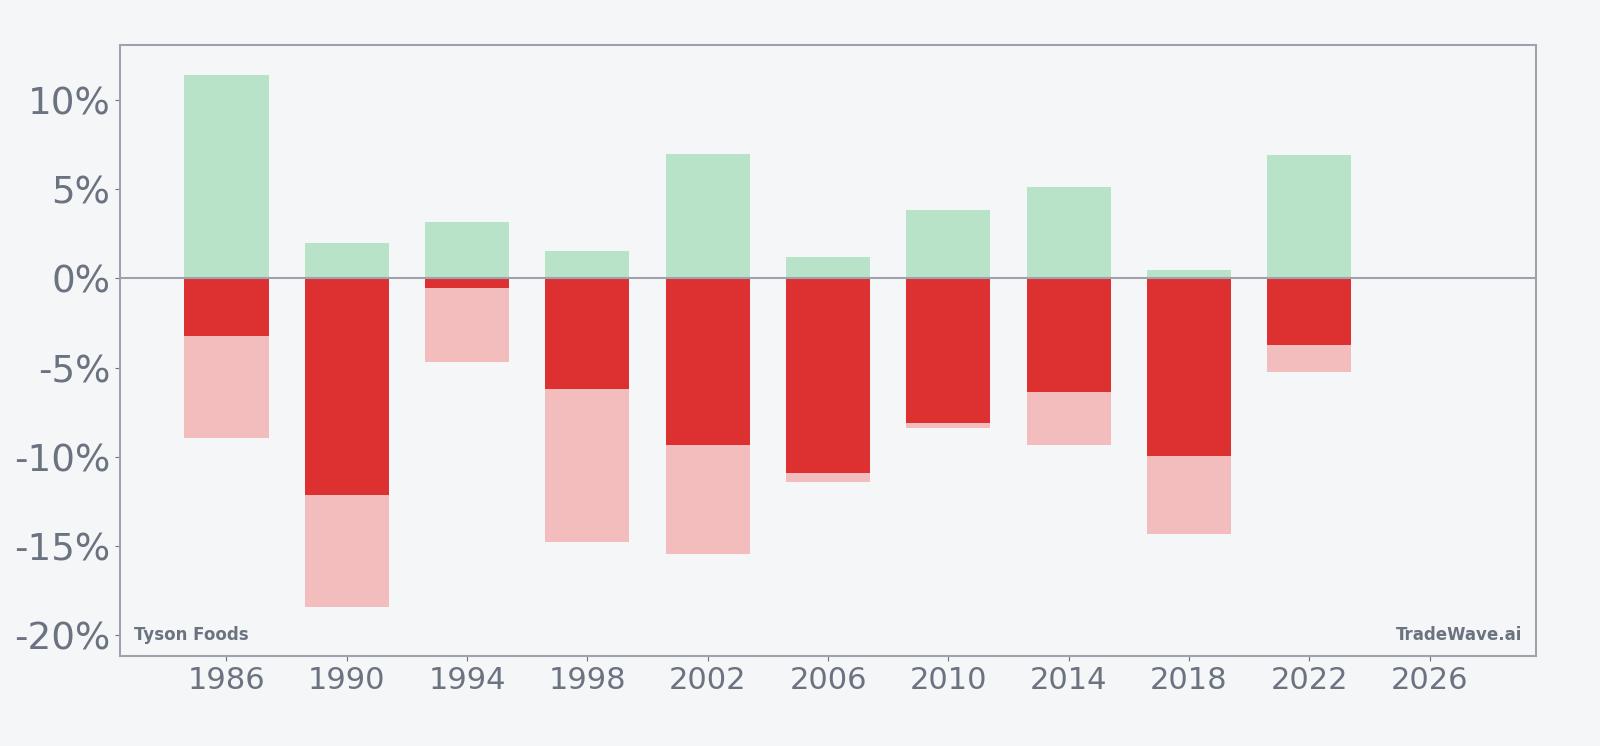
Across the 10 midterm-year samples, every single iteration has ended with Tyson lower over the 28 sessions, which is why the Percent Profitable metric for the short side sits at 100% with 10 winners and 0 losers. Average profit for those short trades is 7.06%, with a median decline of 7.24%, so the typical outcome has been a fairly uniform grind lower rather than a few outlier collapses.
The per-year table shows that the strongest years for shorts were 1990 and 2006, when Tyson fell 12.16% and 10.92% respectively over the window, while the softest decline was 0.52% in 1994. In several cycles, such as 2002 and 2018, the stock logged net drops of 9.36% and 9.95% but also saw sizable intraperiod rallies, with maximum favorable moves for shorts of 6.98% and 0.47% and maximum adverse excursions of -15.46% and -14.34% respectively, underscoring that the path has often been choppy even when the final result favored the downside.
The maximum favorable excursion, or best intraperiod move in the trade direction, has tended to build gradually rather than in a single-day shock, which fits the visual of the seasonal trend chart where the average path slopes lower across most of the window. The maximum adverse excursion, or worst drawdown against the short, has at times been deep, with several years showing double-digit rallies before the stock rolled back over, a reminder that timing and risk management have mattered even in a cleanly negative seasonal window.
The TradeWave Ratio of 2.37 indicates that, within the window, Tyson has typically traveled a meaningful distance in the short direction relative to its volatility profile, which helps explain why the Sharpe ratio of 1.81 is high for a 28-session pattern. The cumulative return across all 10 midterm-year windows is a 96% gain for the short side, which means that a systematic strategy that only traded this slice of the calendar would have stacked sizable downside exposure to Tyson over the past four decades.
History does not guarantee future results; adverse excursions can be large even in winning windows, and several past years saw sharp rallies before the seasonal downside reasserted itself.
Why does Tyson Foods (TSN) follow this seasonal pattern?
One likely driver is the way Tyson’s fiscal calendar and earnings cadence line up with the midterm-year summer, when investors often reassess protein demand, cattle costs and guidance after spring results. Analysts have also pointed to consumer spending shifts and commodity seasonality in beef and chicken, which can trigger position resets in meatpackers as retailers lock in pricing for the back half of the year.[1] This pattern may also reflect broader midterm-year risk aversion, where defensives like food producers see profit-taking as investors rotate toward sectors more sensitive to policy and growth.
What is driving Tyson Foods (TSN) today?
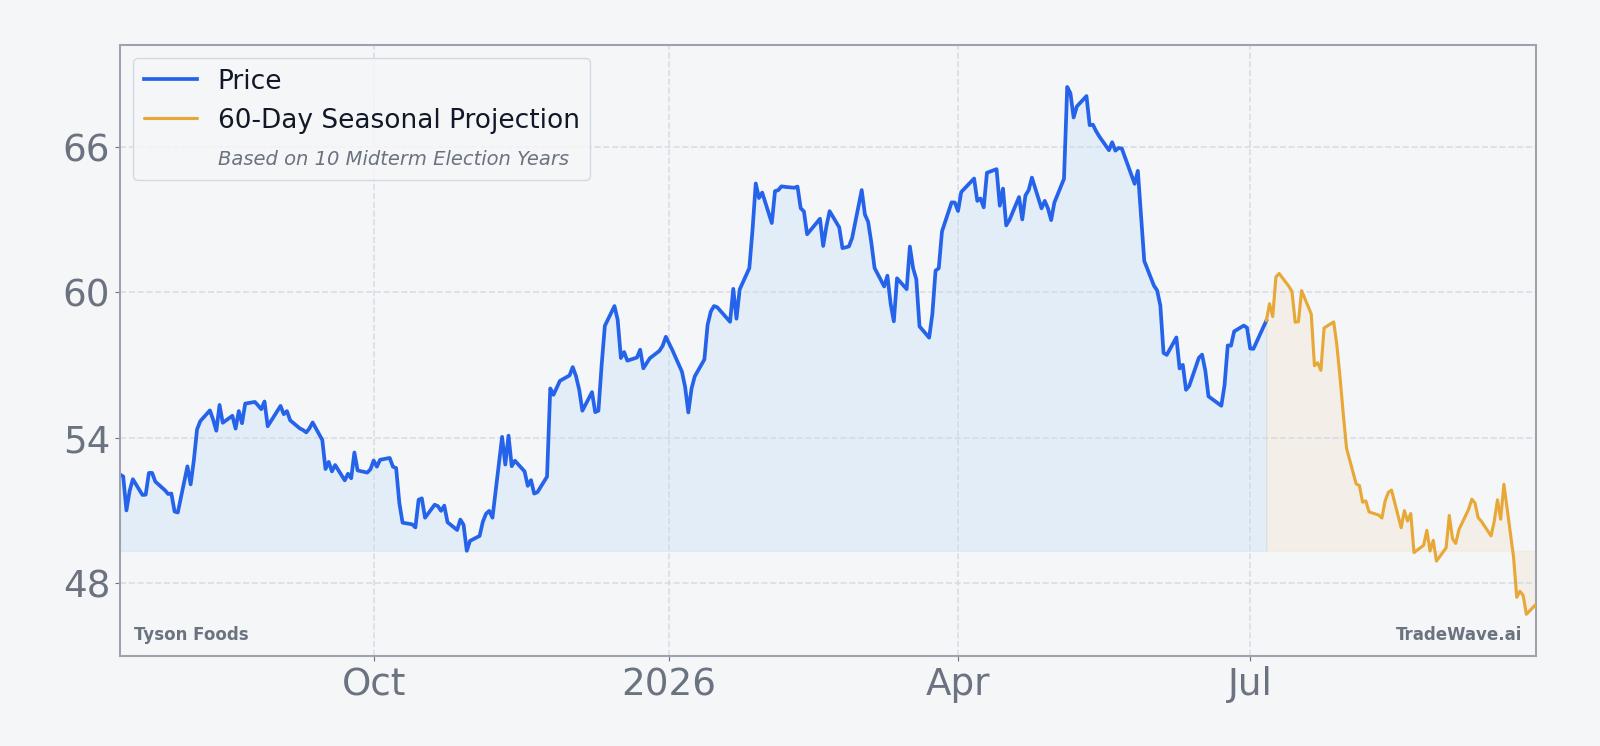
Tyson Foods closed the prior session at $58.75, down 0.24% on the day, leaving the stock roughly in the middle of its 52-week band after a modest 3.29% gain over the past month. The shares have been stabilizing as investors digest a stronger chicken business against ongoing beef pressure, with the company’s most recent reported quarter in May 2026 showing adjusted earnings per share of $0.87 on $13.65 billion in sales, both slightly ahead of estimates, and an upgraded full-year operating income outlook tied to resilient chicken demand.[1]
In May 2026, Tyson raised its adjusted operating income forecast to a range of $2.2 billion to $2.4 billion and lifted its chicken segment outlook to $1.9 billion to $2.05 billion, citing firm volumes and better margins as consumers traded down from high-priced beef to cheaper proteins like chicken and pork.[1] That shift has been playing out for several quarters: in Aug 2025, the company had already boosted its revenue and chicken guidance after reporting stronger-than-expected sales and profitability in poultry, even as beef remained a drag on results.[2]
Macro conditions in the meat complex remain a key swing factor. U.S. cattle supplies sit near multi-decade lows, which has pushed cattle costs higher and squeezed beef packer margins, a dynamic that Tyson has flagged as a reason for plant closures and segment losses.[9][12] At the same time, the broader meatpacking sector continues to face regulatory and antitrust scrutiny, including Department of Justice attention, which has added another layer of uncertainty to capital allocation and capacity decisions for large processors.[1]
The chart below situates the latest move in its recent multi-month context and overlays a 60-day seasonal projection.
What should traders watch as this Tyson Foods seasonal window approaches?
First, the calendar: the 28-session window starts on Jul 13 and runs into mid-August, so any break from the current mid-range consolidation that lines up with that timing will draw attention from traders who track historical seasonality. A downside move that accelerates during the window would be consistent with the 10-for-10 record for shorts, while a sustained rally through the period would mark the first real break in the pattern.
Second, watch how the protein mix evolves. If chicken demand stays strong while beef losses deepen, the market may continue to reward Tyson for its poultry exposure even as the seasonal window has historically leaned lower, which could blunt or delay any typical midterm-year weakness.[1][3] Conversely, any sign that chicken volumes or pricing are rolling over just as the seasonal window opens could amplify downside pressure, especially if investors start to question the upgraded operating income guidance.
Third, keep an eye on cattle supply headlines and regulatory developments. Further confirmation of tight cattle herds or new scrutiny of meatpacker pricing could weigh on sentiment and reinforce the historical pattern of midterm-year summer softness for Tyson.[9][12] A surprise easing in cattle costs or a more constructive regulatory tone would cut the other way and could help the stock shrug off what has been a reliably negative seasonal stretch.
Finally, price levels matter. On the downside, traders will be watching how Tyson behaves if it drifts back toward the low $50s, an area closer to the 52-week low, during the window. On the upside, a push back toward the low $60s and above the 50-day moving average would signal that buyers are willing to lean against the historical TSN seasonal trend rather than respect it.
Sources
- Reuters: Tyson Foods profit beats estimates on strength in chicken business (May 4, 2026)
- Reuters: Meatpacker Tyson Foods raises annual revenue forecast on resilient chicken demand (Aug 4, 2025)
- Reuters: Tyson Foods forecasts annual revenue rise as chicken demand offsets beef woes (Nov 10, 2025)
- Reuters: Tyson Foods to close US beef plant as cattle supplies dwindle (Nov 21, 2025)
About this seasonal analysis
Seasonal pattern data is sourced from TradeWave.ai, which analyzes historical price behavior across annual calendar windows going back up to 30 years. Read the full data methodology or the book The 100-Year Pattern by Afshin Moshrefi (2026 edition). Past performance of seasonal patterns does not guarantee future results. This article is for informational purposes only and does not constitute investment advice.